 News
News  Market Data
  Discover
Support: 888-992-3836
Copyright © 2023 InvestorsHub Inc.


In the markets, what goes down must go up
sharpshorts
![]()
In the markets, what goes down must go up
Register for free to join our community of investors and share your ideas. You will also get access to streaming quotes, interactive charts, trades, portfolio, live options flow and more tools.
Register for free to join our community of investors and share your ideas. You will also get access to streaming quotes, interactive charts, trades, portfolio, live options flow and more tools.
In the markets, what goes down must go up
Joshfm re: FXI and CVX patterns ...thanks for your comments and welcome aboard.
FXI has potential to run. Its chart is included in the intro message for the board (3rd chart)
and hopefully will update.
The chart below will update...

Static FXI
I don't see the pattern on the CVX daily, looks more like a DOUBLE BOTTOM pattern (another new board)
although there is a W pattern on their charts.
Since inv. H&S patterns and double bottoms are reversal patterns, there has to be a previous down trend
to be reversed IMO,... Though CVX looks strong, I dont see either pattern on CVX.


Buy pullbacks...DE...perhaps the MAR 82.50 or 85 strike
calls may look like a reasonable speculation if price
pulls back to the trend line.

MOO has been turned away at the neckline resistance around 52.50 and the indicators
are not especially favorable for an entry at this time...

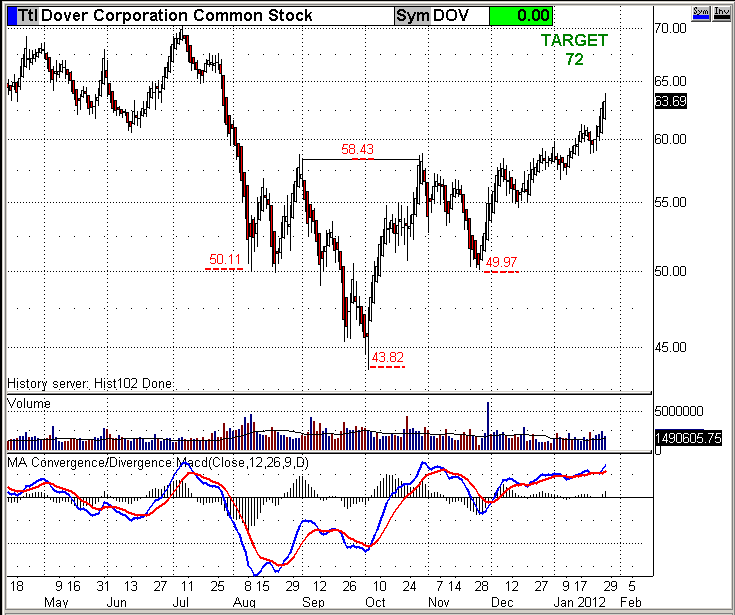
DOV ...pattern looks good but may need to consolidate the recent push. If your outlook is bullish, buy pullbacks.
Static chart:

Updating chart:
GS
This example could be a double bottom or a triple bottom depending on your perspective...

Finviz's automated technical feature currently shows a nice trend line break on big volume
after first re-testing its resistance.
TheKingFool re: BAC...
Beware the potential for the double bottom to continue singing its reversal tune...
Since December's low, BAC has had little trouble breaking
trend lines and horizontal resistance with volume...
Between GS (3B chart) , JPM (2B chart) ) or BAC (2B or 3B) - - who is hated more?
This 2B dragon could have wings.

Smoothie - what trading vehical do you use for your COMPQ plan?
Just curious, do you use the Q's, QLD and/or QID...individual stochs...other? Thx
UGA chart...trend line break...
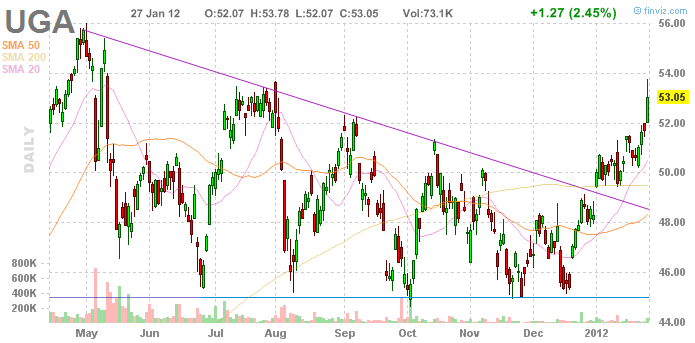
Inverted head and shoulders...
Inverse H&S patterns for the bulls...
Finviz's pattern sreener can be interesting for perusing chart patterns, Oversolds, Overboughts, etc.
This link goes to their Inverse H&S technical charts...example chart from page:

I noticed lots of closed end, country and ETF funds were picked by the screener as well as individual companies.
I've gathered 15 of the finviz charts and annoted the patterns using Heinkin-Ashi candles.
Dover Corporation example is embedded below...To veiw the rest of the charts click here.
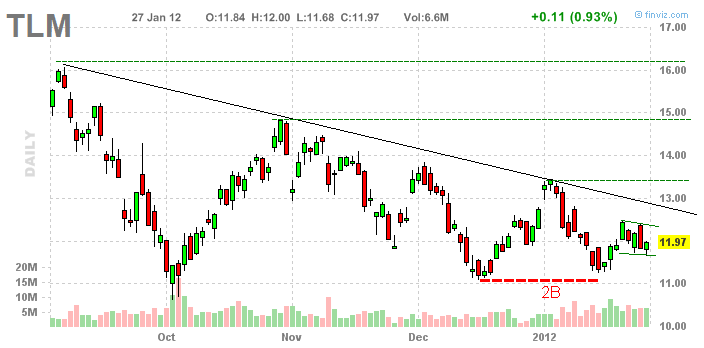
TLM 2B...bullish
iHub Direct link URL:
Dynamic chart URL from finviz publish page:
(see if it updates)
iHub Embed link URL:
(see if it updates)
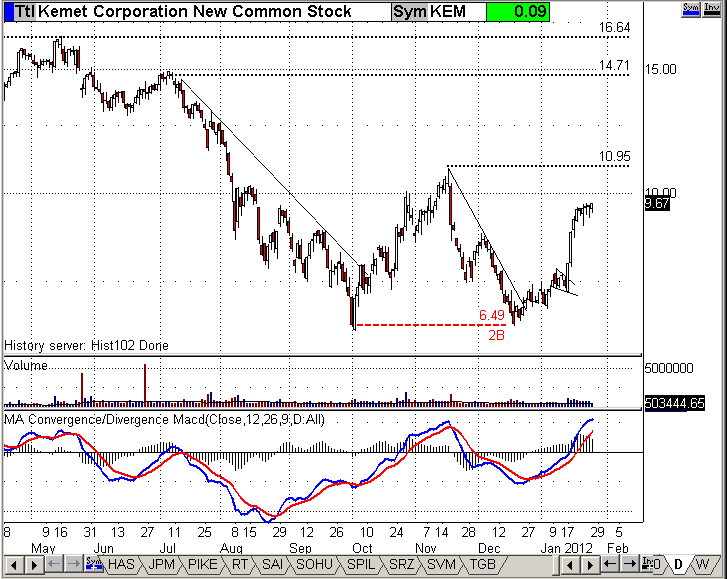
2B dragon pattern KEM...bullish
(2B dragon chart example)
re: macbook
Have never used Apple products so am at a loss...
Though I'm assuming that they have some kinda screen snapshot or window snapshot program to capture what's on the screen or in the active window.
If not, try a free download from Gadwin - PrintScreen 4.6 .
This little program let's you drag a rectangular area around whatever is showing on the monitor(s) to capture an image and to save it to a file...I've used it for years but now that I have suggested it, I wonder if it'll work on an Apple product/operating system...
surfcat ... RE: how to copy charts
I'd like to see your charts posted here...
If they show on your monitor(s) you can use the keyboard's Print Screen key to copy them to the 'clipboard'...then open Microsoft Paint and paste them in there (you can edit the charts with Paint to crop, to remove account numbers or to add annotations). Then name and save them to any file on your hard drive...
Then upload the chart pictures directly from your computer to iHub - click More Tools>My Image Gallery ... iHub provides the image hosting service and the Direct Link that's needed for including an image or chart into your posts.
It sounds more complicated than it is...your charts will show up when you click the Preview button after you compose your message, before you click the Submit button...
2B dragon streamer...(delayed)...
testing the streamer feature...
JPM 2B Dragon pattern ...bullish
2B Dragon pattern example


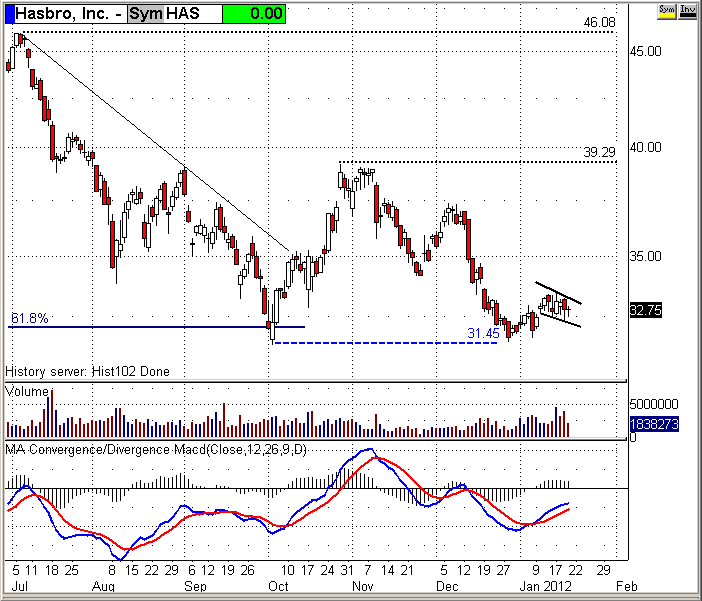
HAS 2B Dragon pattern...bullish
2B Dragon pattern example

Re: 2B dragons… reply to eastunder
I heard of the “dragon” pattern years ago from a trader who posted charts on dacharts.com , in Buffy’s Bline room. His was an intra-day pattern describing the price action he saw in the e-mini futures charts. I applied the idea to double bottom patterns on daily charts and dubbed them 2B dragons…
In answering your questions, bear in mind that every 2B dragon is subject to interpretation by the viewer … the rear feet, front feet and hump are easily ID’ed but the tail target(s) and head are not always as easy to see.
SOHU’s chart is not a particularly ‘good looking’ dragon compared to the Alcoa chart example but the top of SOHU’s tail would be ($109) on that chart because that’s where the down trend started… Double bottoms, i.e. 2B dragons are trend reversal patterns IMO, so SOHU’s price action ‘should’ reverse or retrace the down trend from the tail….$69 is the top of the dragon’s hump and a likely resistance area…$83 and $89 are shorter term “top of tail” target areas.
Determining the dragon’s “head” is just as subjective as deciding on a top of tail…SOHU’s dragon head consolidation may have already happened in late DEC or early JAN…OR it may happen near the hump at $69 as you speculated. That level did serve as both support in JUNE & AUG and as resistance in OCT.

2B dragon double bottom pattern potential TNK...bullish
NOT a particularly good example of the pattern.
Click the link to view a classic 2B dragon chart...

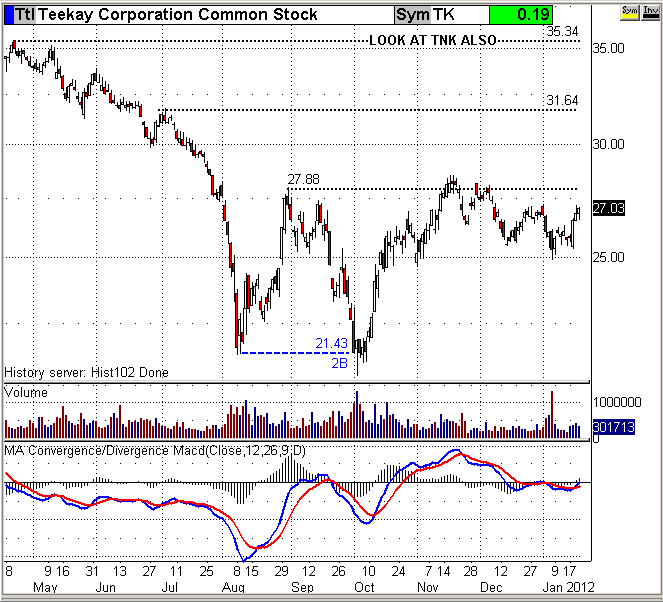
2B dragon double bottom pattern potential TK...bullish
2B dragon double bottom pattern potential TGB...bullish

2B dragon double bottom pattern potential SVM...bullish

2B dragon double bottom pattern potential SRZ...bullish

2B dragon double bottom pattern potential SPPR...bullish

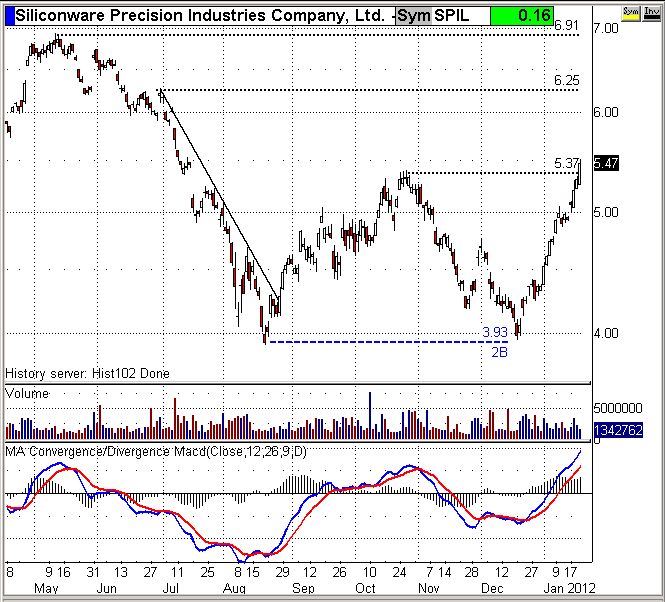
2B dragon double bottom pattern potential SPIL...bullish
2B dragon double bottom pattern potential SOHU...bullish

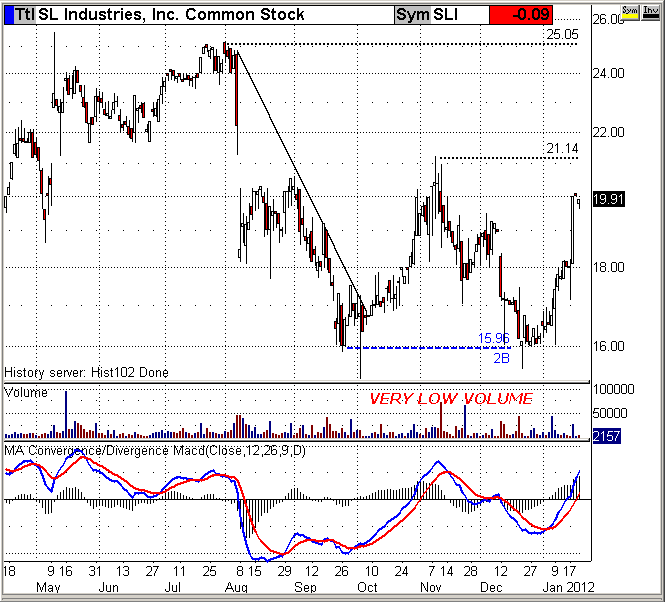
2B dragon double bottom pattern potential SLI...bullish
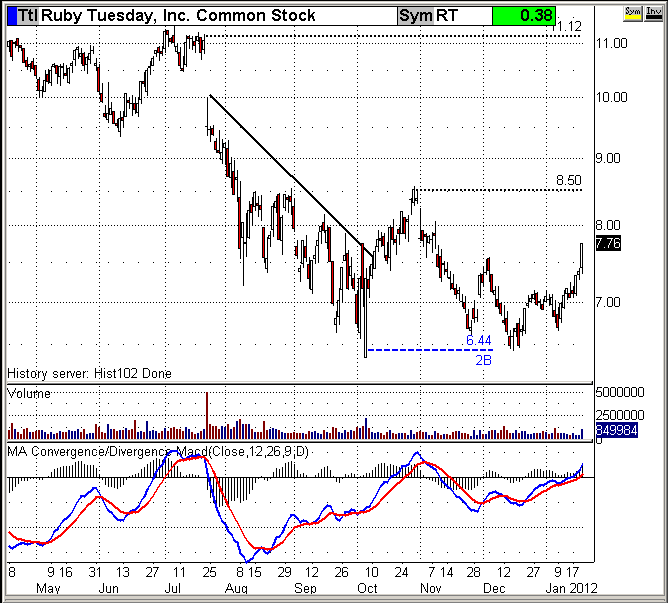
2B dragon double bottom pattern potential RT...bullish
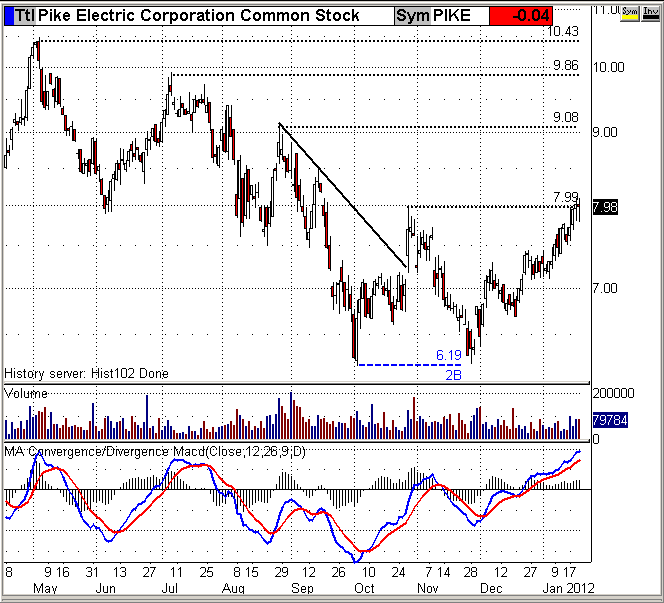
2B dragon double bottom pattern potential PIKE...bullish
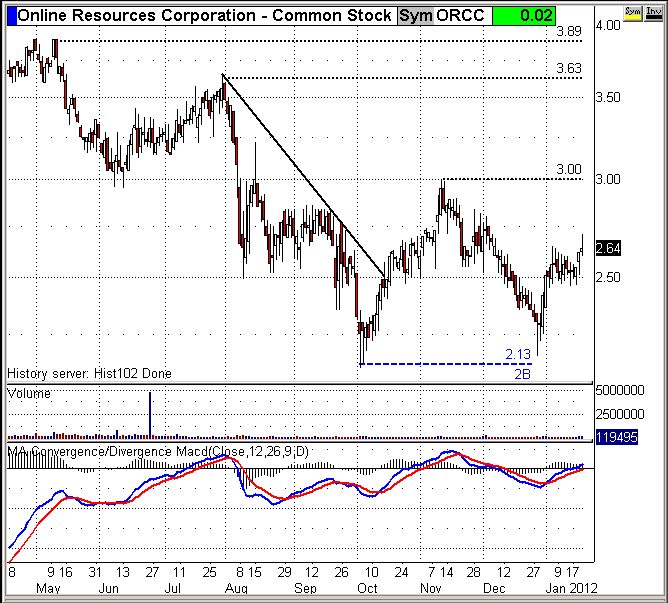
2B dragon double bottom pattern potential ORCC...bullish
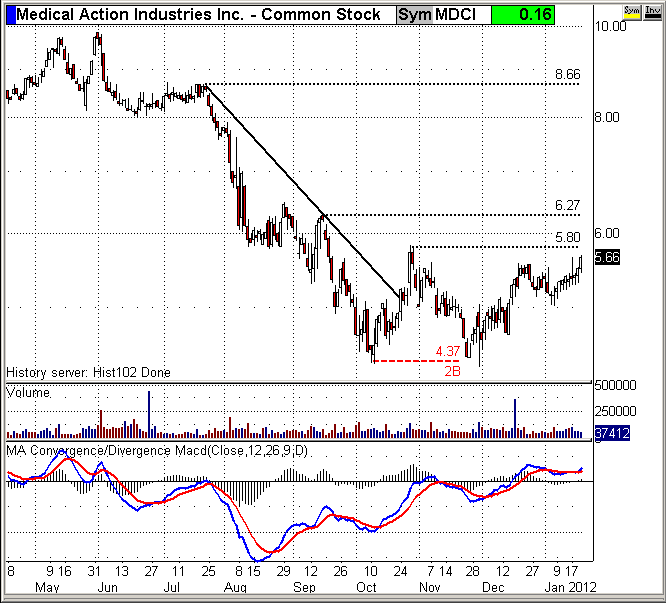
2B dragon double bottom pattern (MDCI)...bullish
Adding double bottom candidates to the watch list...
if the markets oblige and continue up this year.
Some recognized names like Sohu.com (SOHO) and Teekay Tankers (TNK) are included-- a wide range of sectors and industries --
(Note-- if you right click the link(s) below and select "Open in new window" (or tab) you won't loose iHub's page)
Link to potential double bottom 2B dragon annoted charts
Link to a "Classic" 2B dragon double bottom example:
slamminsam RE: posting photobucket charts on ihub...
Use photobucket's "Direct link" to copy the http// code and paste that into ihub's "Compose your message" box.
Highlite the http// code and click the "Image" button...ihub does the coding for you.

Click 'The New CS Board' (underneath the rectangular ads) to return to the list of posts.

Hello folks. Here's my DOW daily chart.
The wedge may need to resolve downwards...

Testing the features here, so far so good.


