News
News  Market Data
  Discover
Support: 888-992-3836
Copyright © 2023 InvestorsHub Inc.


Register for free to join our community of investors and share your ideas. You will also get access to streaming quotes, interactive charts, trades, portfolio, live options flow and more tools.
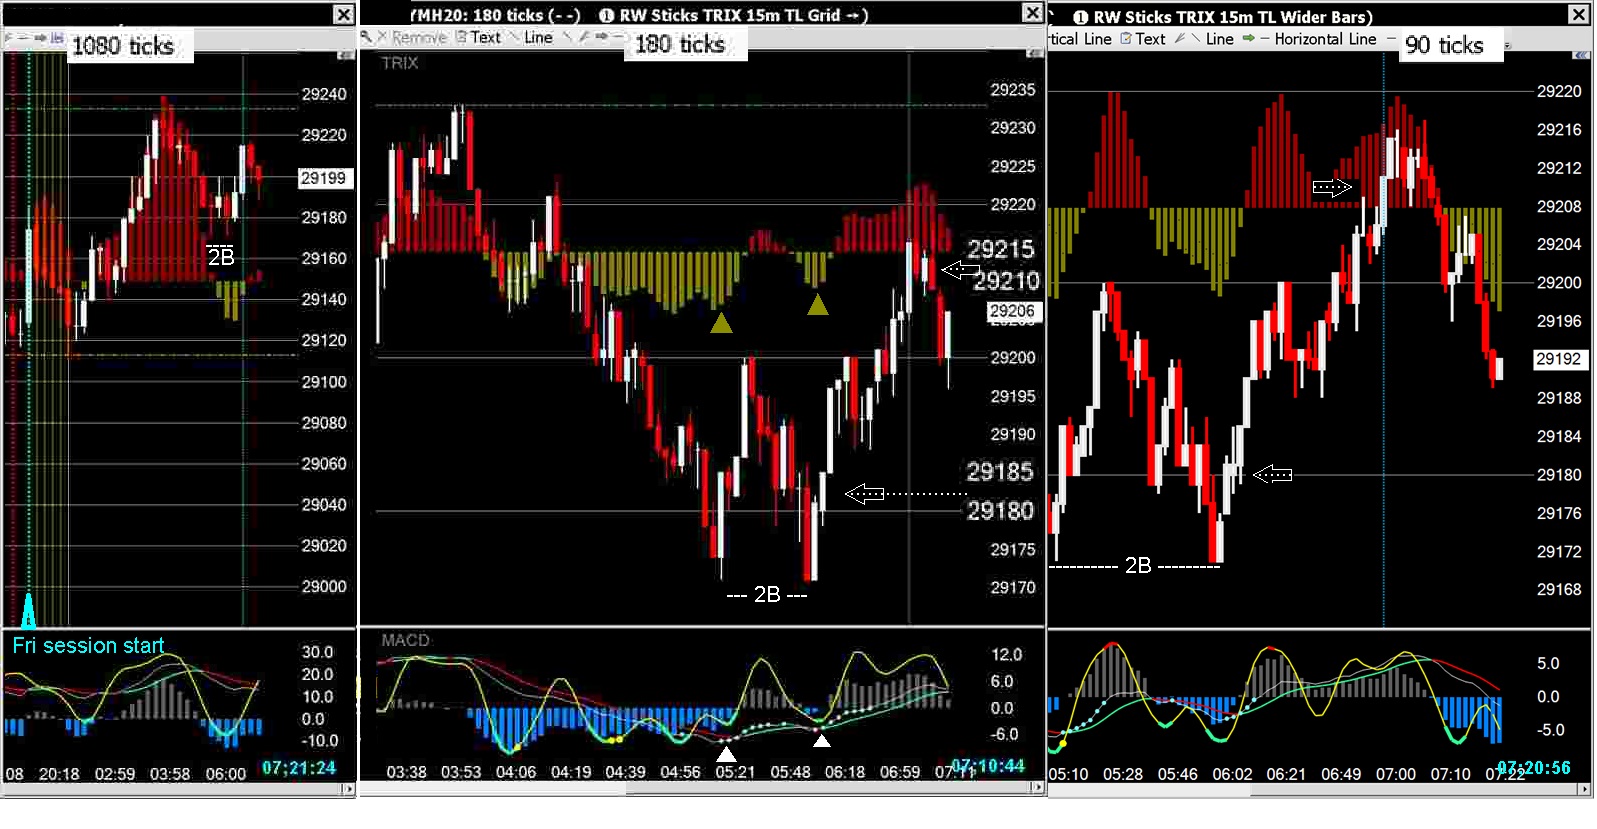
Patterns to pay attention to ... that PAY ! ! !

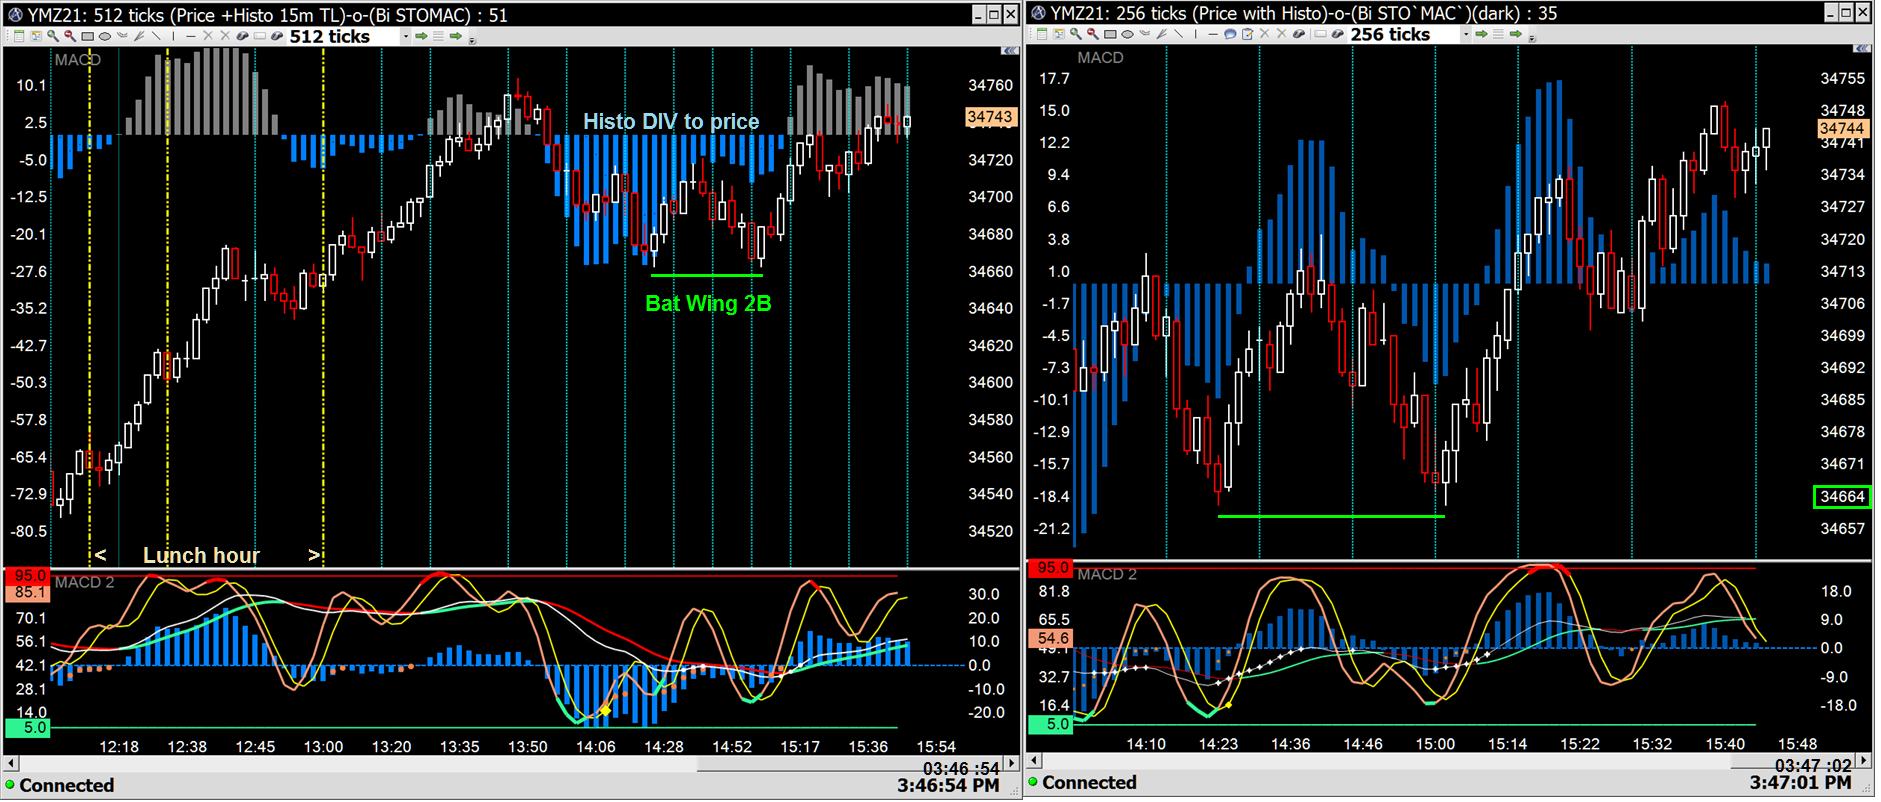
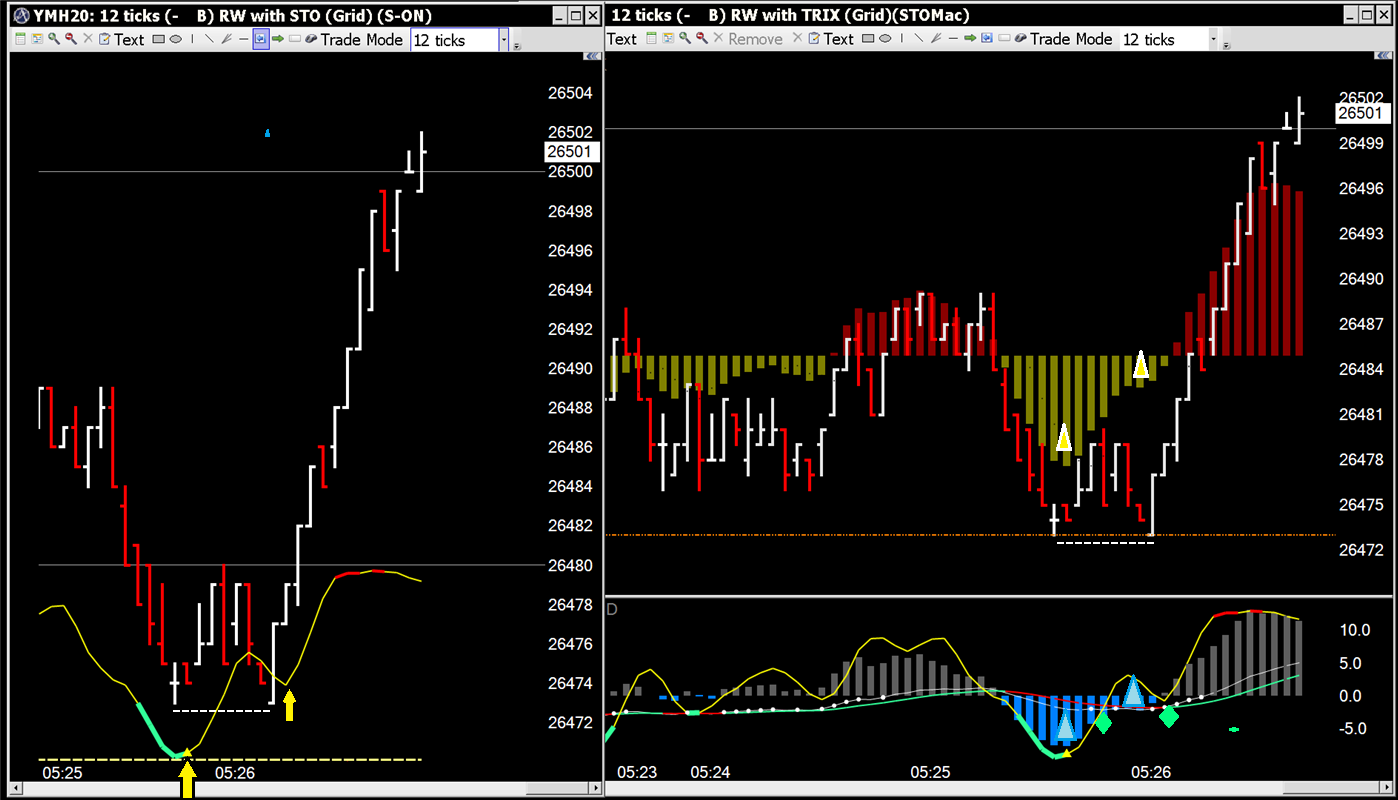
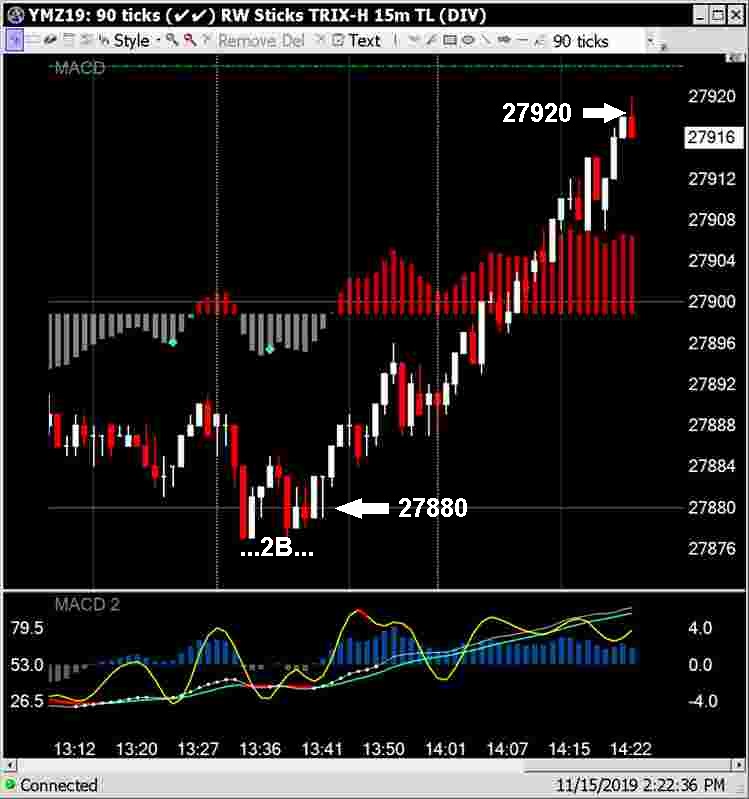
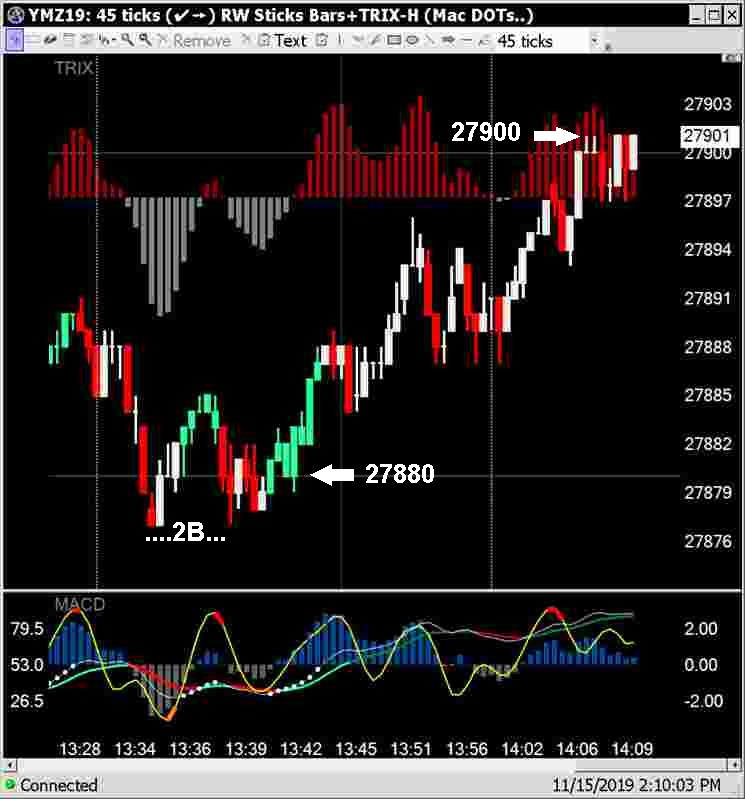
Bat Wing trend continuation pattern...
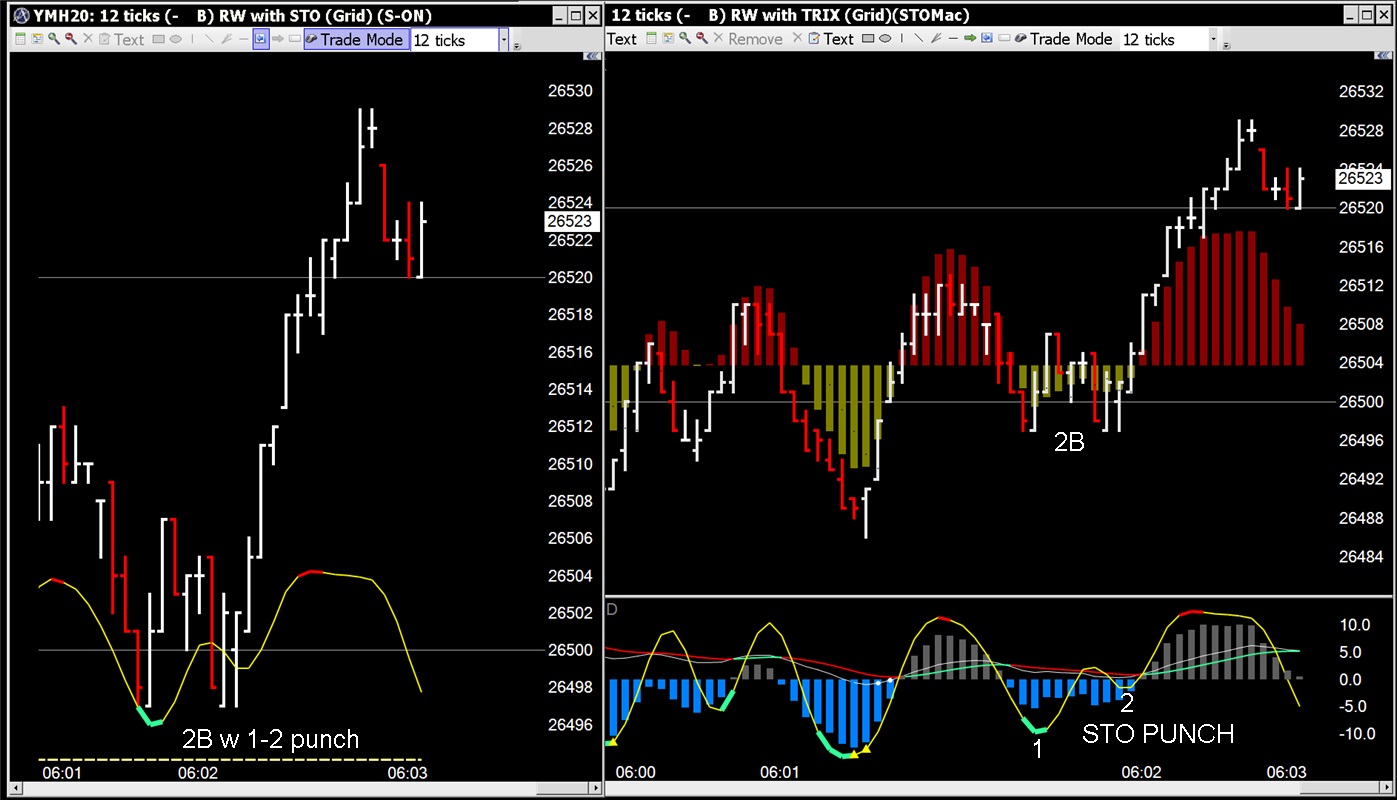
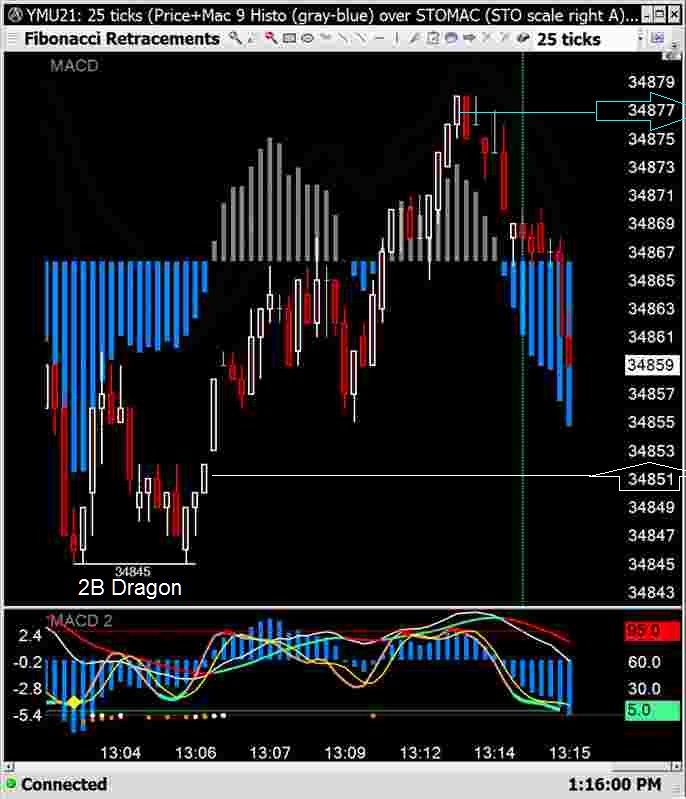
The Bat Wing 2B double bottom . . Nice 80 point ($240 per contract) reversal of a minor pull-back..
These happen in up trends and are continuation patterns....
They reverse the short term trend but have the same look as the
2B Dragon pattern which happen in down trends and are reversal patterns...
Price Action Patterns show across ALL time-frames
(Indicator Patterns may not)

250 points is $1000 per contract ... .... (if you correctly guess the range).
As little as $500 is required to trade 1 contract.

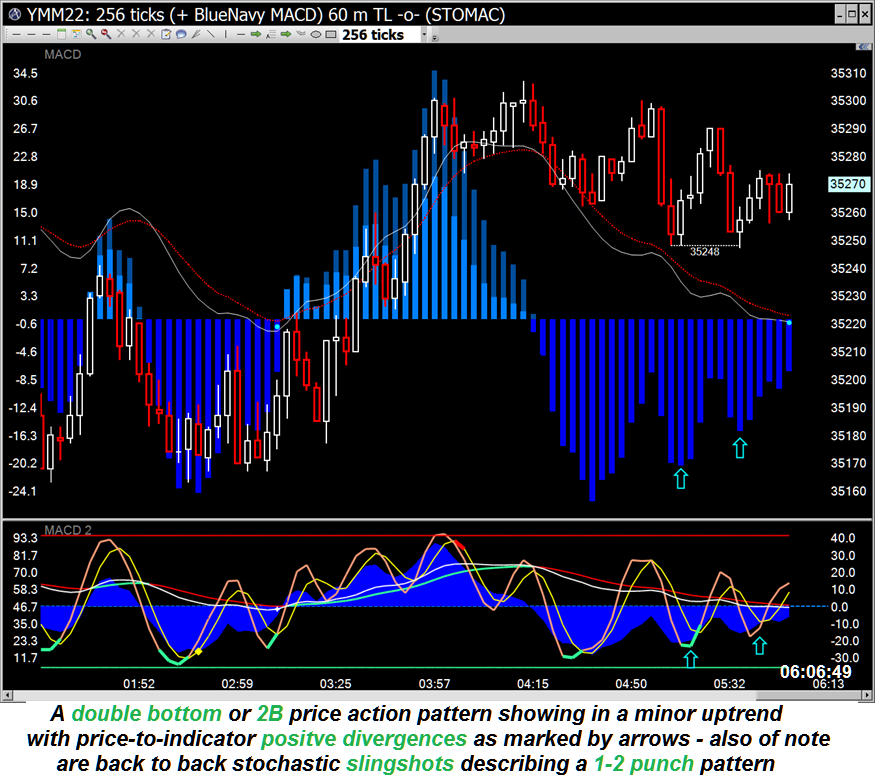
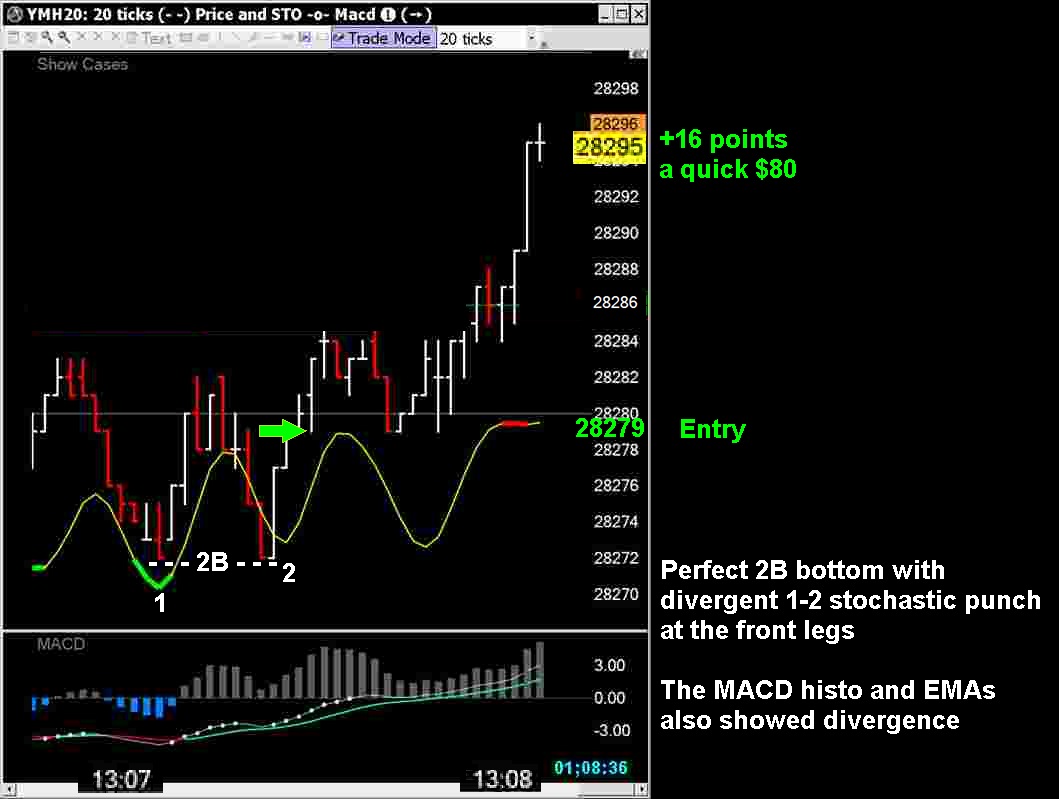
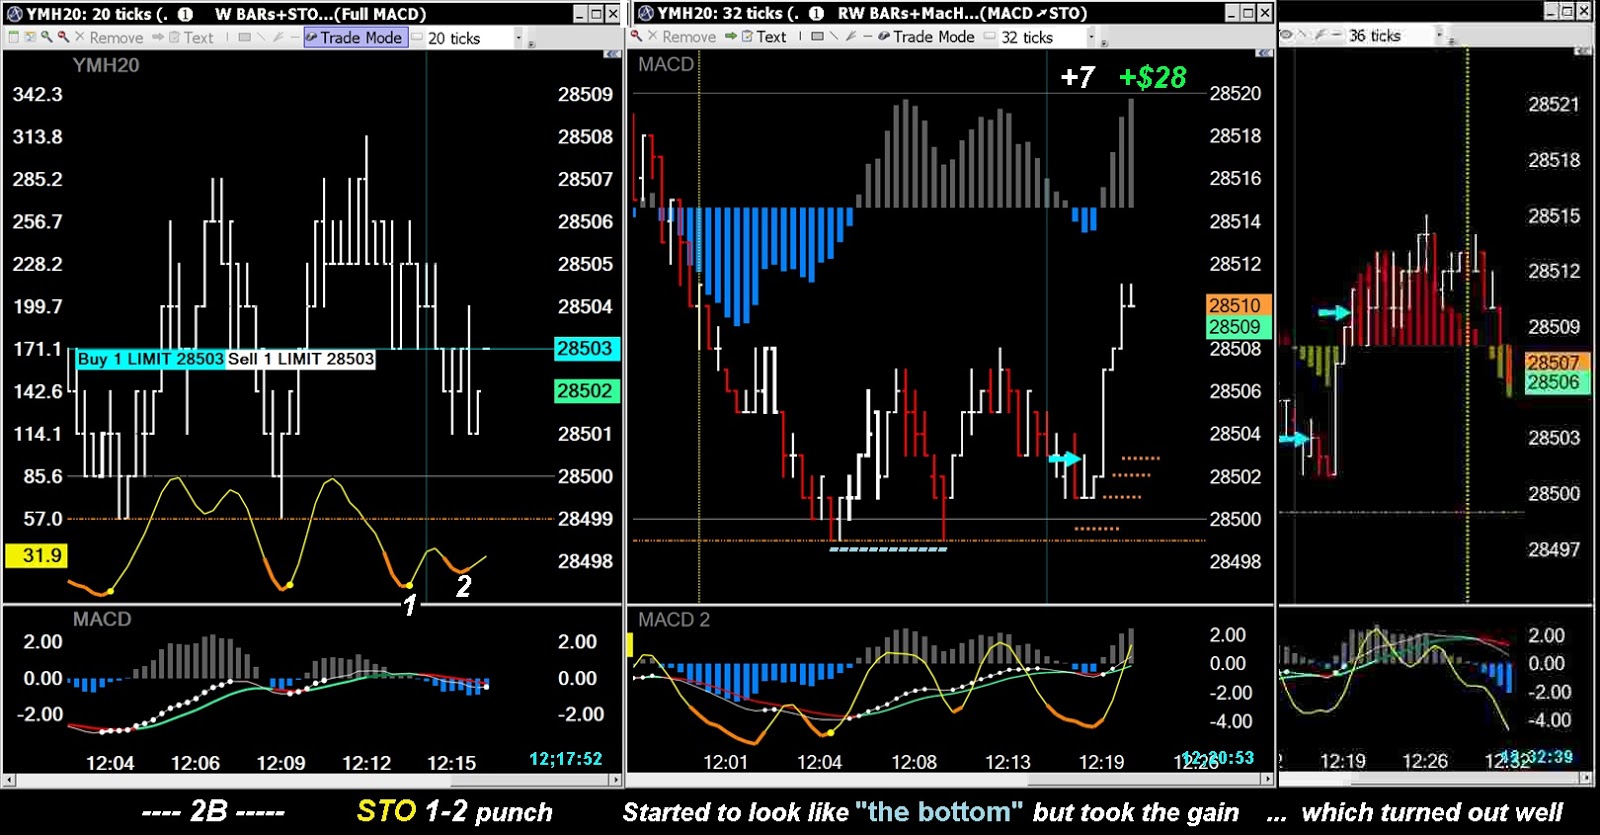
Nice $200 Divergent 2B Dragon bottom reversal
1-2 punch could have been traded...and the 2B 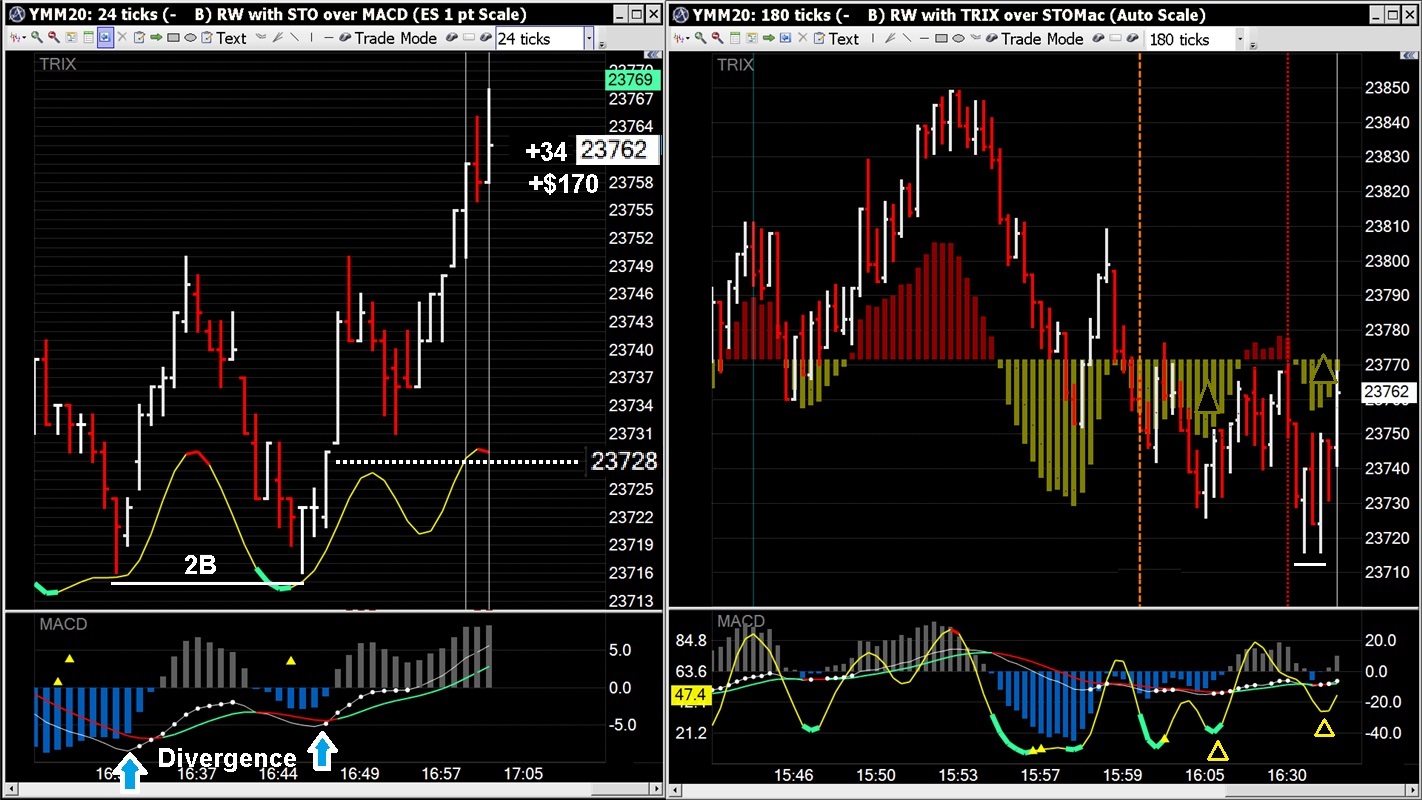
Artificial 2B Dragon pattern due to trade halt...
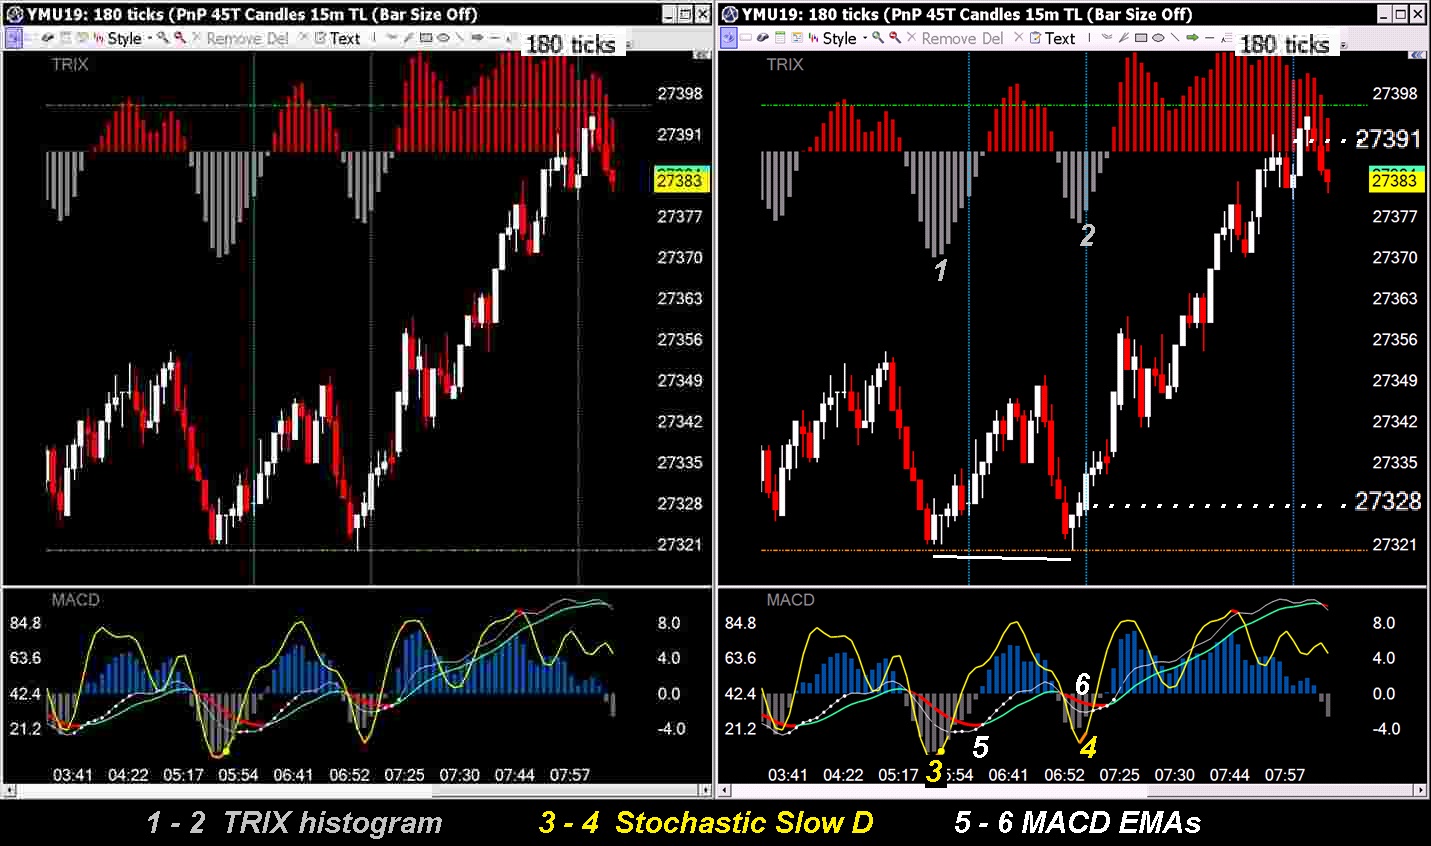
3xD price to indicator divergence too.
Divergent 2B good for $100
Price low to histogram lows, stochastic 1-2 punch and flat MACD EMAS
+$280 so far (a 1/2 hour later)
Scalp...ya gotta decide quickly...the entire trade lasted less than a minute
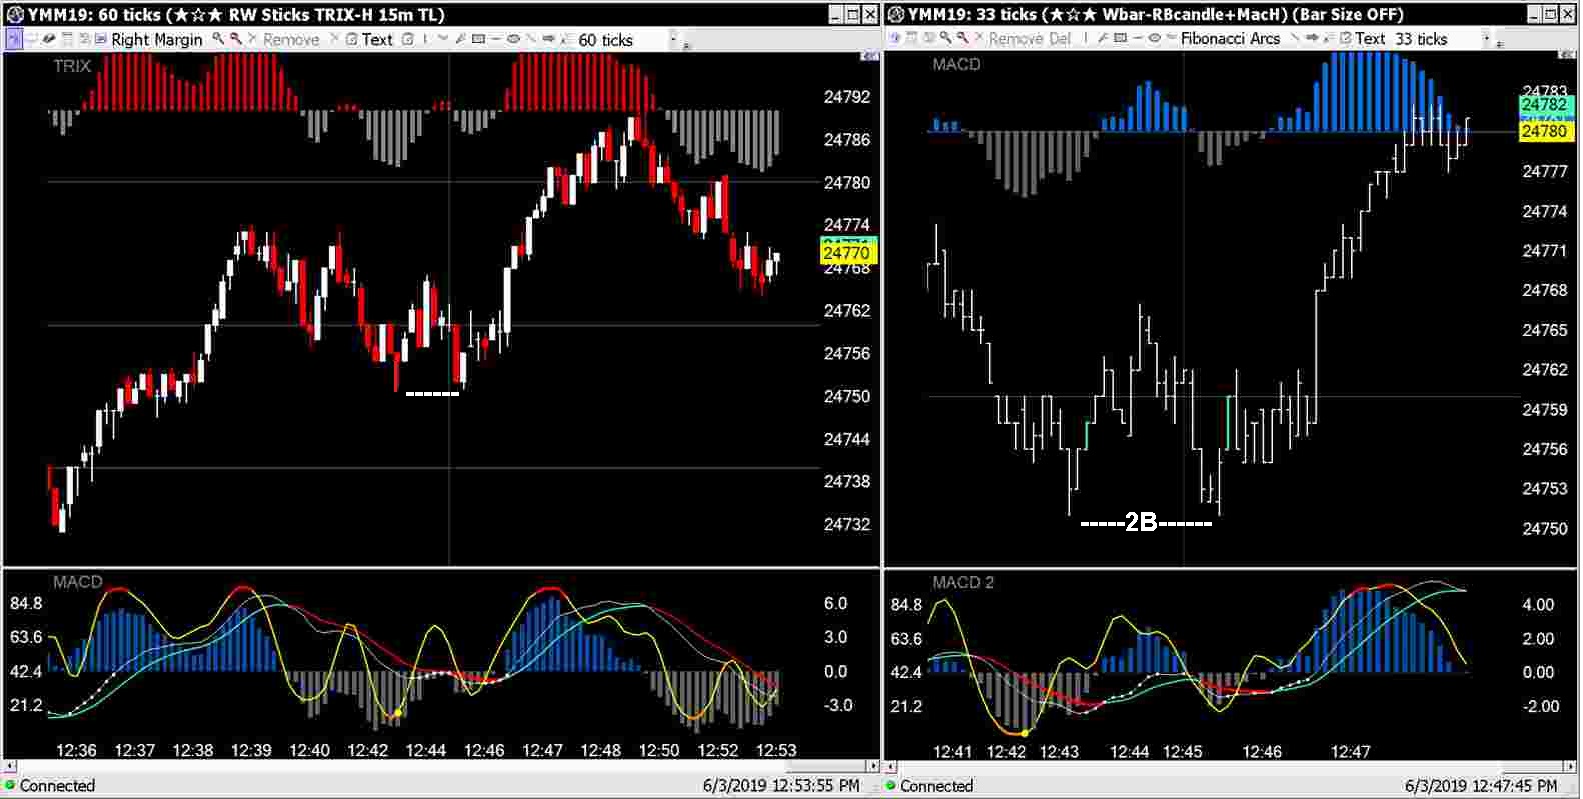
Another 2B another $150
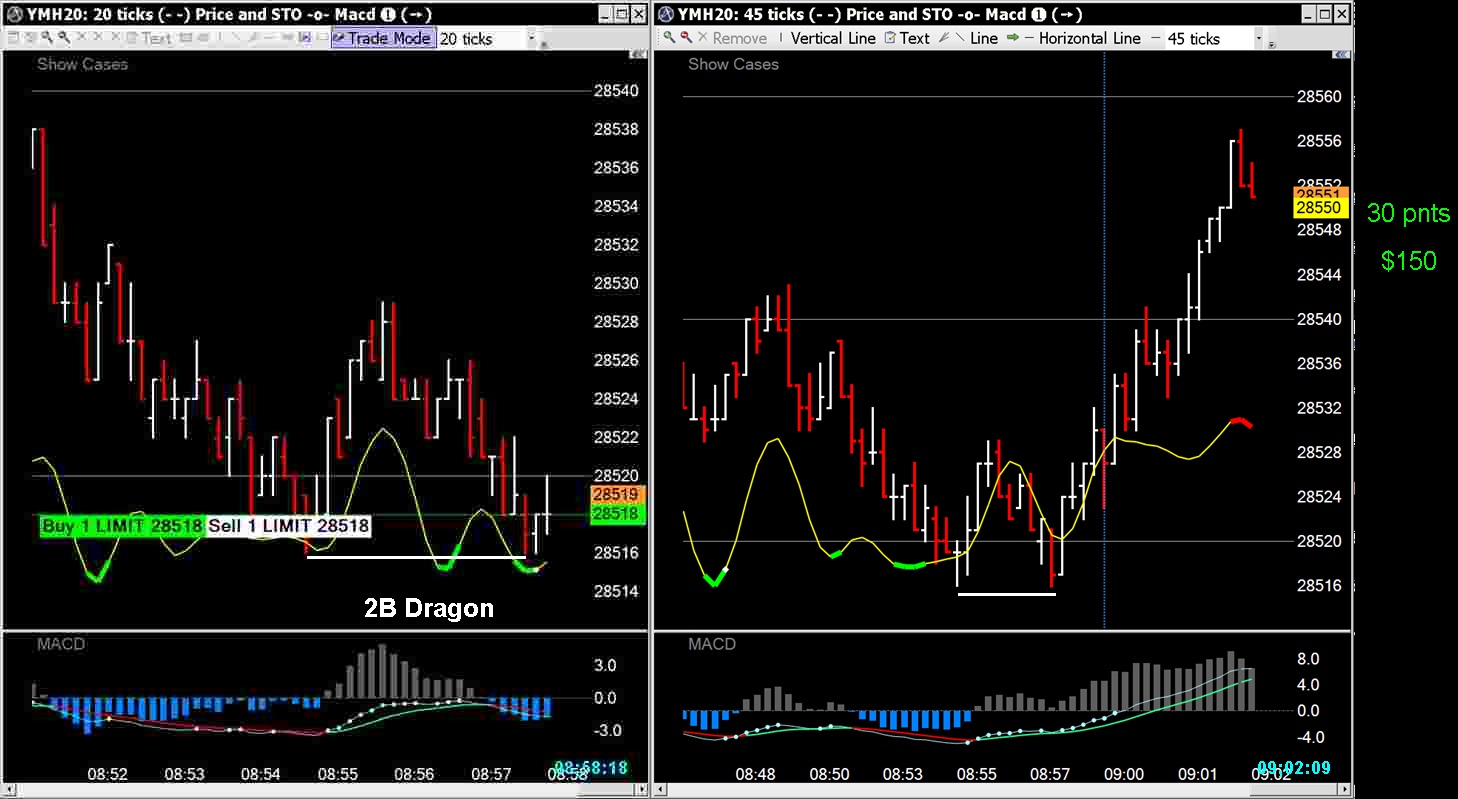
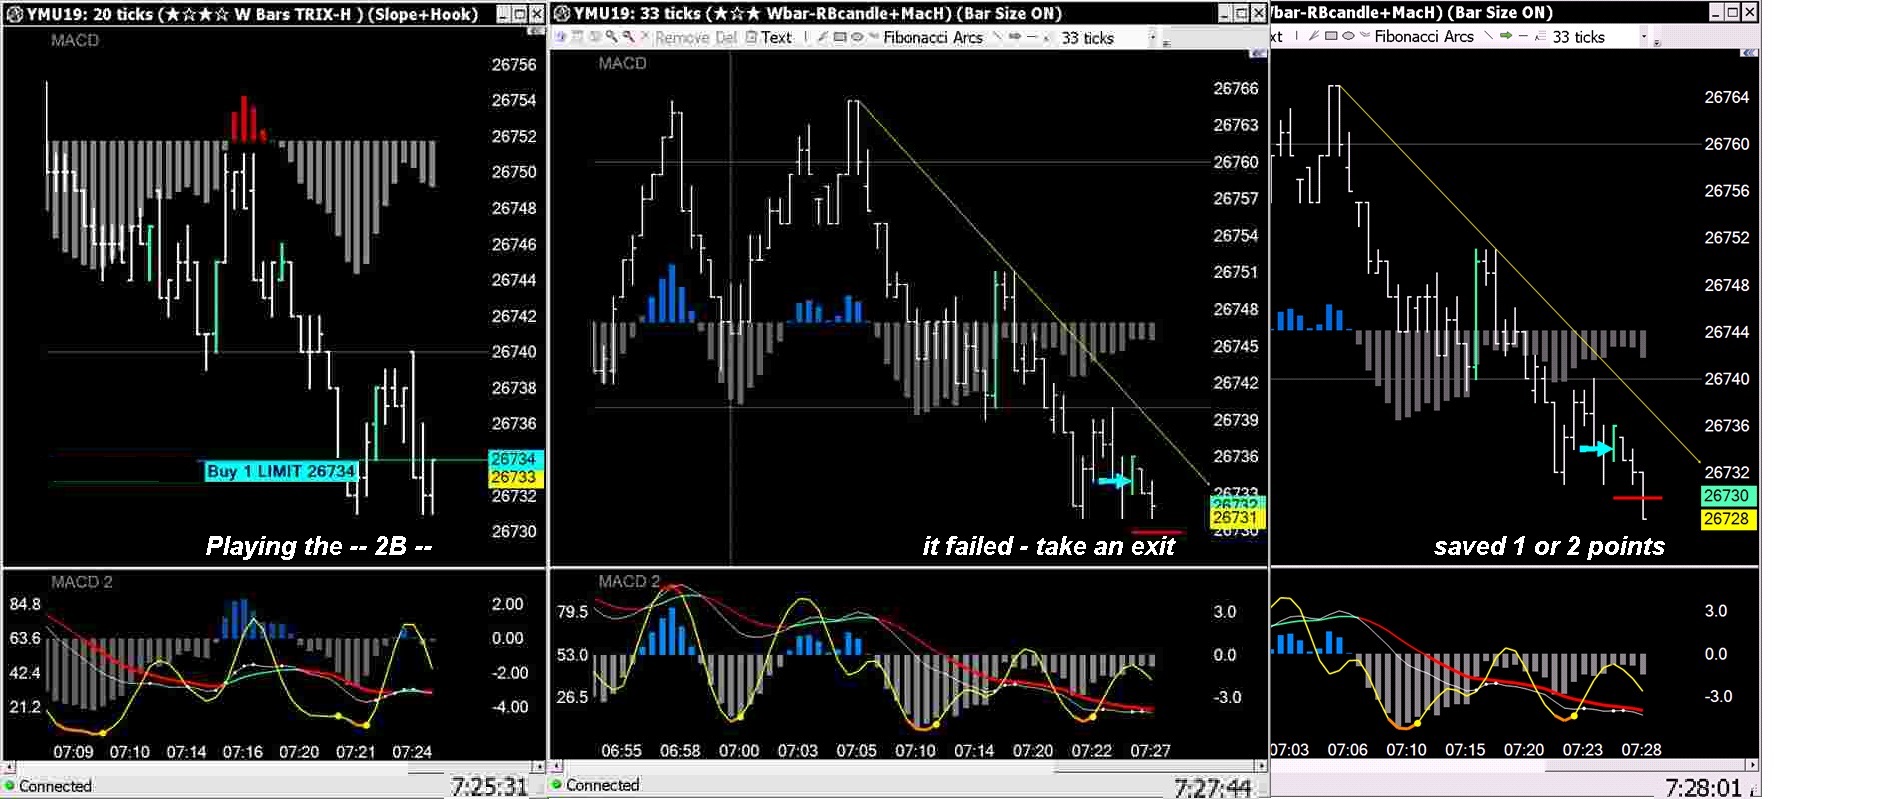
- 2B -
30 point range is $150
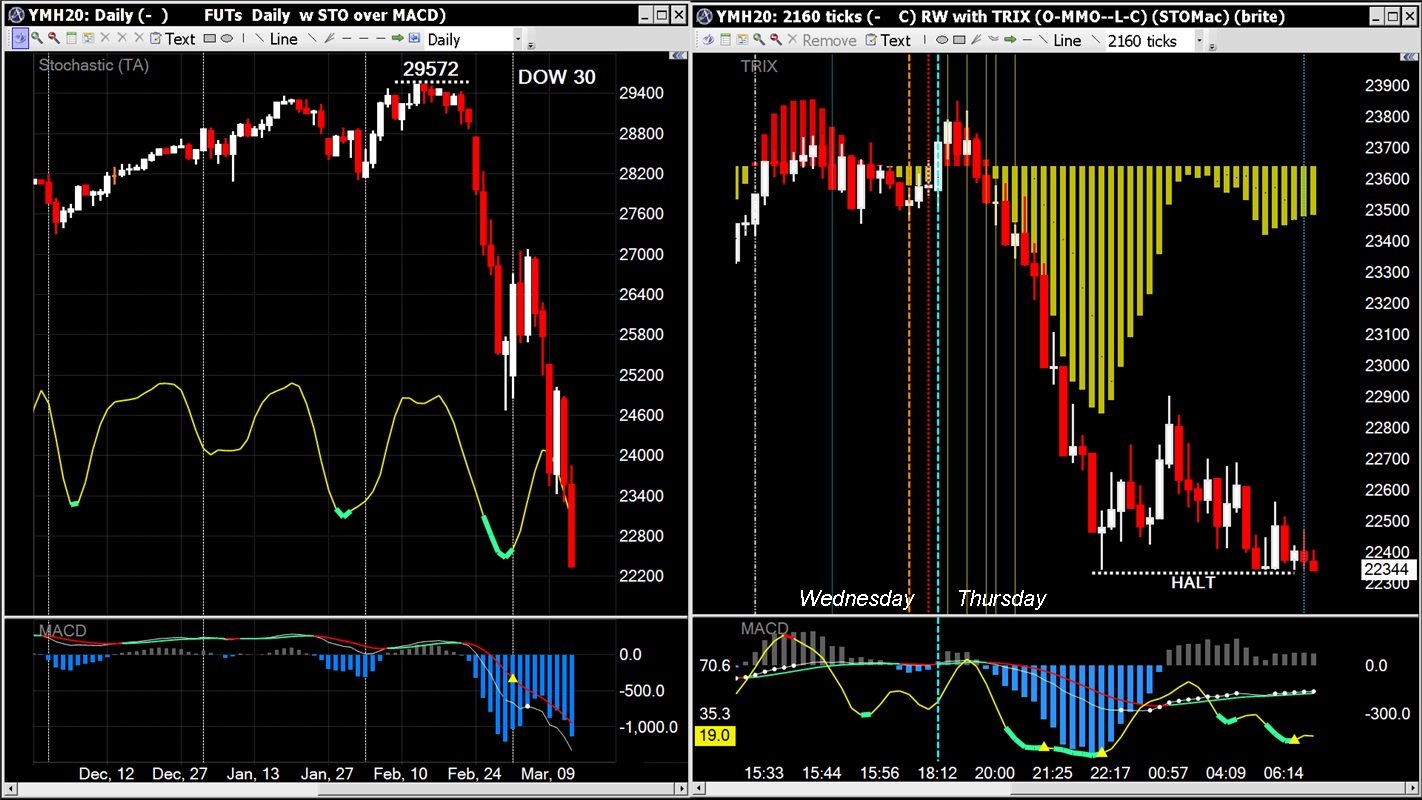
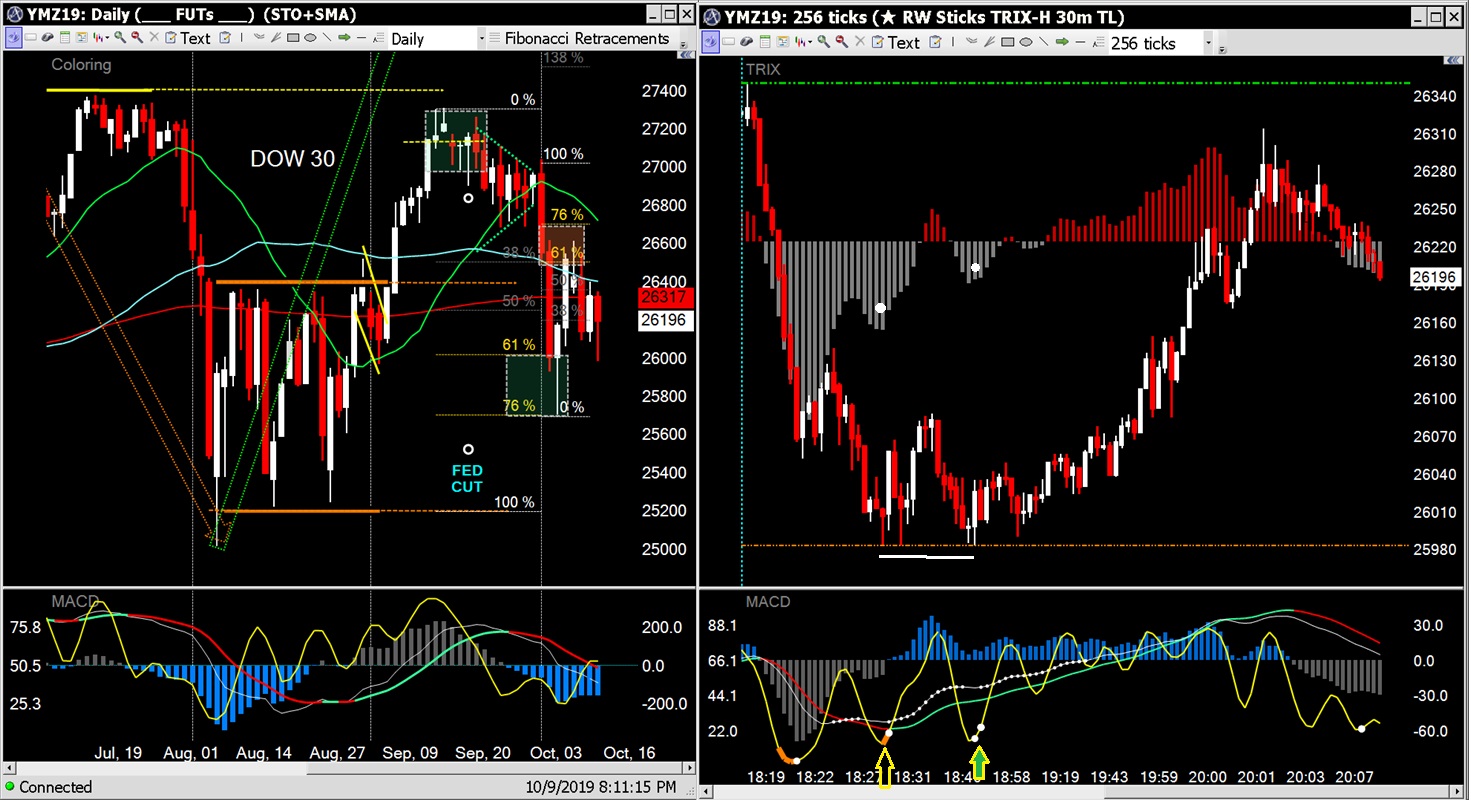
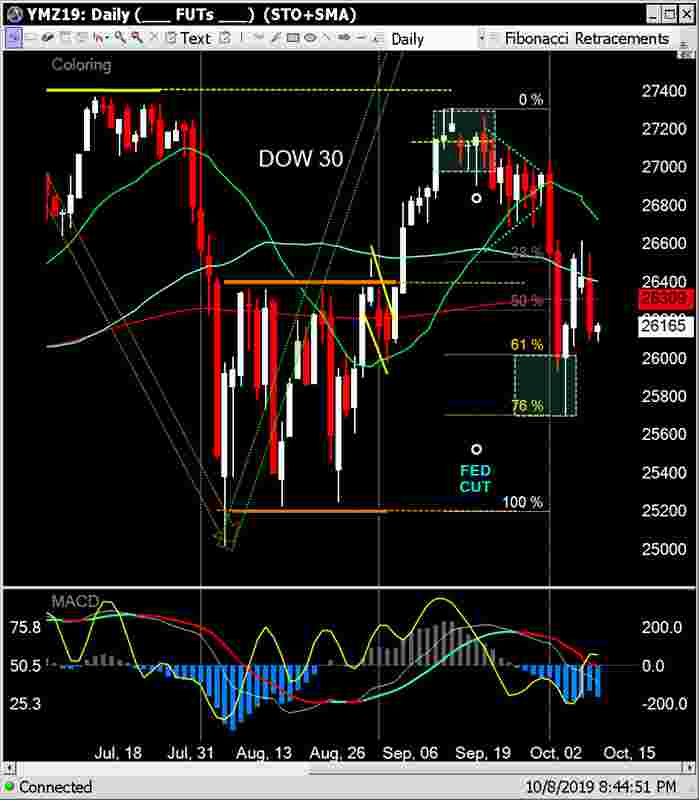
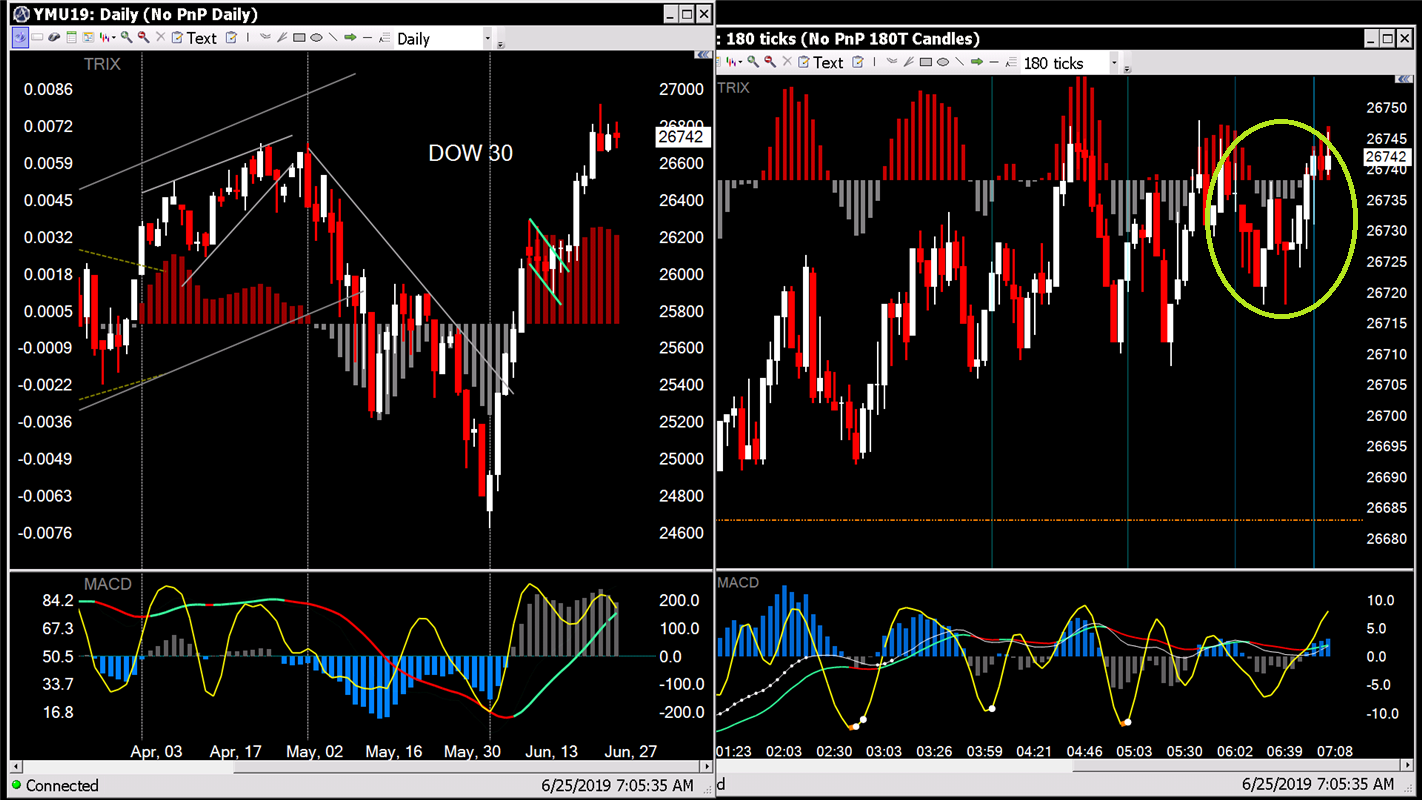
200 point double bottom today (not a 2B)

The daily currently shows a Long Lower Tailed Doji reversal candle
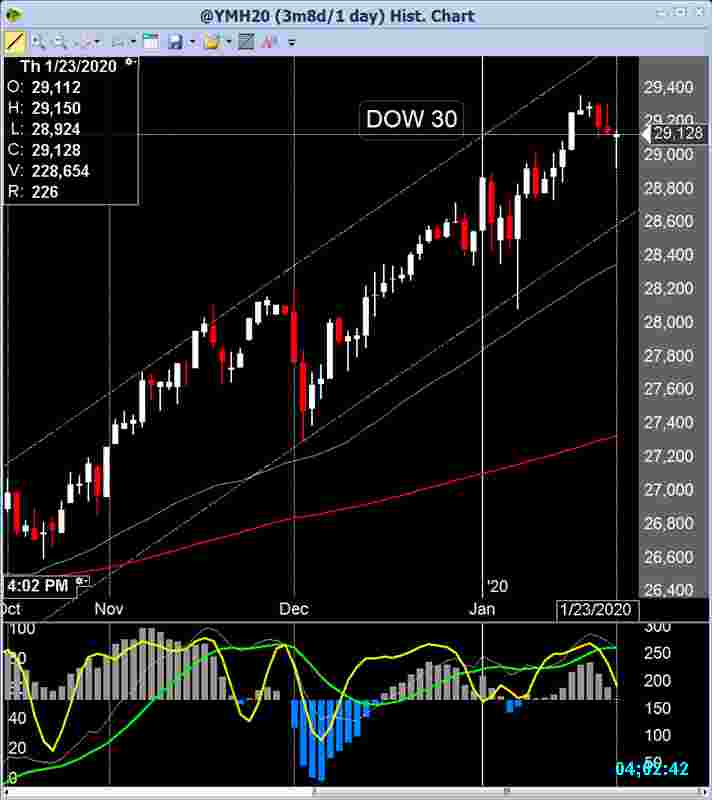
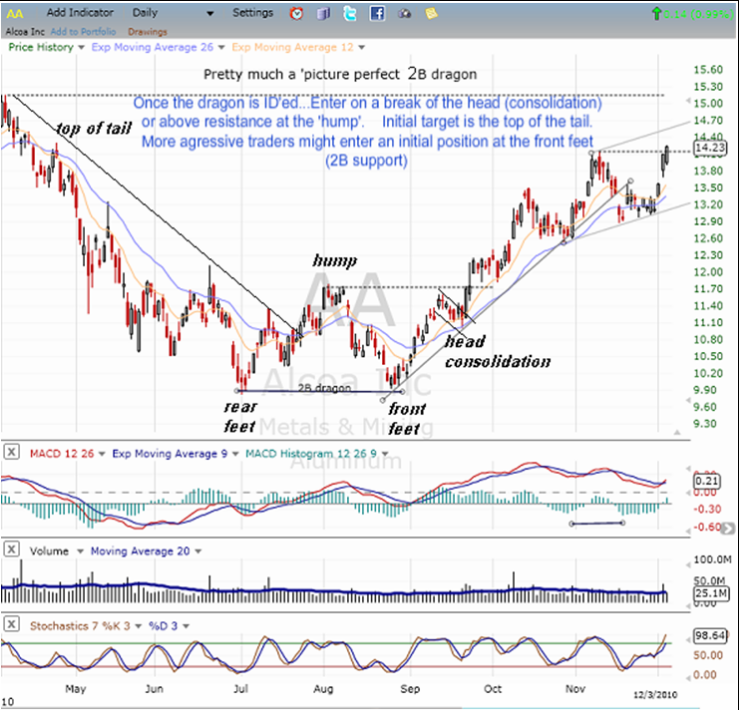
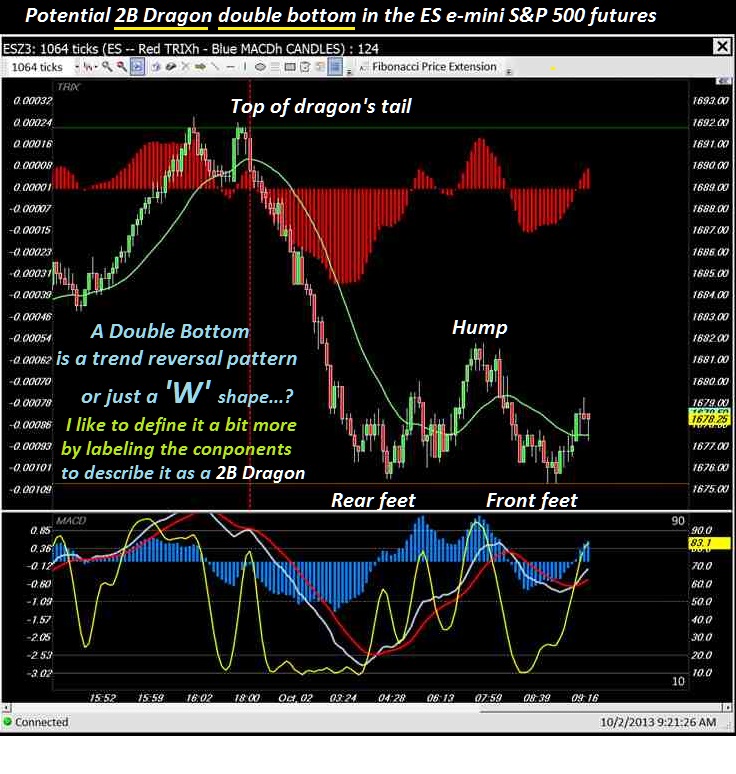
2B Dragon double bottoms are good trading patterns on any time frame. They are frequent and reliable Price Action Reversal patterns.
They may or may not always show the same patterns on different time frames but do repeat with amazing regularity...
The 2B Dragon is one of a myriad of double bottom patterns. It is distinguished from the others by the exact two lows on each leg...which happens very often with the DOW 30 e-mini futures...
Nice example of a 2B Dragon double bottom (charts)
https://investorshub.advfn.com/uimage/uploads/2020/1/21/atujb11.jpg
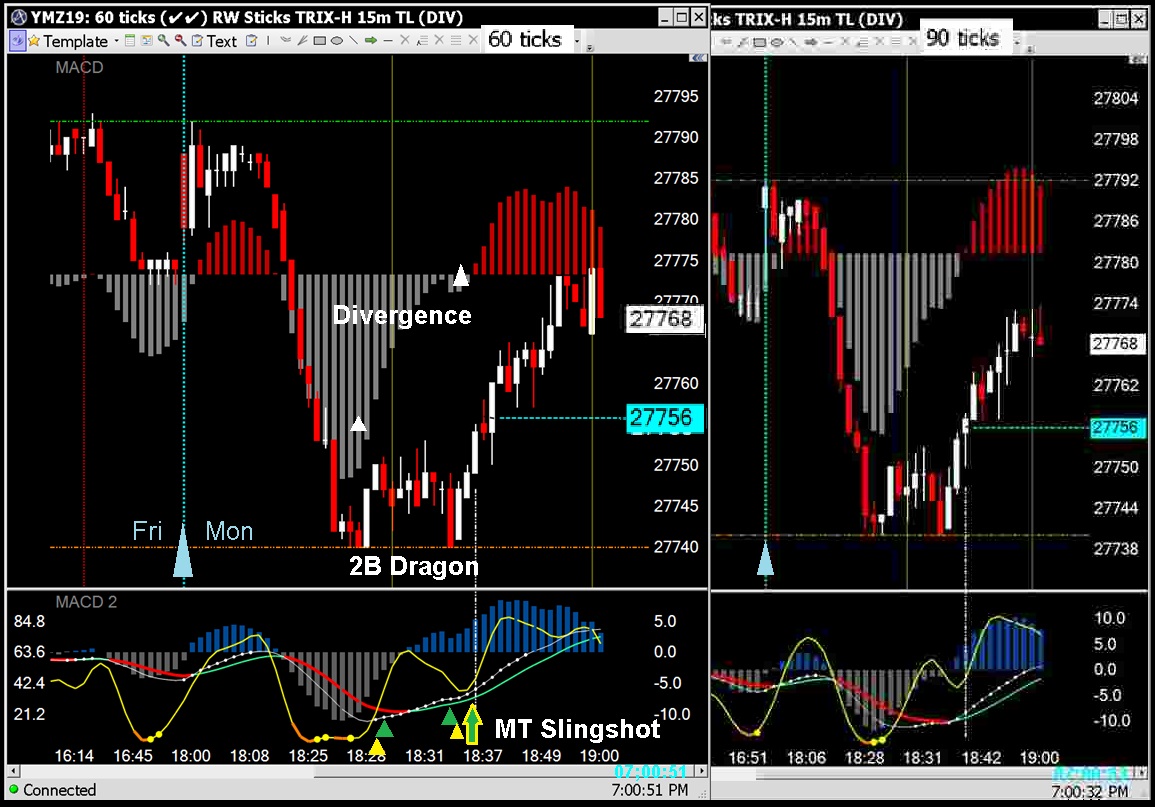
The 2B Dragon price action pattern
The MT SLINGSHOT indicator pattern
Price to indicator divergence
The links above go to pages on my free blog that explain the stuff on the charts below.

The 2B Dragon is a bottoming price-action pattern (a double bottom). They usually reverse a DOWN TREND...but they will often develop in strong up trends too. This one also displayed divergent indicators at the two lows and an MT SLINGSHOT pattern .
$NIO China is exploring ambitious new plans for the future of its car industry, weighing a target for 60% of all automobiles sold in the country to run on electric motors by 2035 https://www.bloomberg.com/news/articles/2019-09-06/china-mulls-target-for-60-of-auto-sales-to-be-electric-by-2035 $NIO
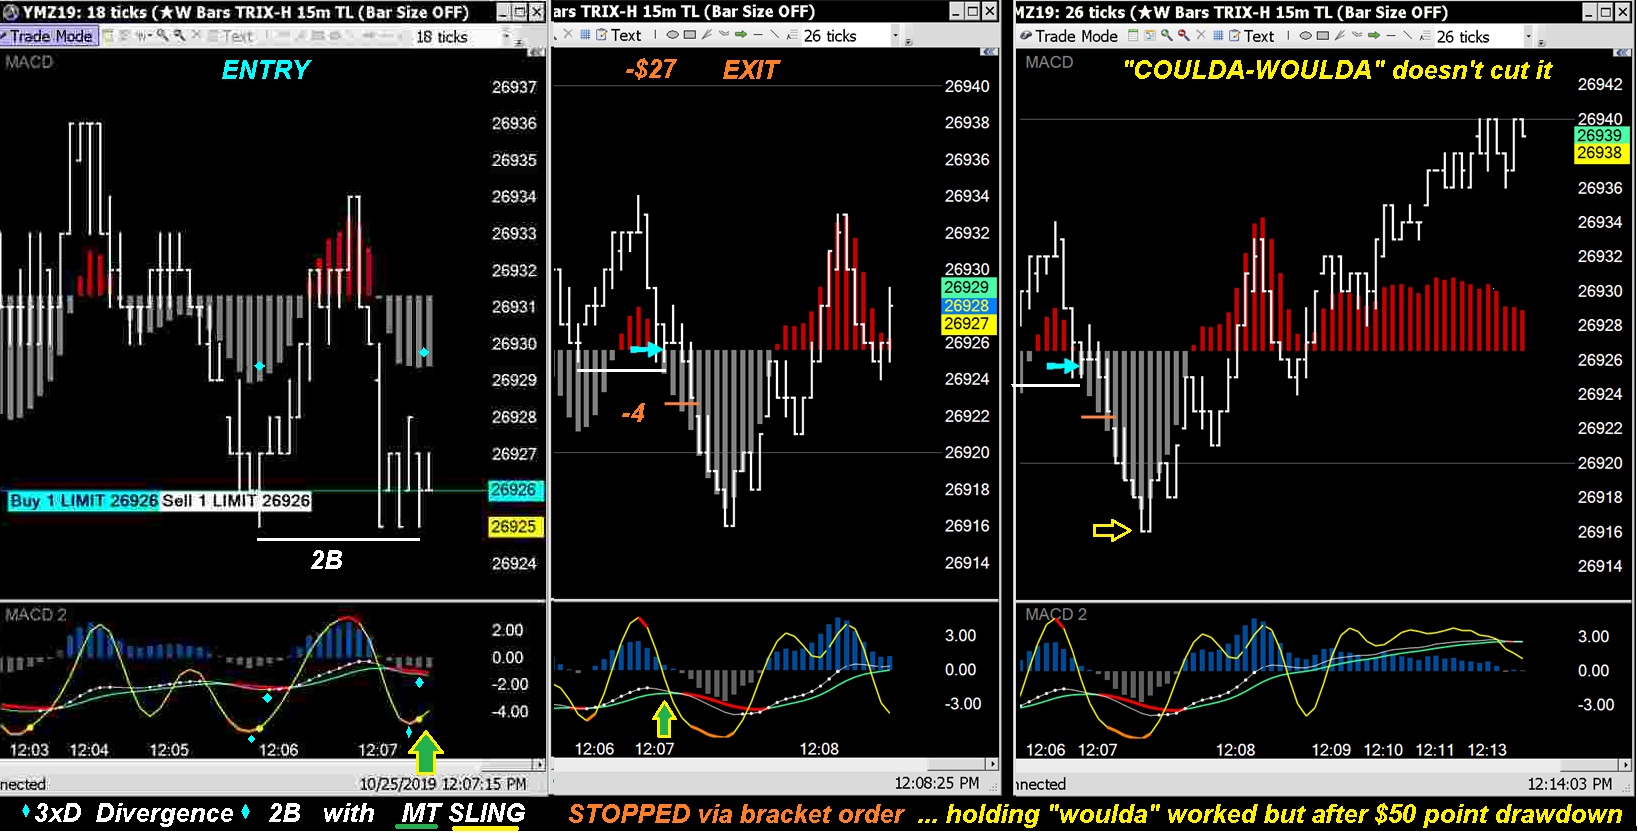
Same 2B taking 2 trades: 1st STOPped ...2nd-a-GAINer
$CVSI | BDS Analytics estimates that U.S. sales of cannabis and hemp-derived CBD product is expected to surge from $1.9 billion in 2018 to $20 billion by 2024, a compound annual growth rate of 49%. According to their research, there is substantial consumer interest in the consumables (tinctures, pills, beverages, food) and Topicals (creams, balms, salves) formats, despite the current low consumer penetration rate. In addition, many major national retailers (CVS, Walgreens, Rite Aid, Sprouts, Whole Foods, Ulta, GNC Holdings, Designer Brands, Urban Outfitters, and Neiman Marcus) have been early adopters of CBD topical products and have introduced various product lines in select markets.
$CVSI CV Sciences Initiated at Overweight by Cantor Fitzgerald. Cantor Fitzgerald analyst Pablo Zuanic initiated coverage of CV Sciences with an Overweight rating and $4.20 price target
$BNGO MD., Ph.D., from Massachusetts General Hospital for Children at Harvard University presented results of a study on 19 samples from patients with Congenital Diaphragmatic Hernia (CDH), a common and severe structural birth defect that leads to malformation for the developing lungs. Using data from the Saphyr system, Dr. High’s team confirmed all high-confidence structural variants that were detected by cytogenetic methods, provided additional higher-resolution detail and elucidated the structure of several, and identified novel likely causative variants. Dr. High announced an upcoming larger study of 50 patient-parent trios, or 150 samples total, to identify novel structural variants that are causative for this disease.
http://www.globenewswire.com/news-release/2019/10/24/1934941/0/en/Takeaways-from-ASHG-2019-in-Houston-Users-of-Bionano-s-Saphyr-System-Presented-Validation-Results-for-FSHD-Repeat-Expansion-Disorders-and-Digital-Cytogenetics-Among-a-Growing-List-.html
Another day, another 3xD example good for $75
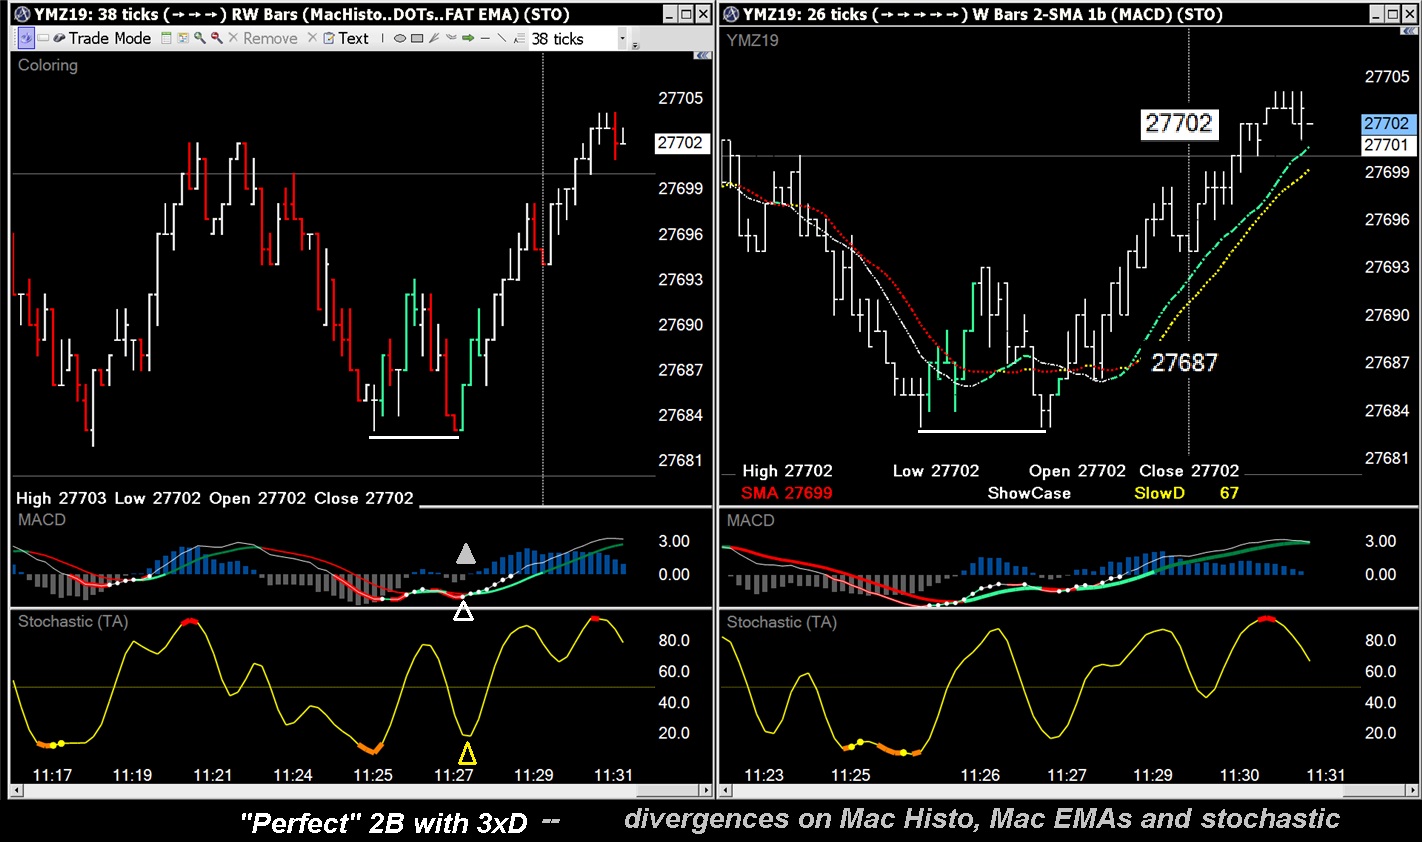
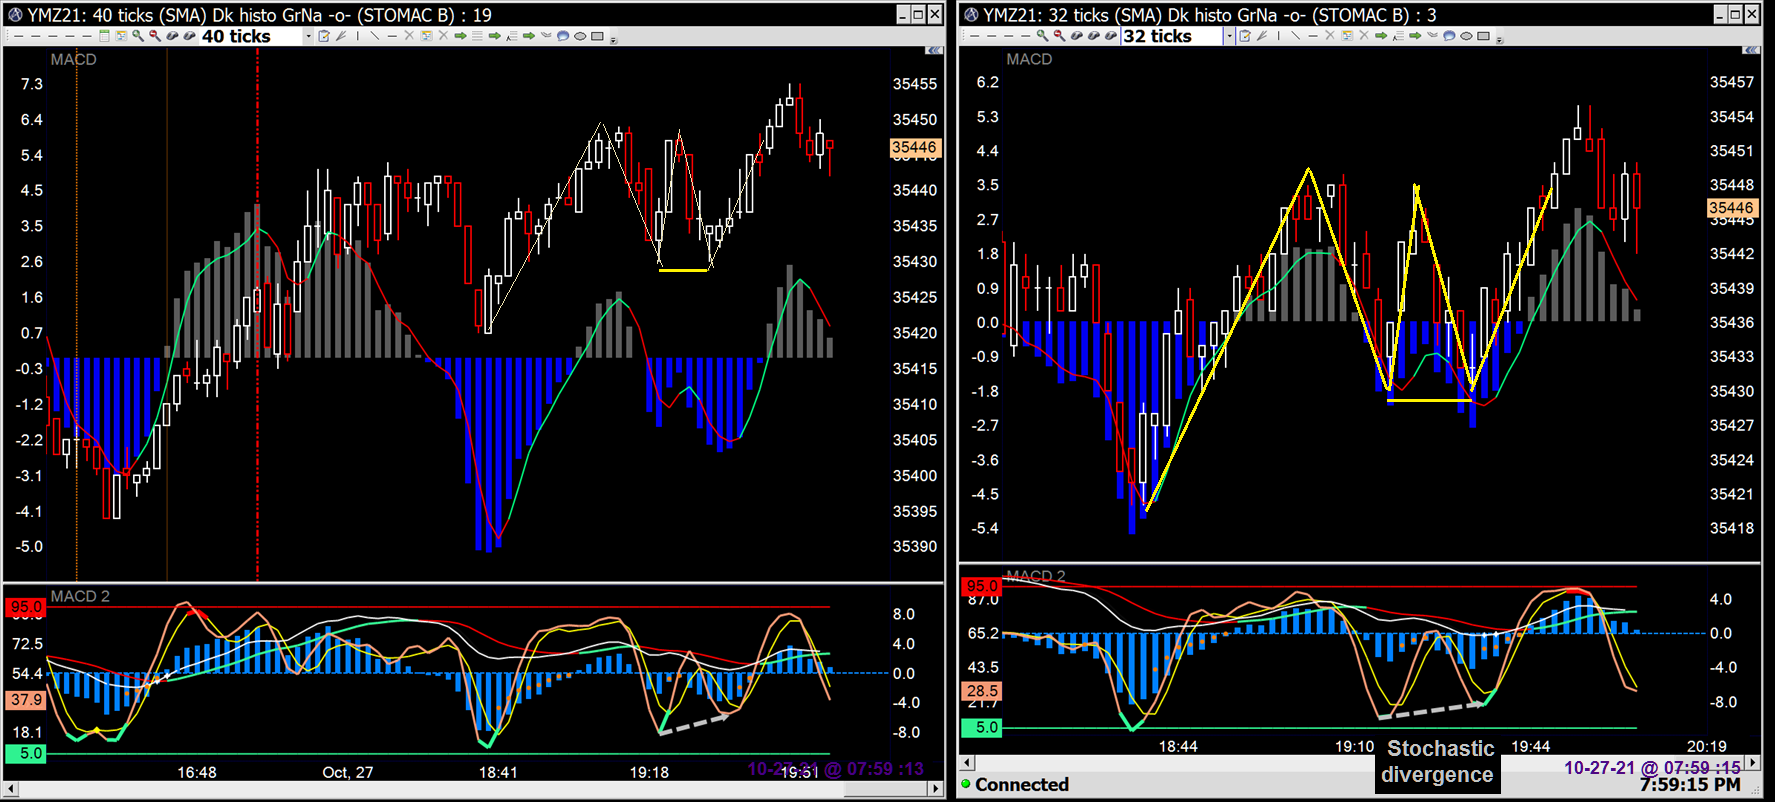
Excellent 3xD example good for $50 at least
Divergences on the Histograms, the Mac EMAs and Stochastic SlowD line
2B Dragon double bottom price action pattern
and an MT SLING combo pattern in the study indicator as the signal for entry.
============ ALYI =================
Taking bits and pieces at a time works
Trade below was good for 18 points ( $90 per contract )
... and $200 a few minutes later ...
Another day, another $100 divergent 2B
2B patterns don't ever guarantee a winning trade ...
it's prudent to use stops to limit downside loss...It is also possible
to out guess the market as to how much loss you can take (holding during pull backs)
-- but --
if you're using P/A patterns & indicator patterns as your entry signals for day-trading
then you "must know your limitations" ahead of time...
The market can move faster than you can react to it.
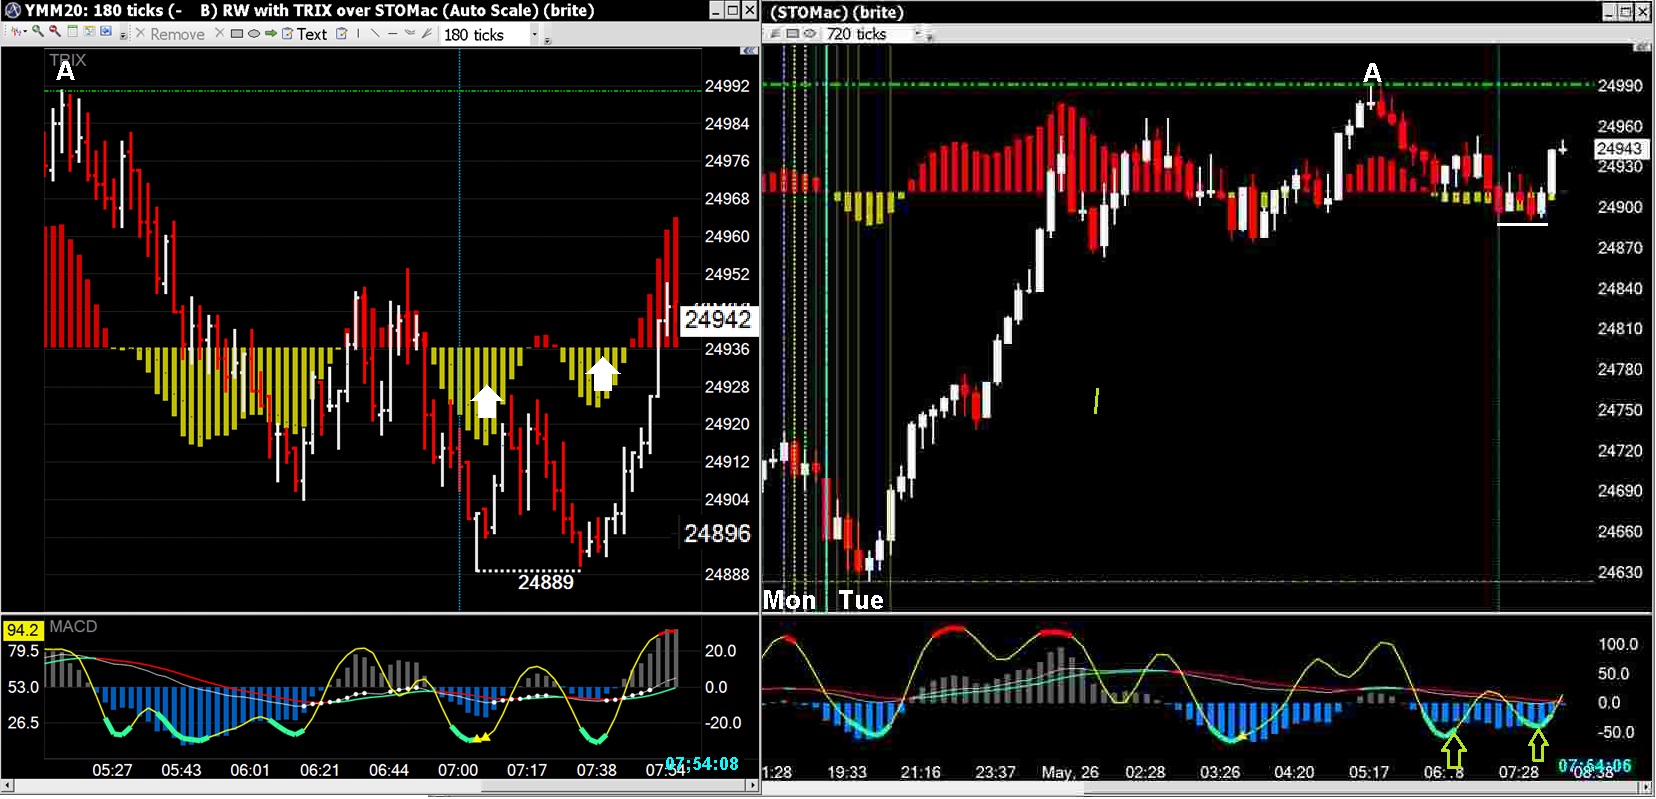
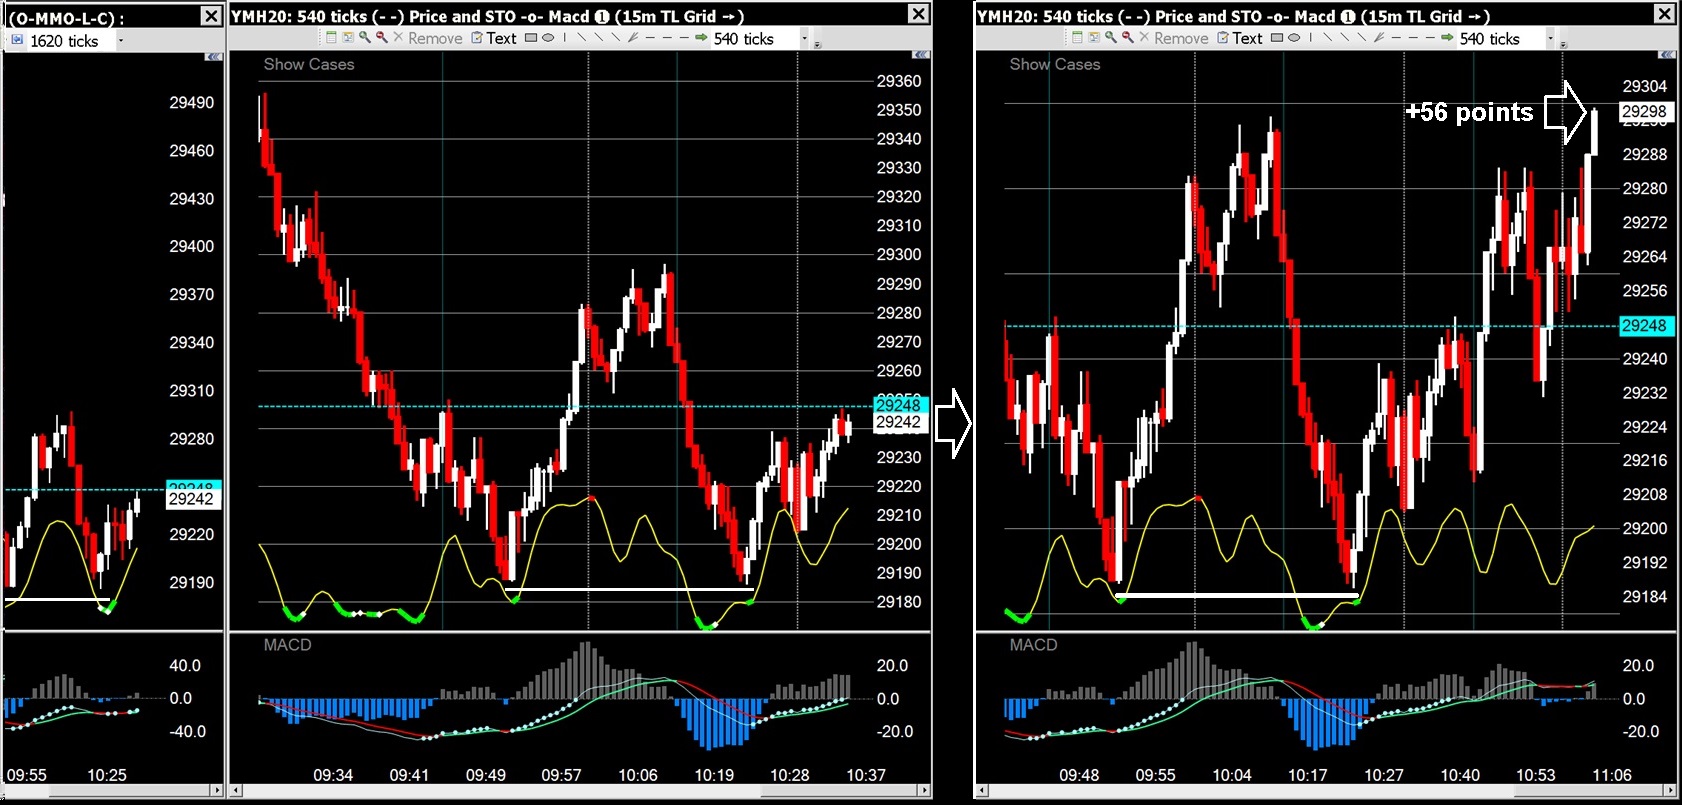
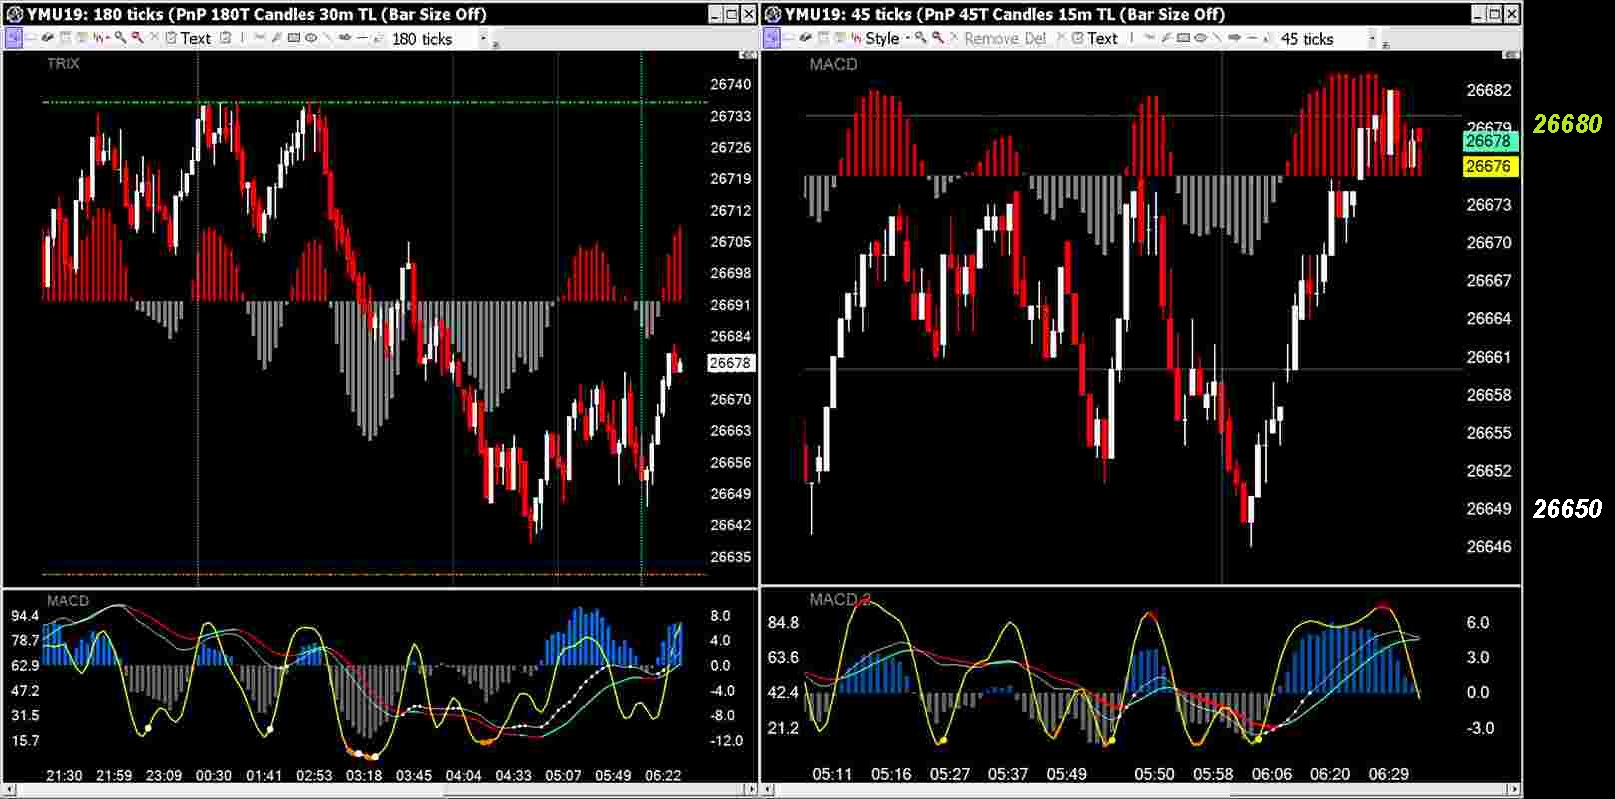
Wednesday evening ... 200+ point reversal ($1000)
Tuesday night thru Wednesday morning comparisons side-by-side
VERY NICE GUESS
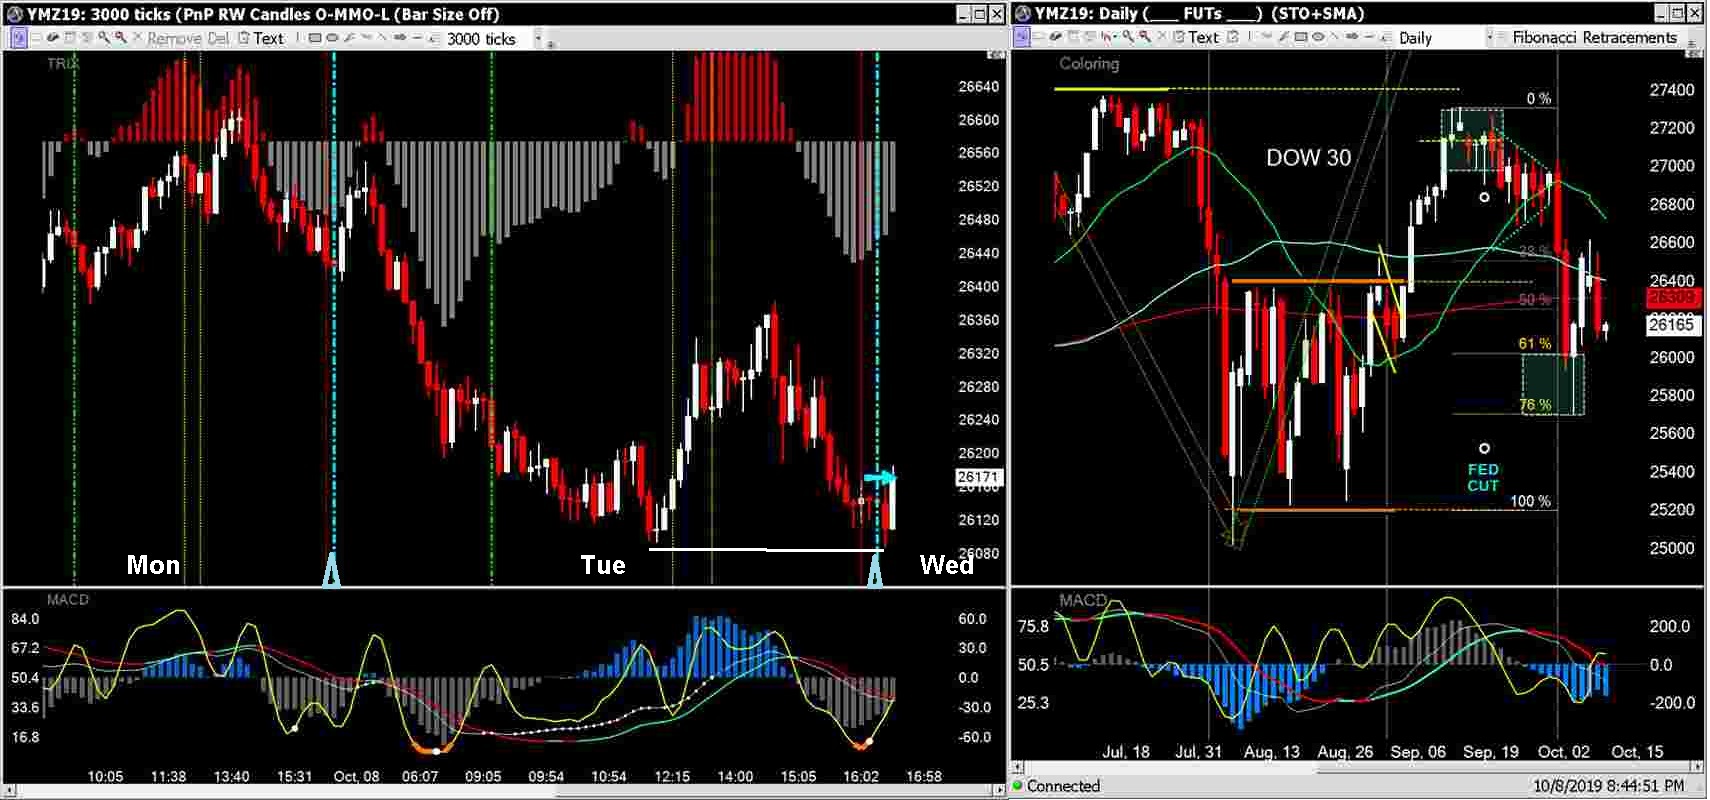
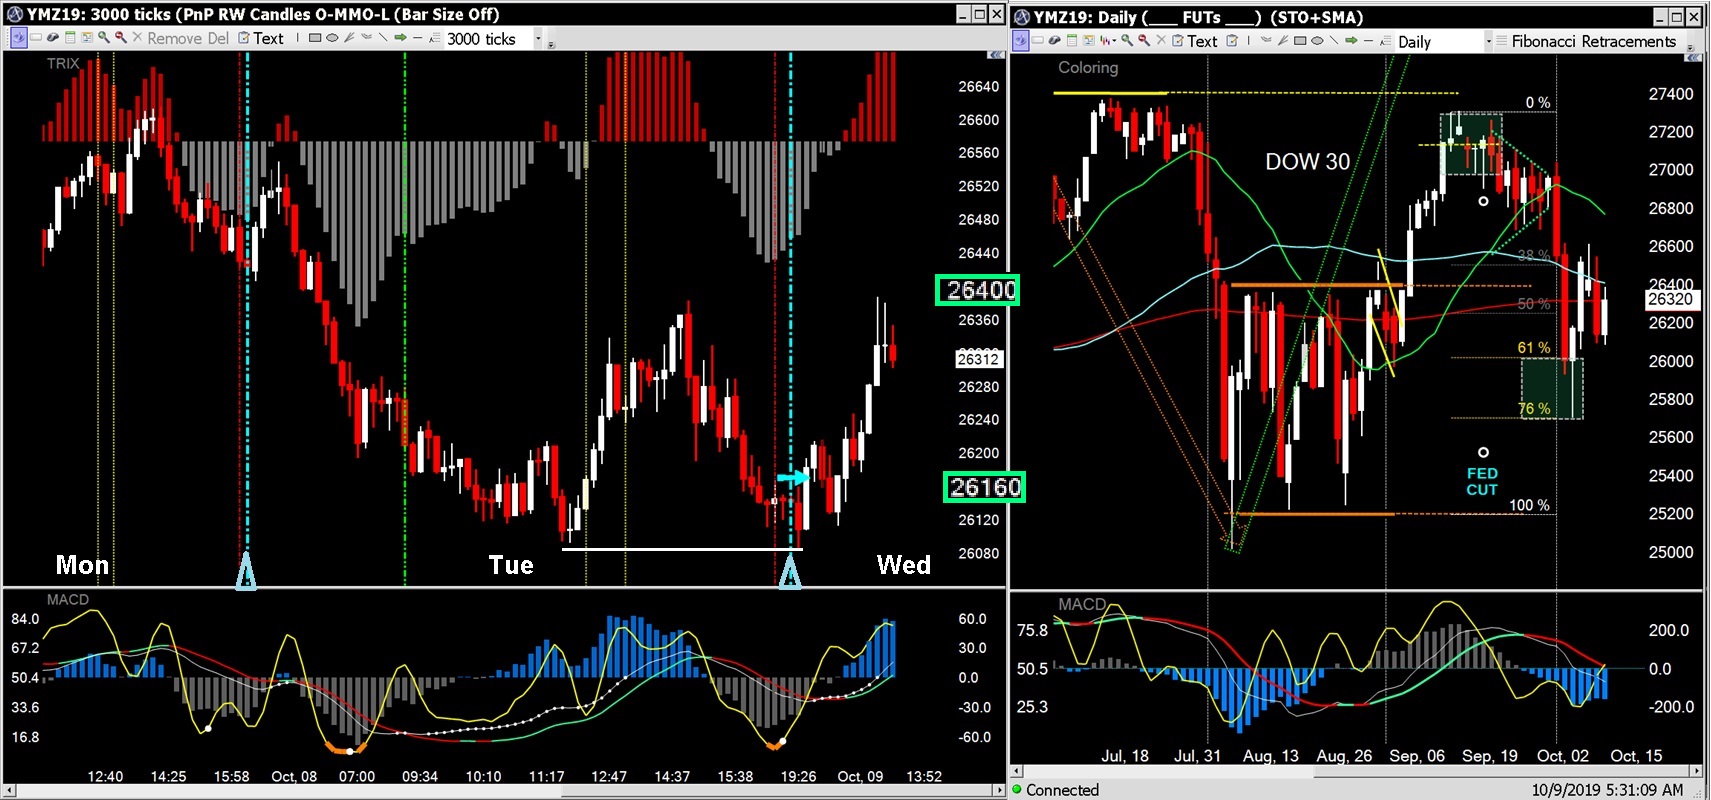
Wednesday morning overnight session
140 point range or $700 per contract was available
with only a $100 maximum draw down
Wednesday morning daily
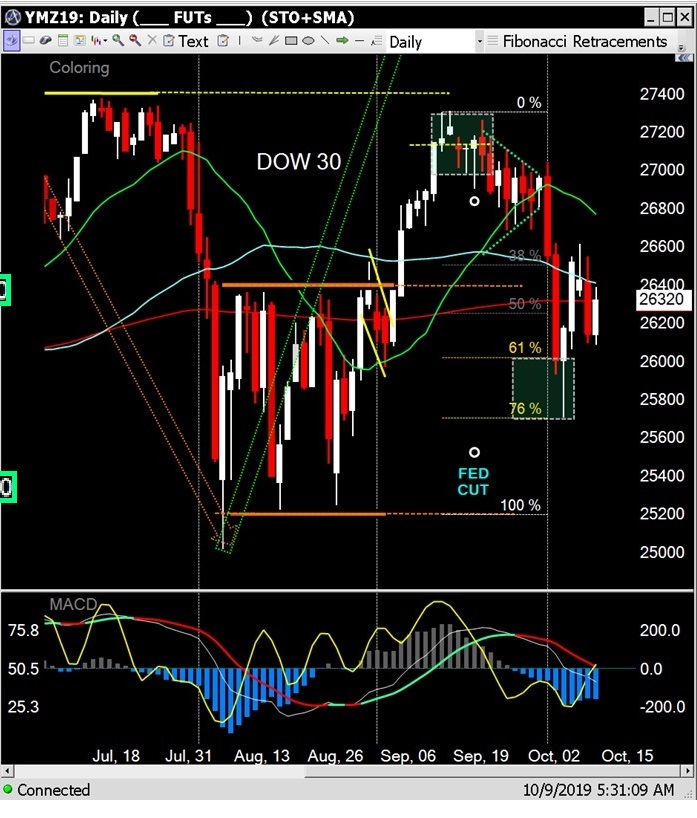
Tuesday evening, early into Wednesday's session
A 2B Dragon is printing between the sessions...
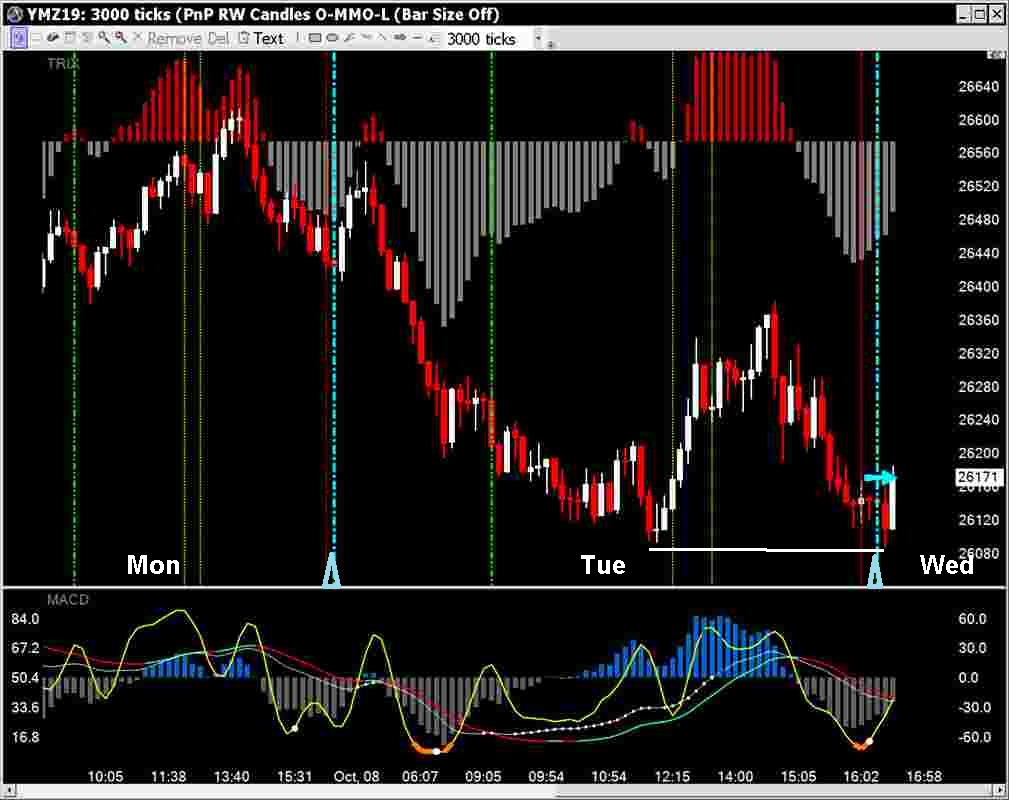
with it showing as an Harami on the daily so far
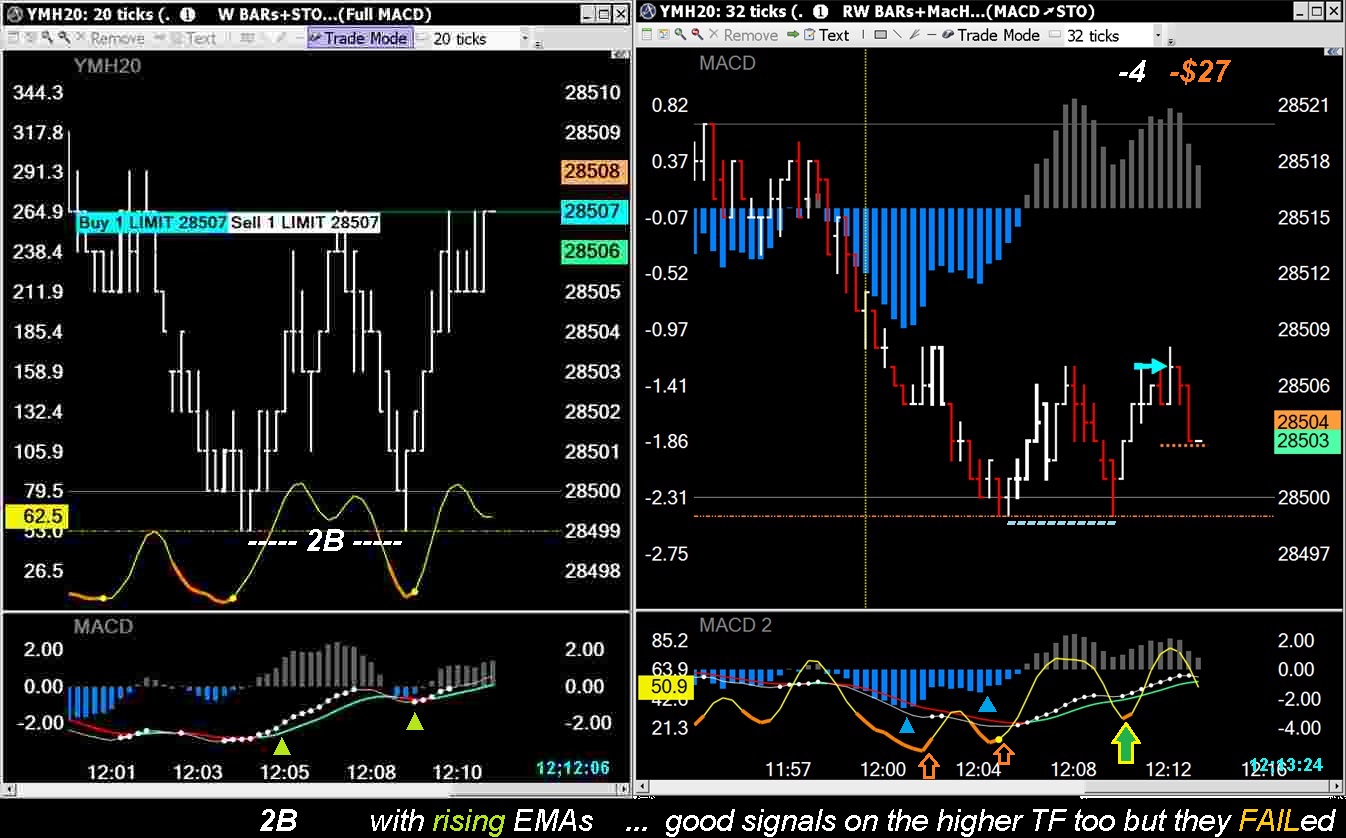
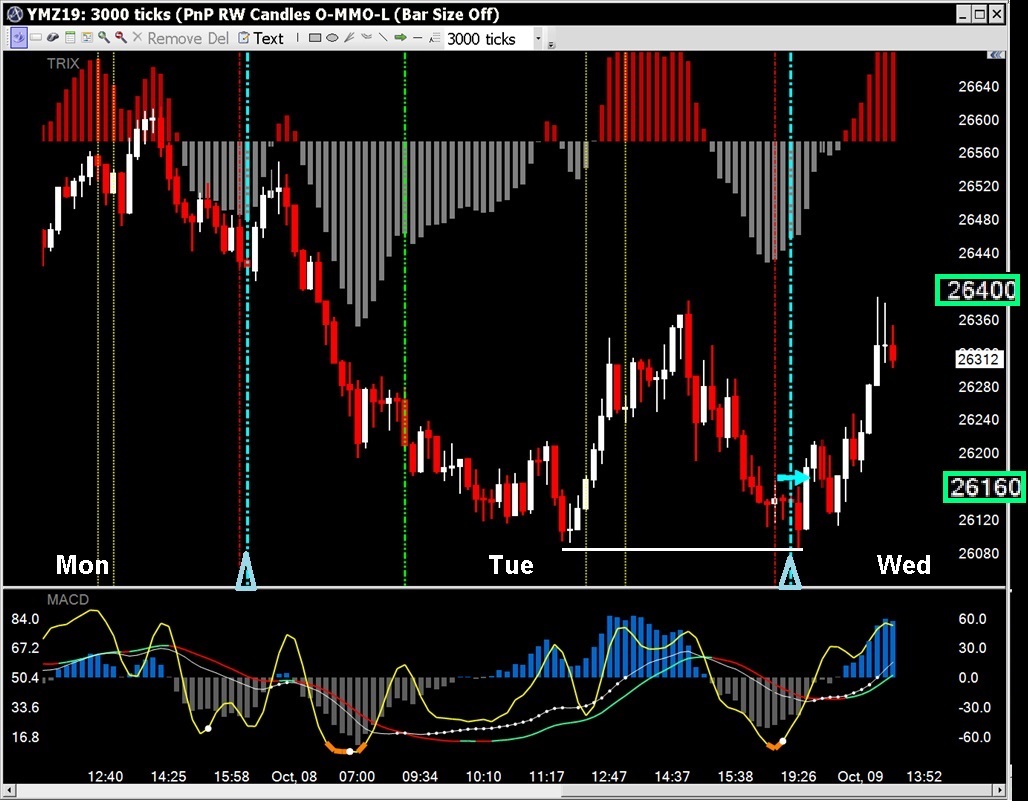
2B on the Trade mode time frames
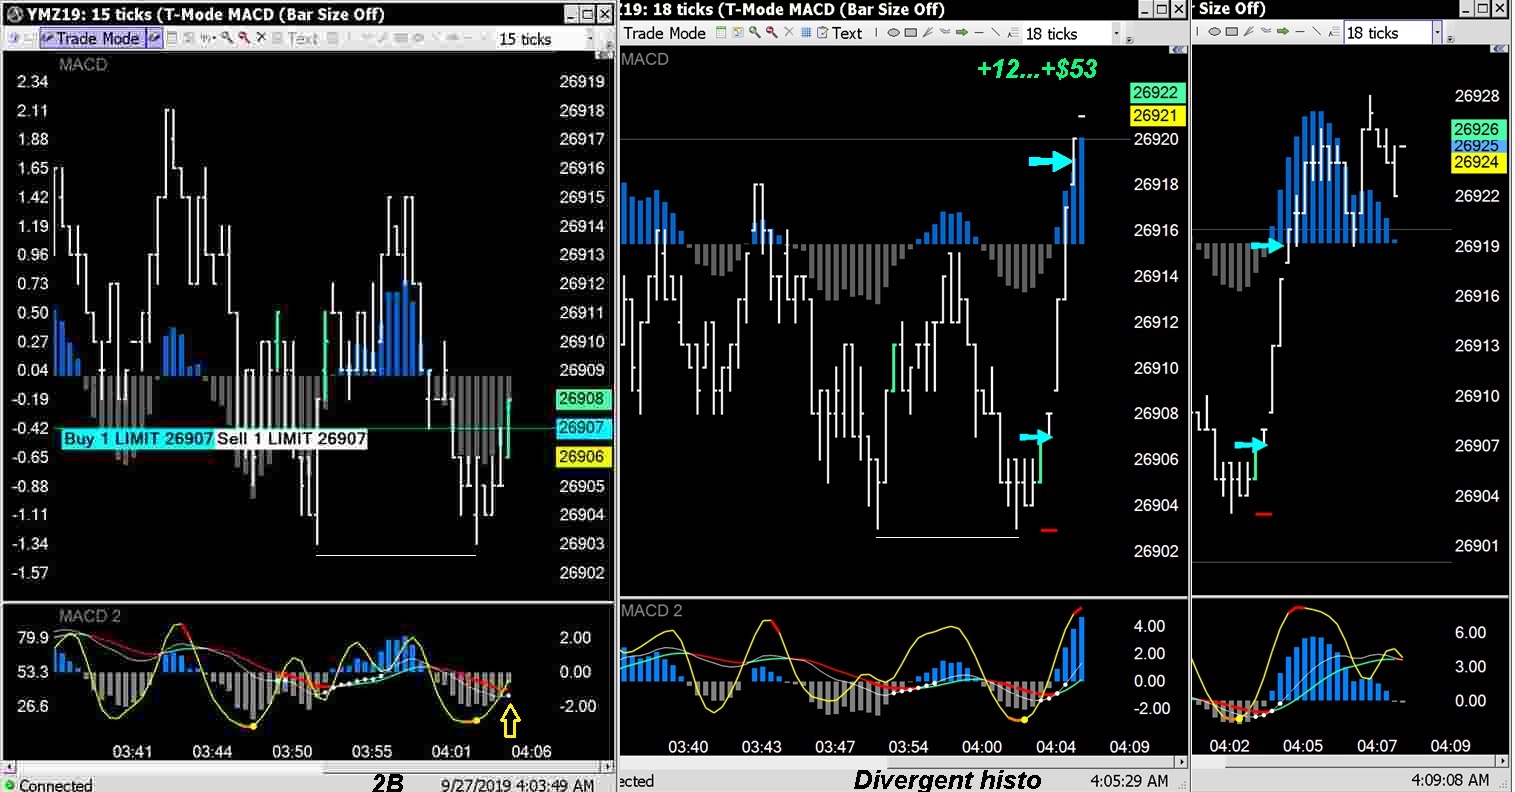
Using a bracket order -
Buy Limit with 4 tick protective Stop and 12 point target.
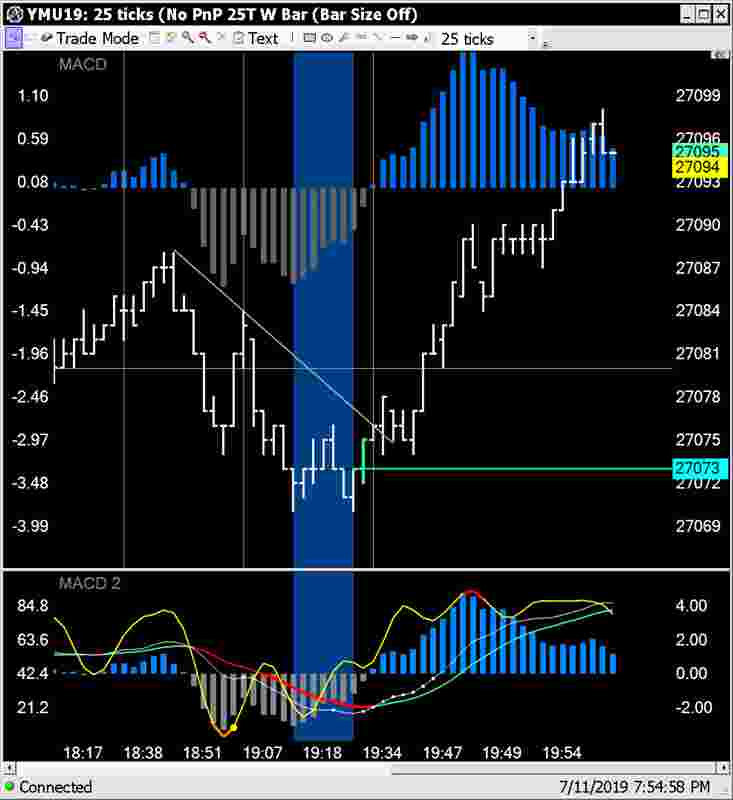
2B reversal on the lower time frames (+3xD)
Divergence often accompanies reversals
This one was good for over $300 on a 1 contract trade
with next to $0 draw down after the entry...
Blue line 2B - they don't all run-up as nicely but be aware that they can.
Realistically an entry could have been had at 27073 when the fast MACD 1st turned up (the green bar).
This one was good for $100 with -0- draw down after the fill.
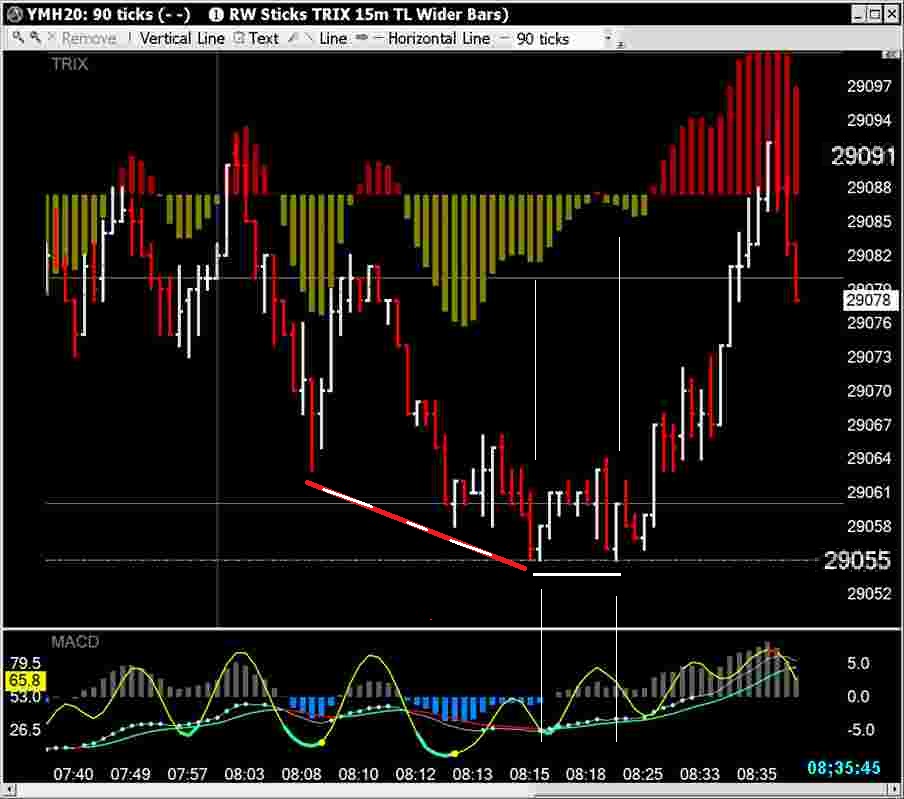
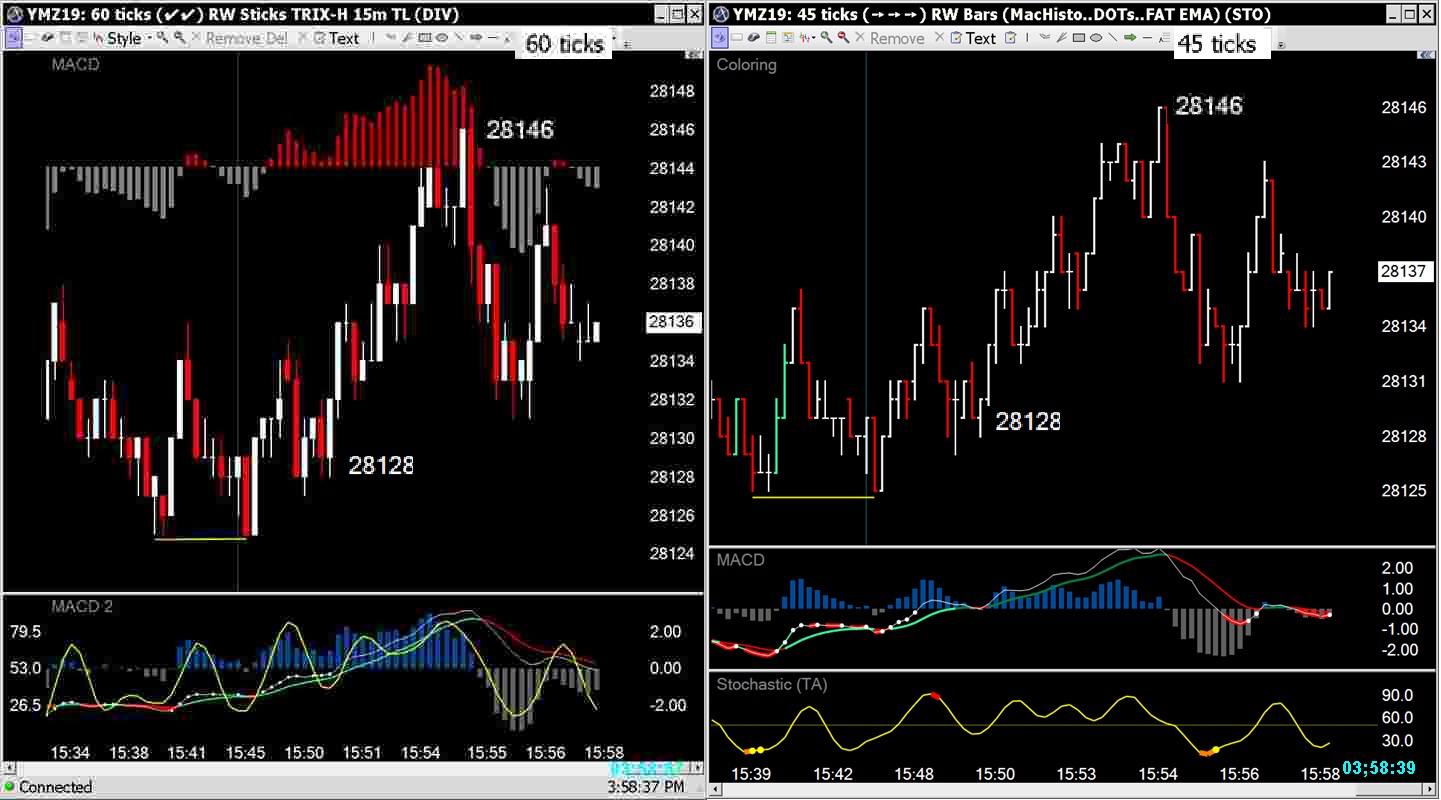
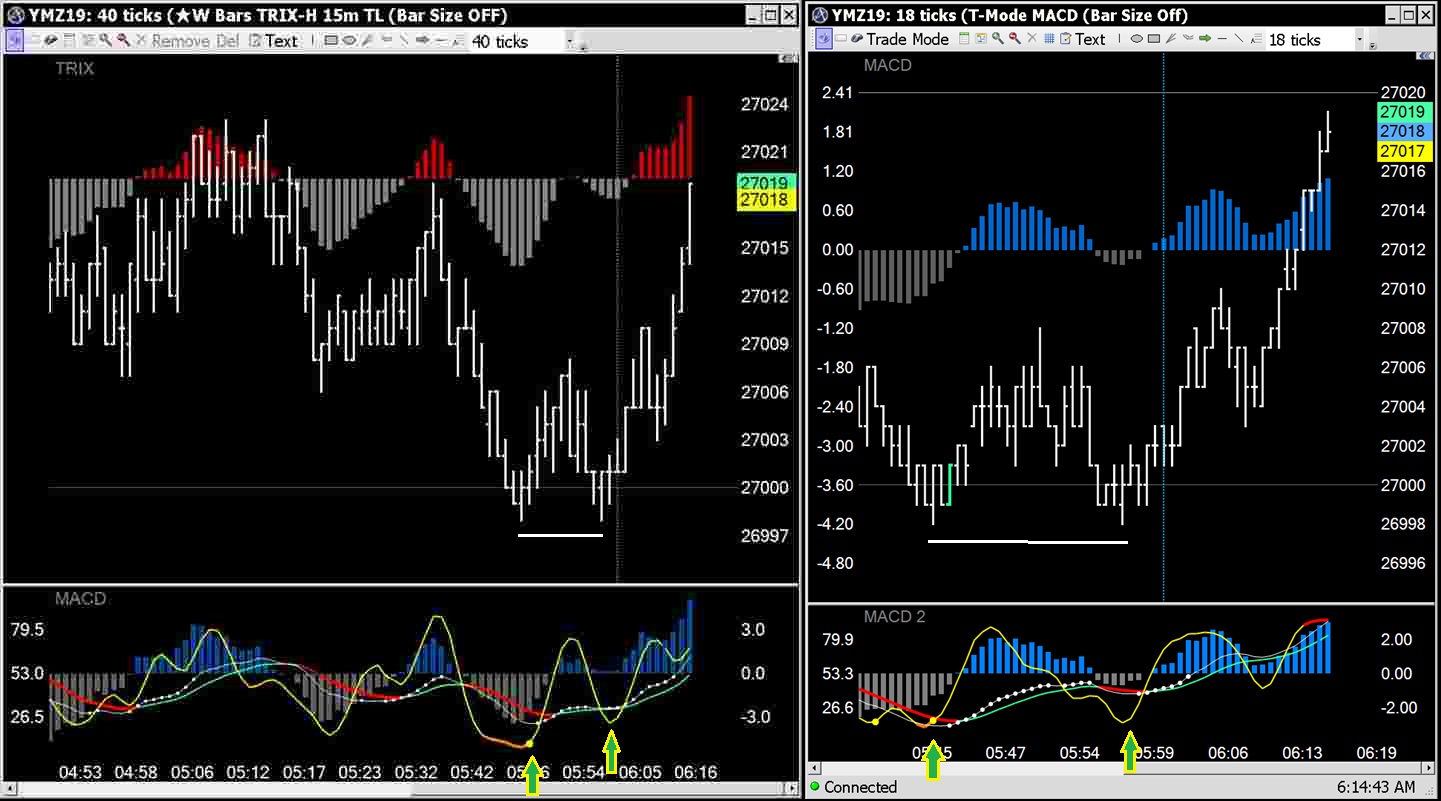
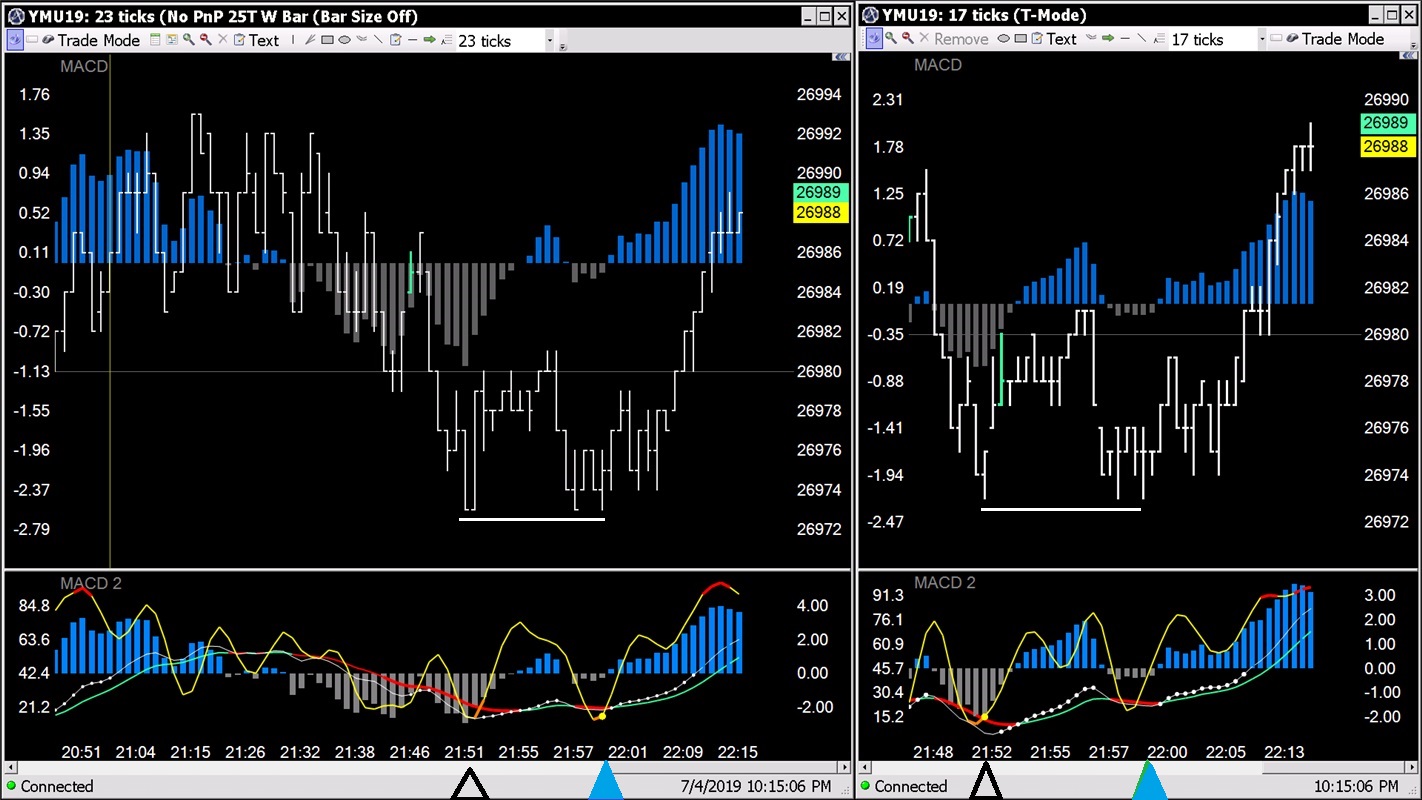
Other hints besides the price action pattern:
Can you see the histo divergence (its slope) between the the two price lows?
The stochastic was divergent at the 2B's left leg and again at its right.
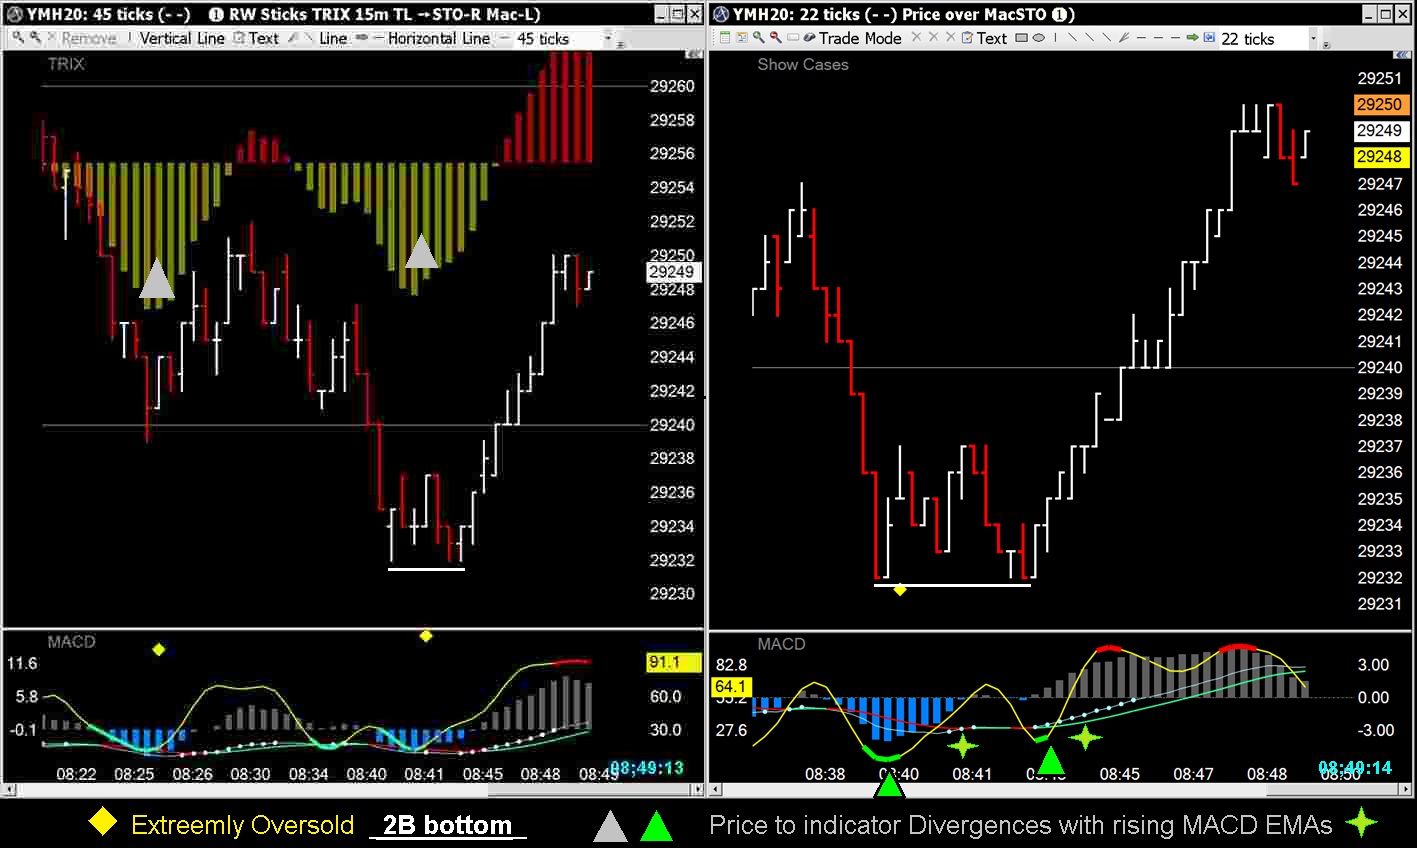
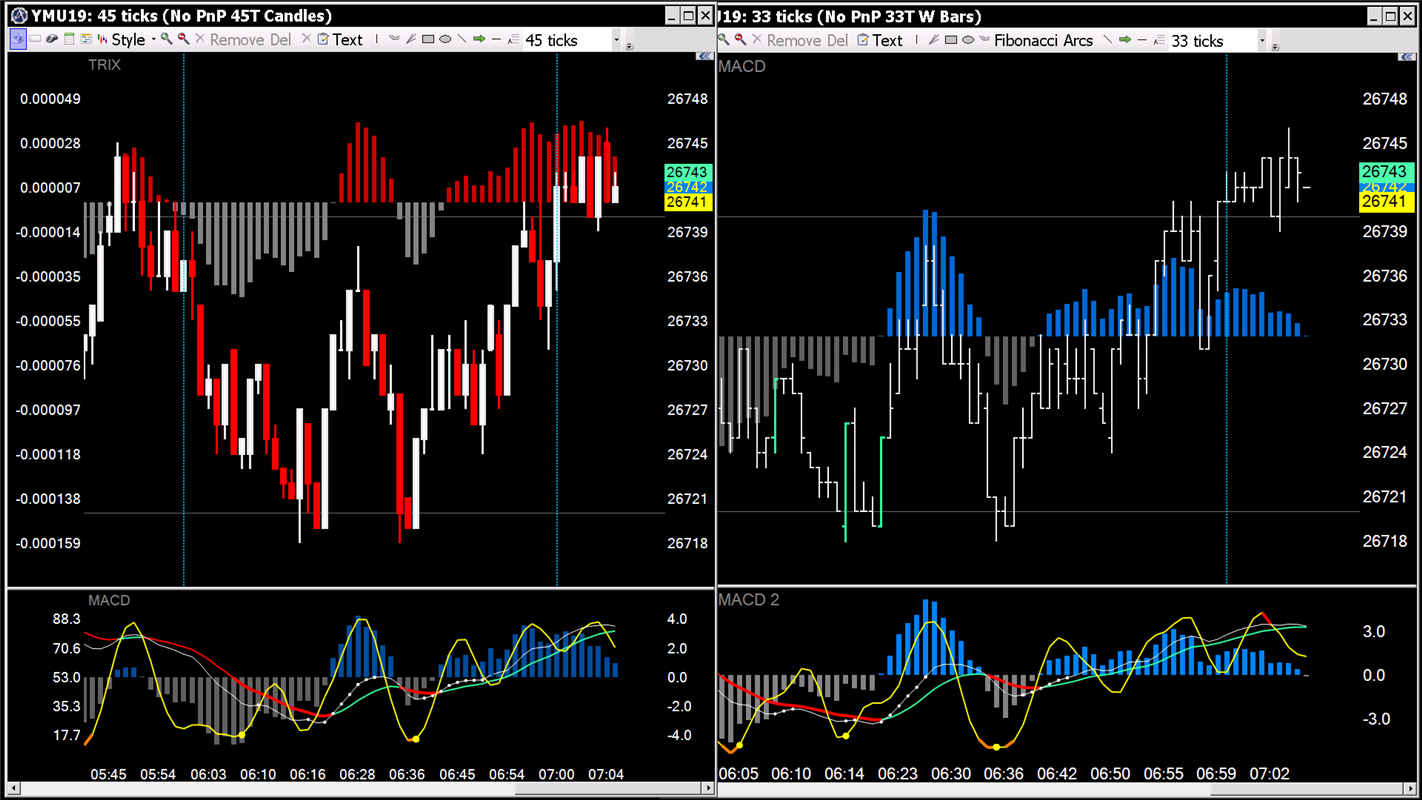
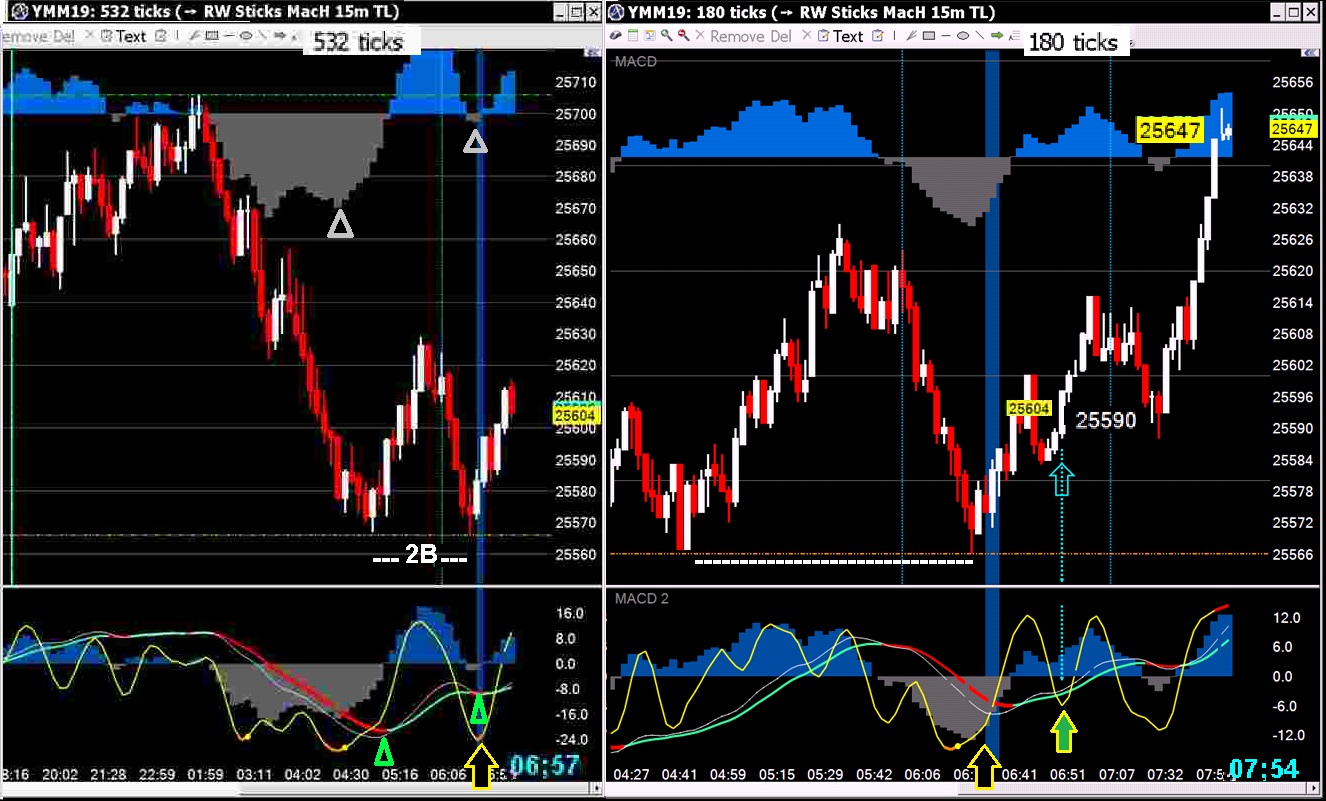
2B Dragoms are fairly reliable price action reversals.
Their reliability goes up when there's confirmation from indicators.
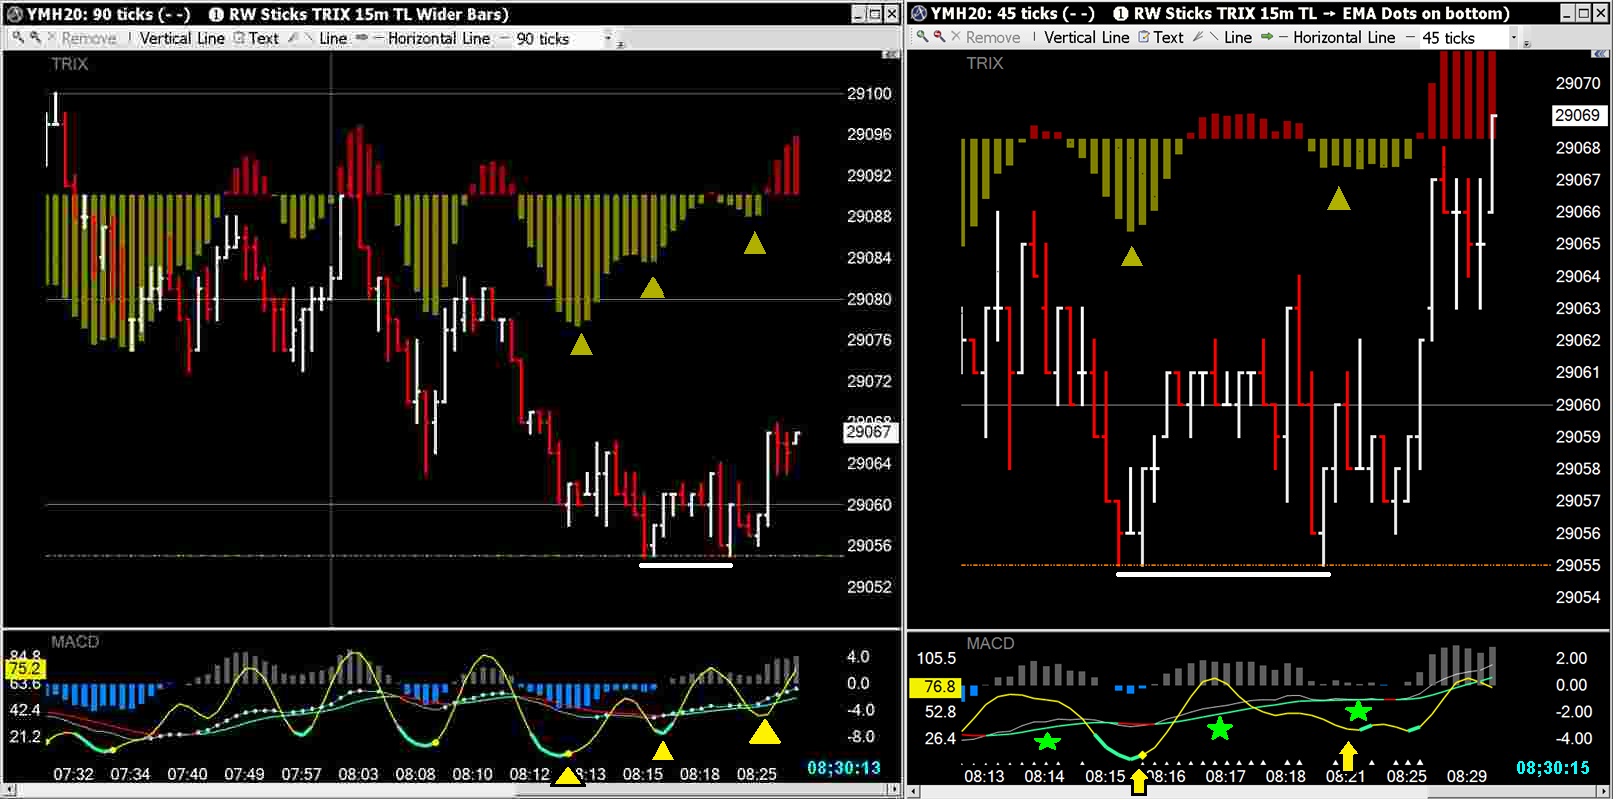
These two short term charts are good examples of indicator conformation.
Compare the lows ---
The 23 tick on the left:
MACD EMAs and histogram lows are divergent to price lows
Stochastic is oversold and hooking up
The 17 tick on right:
MACD EMAs and histogram lows are divergent to price lows
Stochastic is oversold and hooking up
Stochastic lows are also divergent to price lows
V-bottoms are difficult to ID ahead of reversals
30 ticks = $150 per contract
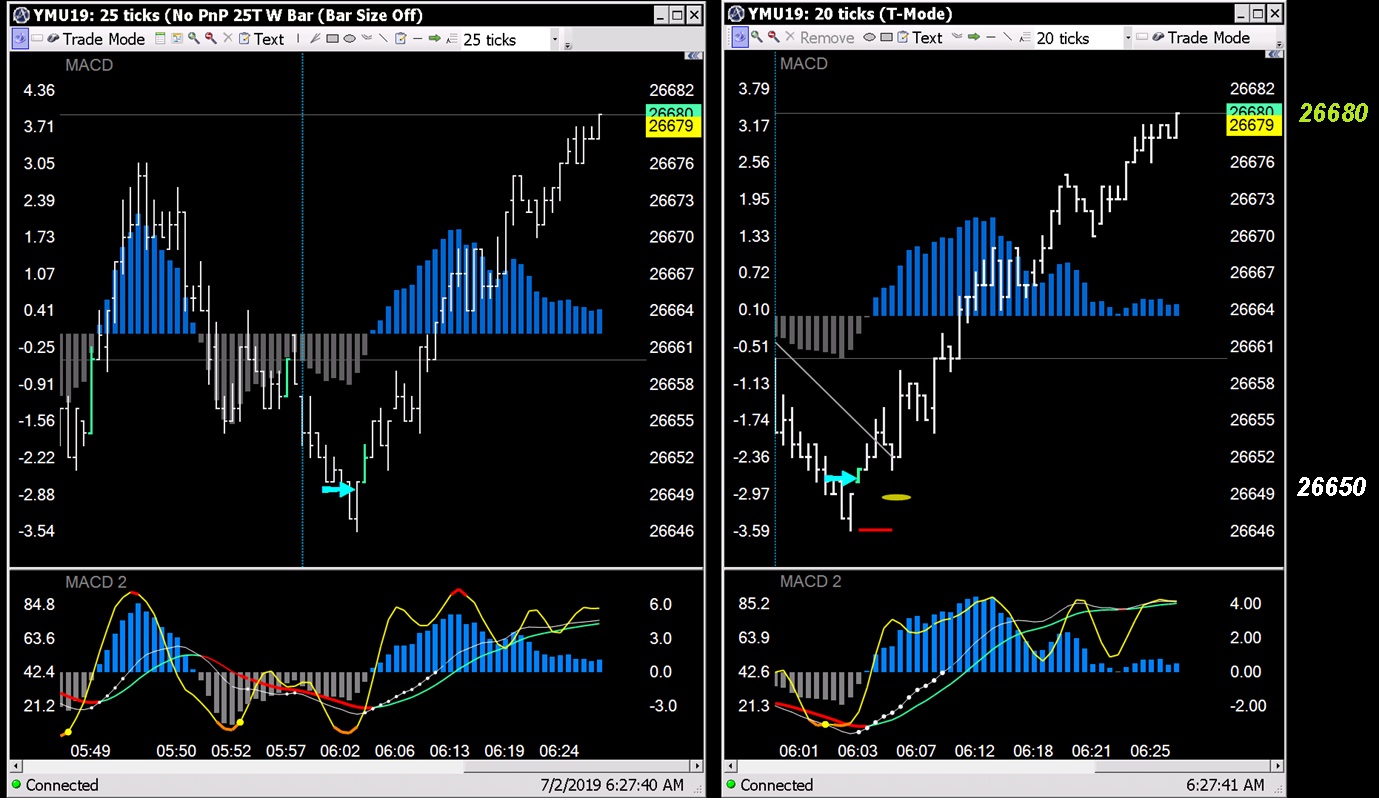
2B pattern - They can happen anywhere, anytime
2 Time Frame look ...
Another day, another divergent 2B reversal
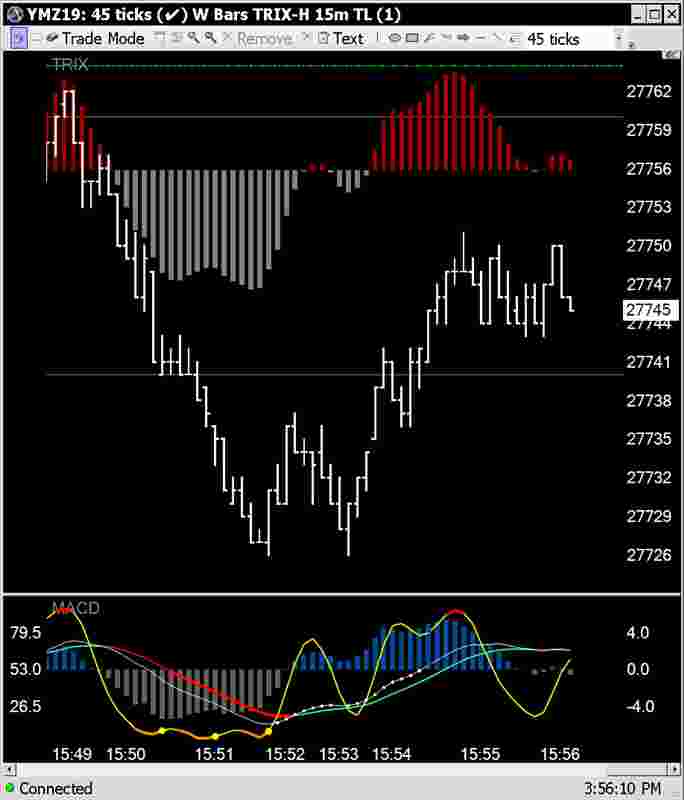
2B Double Bottom with Divergent Indicators
All double bottoms are reversal patterns...the 2B has exact levels for both legs
Checking for divergence when you first spot the 2B price action pattern may
allow you to enter very close to the bottom...
Or you can wait for a confirming indicator pattern and still get a very good entry.
In this example the DIV 2B was confirmed by the stochastic slingshot.
You'll get a higher fill price waiting for confirmation

|
Followers
|
9
|
Posters
|
|
|
Posts (Today)
|
0
|
Posts (Total)
|
353
|
|
Created
|
01/31/12
|
Type
|
Free
|
| Moderator sharpshorts | |||
| Assistants | |||
|
|

| Volume | |
| Day Range: | |
| Bid Price | |
| Ask Price | |
| Last Trade Time: |