 News
News  Market Data
  Discover
Support: 888-992-3836
Copyright © 2023 InvestorsHub Inc.


is...Either trading futures or fishing
swing_trader
![]()
is...Either trading futures or fishing
Register for free to join our community of investors and share your ideas. You will also get access to streaming quotes, interactive charts, trades, portfolio, live options flow and more tools.
Register for free to join our community of investors and share your ideas. You will also get access to streaming quotes, interactive charts, trades, portfolio, live options flow and more tools.
is...Either trading futures or fishing
I'm in at 28.87 and still holding.. Its has a long way to go
Don't know and don't care. After over 22 years in the markets I learned one thing. I could care less about anything but what I see and only what I see. And what I see is a huge green volume bar out of nowhere. I trade TA only.
SEAOF Found this one on my scanner today... Looks like something is going to happen... Several years with no volume then huge green volume bar out of nowhere... Heavy loading last Friday
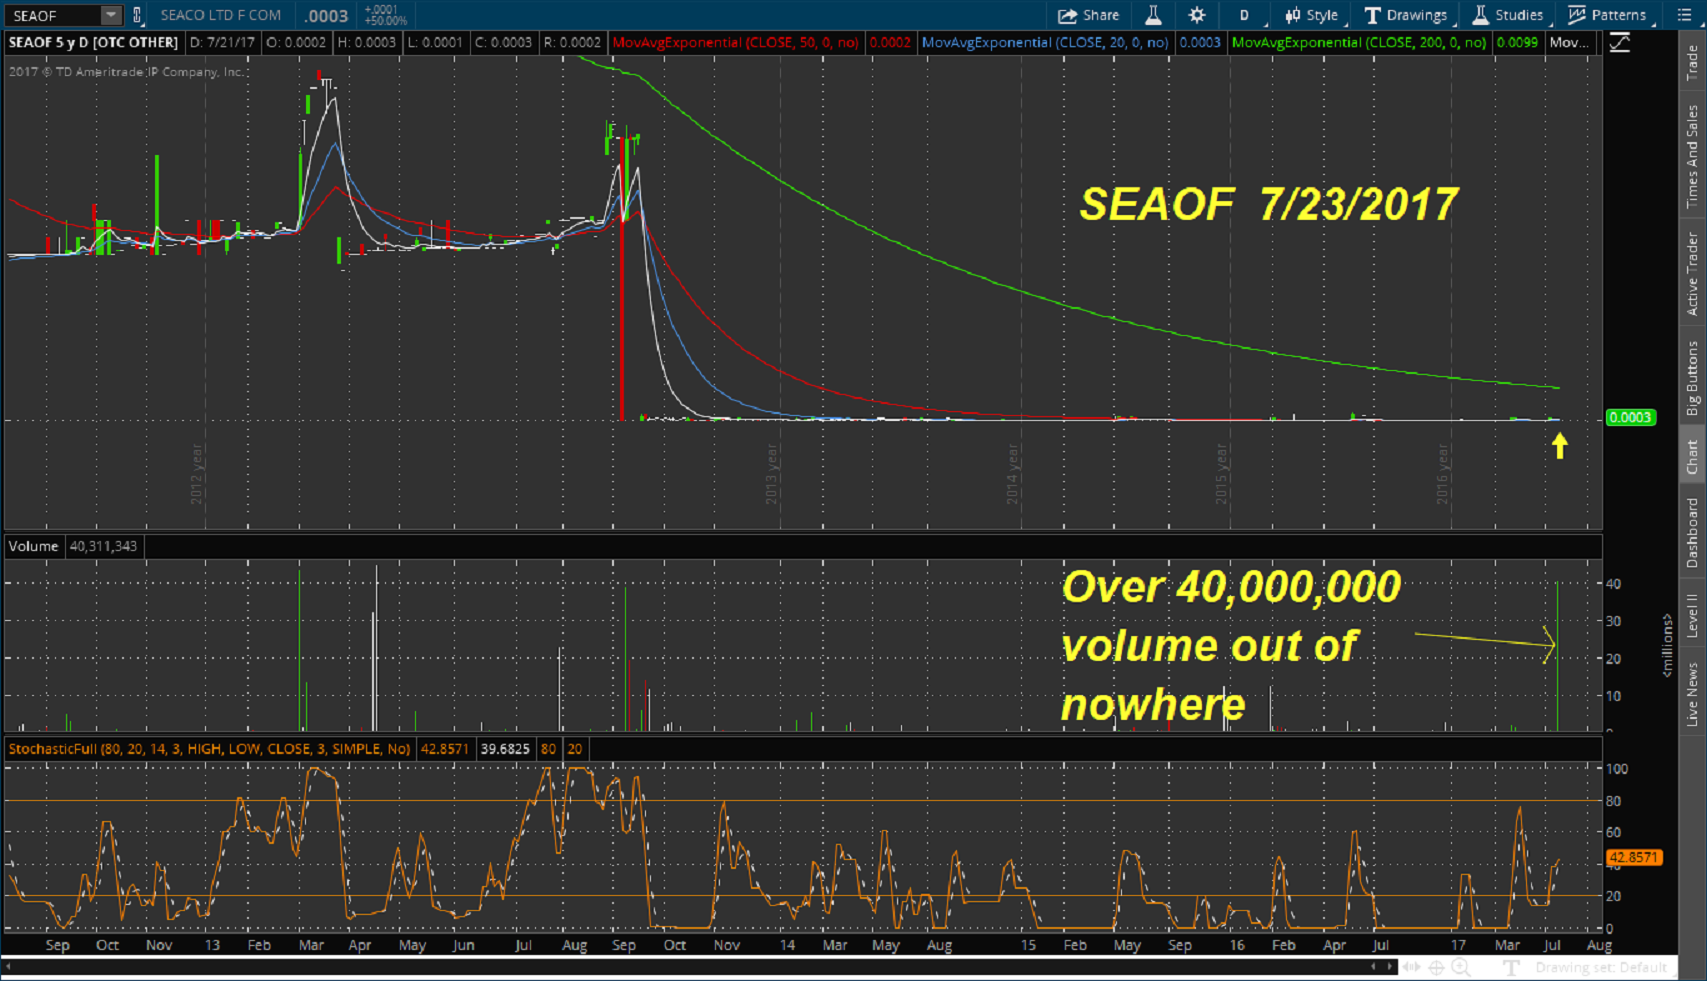
SEAOF Found this one on my scanner... Several years with no volume... Over 40,000,000 volume out of nowhere... Looks to explode
Hey guys... This is my first and probably only post on this board... I don't play pennies much anymore but when I find a chart like this one I do... Several years with pretty much no volume... Out of nowhere over 40,000,000 in volume... Something is about to happen here... Look at the chart
Chart. Guys you cant find a better setup than this.
Hey guys.. Another chart for you.. I'm using the 15 minute chart this time... Had a nice consolidation period since about noon into post market... Had some nice wicks down to push off the 20 period exponential moving average... This is showing strong support... The 50 period looks to try and cross over the 200 period EMA... If it can maintain this support level we should see some very nice premarket action in the morning... There was some heavy loading when it spiked down to the 12.50 level this morning... If it can maintain the pattern its showing it should be able to move on past the previous high last week

Here is your answer to that question

Chart for those who trade TA or is trying to learn
Its been a few years since I posted on ihub... I'm not here to pump this stock or two encourage buying it... I'm just posting what I see and what I'm trading... Very seldom to I trade pennies unless I find a certain setup... This one fit my criteria and this is the third time I have traded it... A moving average crossover is just about the strongest signal you can find when added to other signals... I prefer to see a crossover on a time frame from a four hour chart to a larger time frame... Once this crossed over the 200 period EMA it allowed the other moving to catch up with it... It is showing support on the 200 period EMA... If it can maintain then we should see another strong move upward... The next resistance level should be around .60 cents... I sold at .32 and bought back in at .12

With or without a pump its primed to run soon. I was looking for .07 this time
are you in already? I put out a chart the night before this popped the last time. Sold half and waiting for it to pop again
its setting up pretty nice. Another pump will set it off again
I put out a chart on this one the night before it popped the last time. Its setting up again. I was just curious where he got the pump from
What pump rag did it come from?
WBXU chart
Just picked this one up on my scanner. This is just about the best setup I have seen for a penny in a long time. The price is in a nice consolidation. The volume is in a strong decline and the stochastics are descending to over sold. All three of these indicators scream breakout. I am neither cheering for or bashing this stock. I am a swing trader only. I will take a position in the morning if it doesn't pop at the open

5 minute chart.
Found support along the 200 period EMA.

Here is an updated chart
Looks like we are pretty much in the same pattern as yesterday. you may call it a little consolidation period. Looks to be trading sideways. I'm looking for a breakout on or about the 21st. What are your thoughts? ;) And relax folks. Just a little humor to lighten the day. I really hope everything works out on GLER

Here is an updated chart
She came out of the consolidation on an ascending 20 period EMA with strong support. There was a little more volume yesterday than we had in the last couple weeks but its still low and that's where it needs to stay for an accumulation period. I would like to see the stochastics start to descend to keep the selling pressure low. All in all this is setting up nice. I would like to post a yearly chart but there is not enough info on it yet to read. Just not seeing a pattern on that one yet

The chart is pretty much the same as the last one I posted on here except for the huge red volume candle. Everything still looks good to me. This is just a hold and wait play
Man I wish I could tell you. That came out of nowhere. Not quite sure what it means
You bet friend. Have a good day. I'm going fishing ;)
Yup. People can sit on 1's until Jesus comes back and it will never get filled. Only way is if it went to no bid
Let me know when this goes to no bid. I guarantee you that's the only way you will get 1's
I see a hard pop coming soon and on lower volume
Looks like a little spit swapping to me. Like I said in an earlier post. I like the range this is working in and its getting wound up.
If I could put a percentage on it I would have to say maybe 98%? Maybe higher. My screen was glowing red lol
No it wasn't. The total majority were sells
Only way that will happen is if this goes to no bid. Other wise it aint gonna happen ;)
The way this is setting up on a 5 minute chart I wouldn't be surprised to see it go over the 3's and trading in the 4's in the next day or so. I would prefer it to stay in this range for a few days
If it does I will post a new chart on it lol
Chart for those who trade TA.
Here is a chart for todays action. I will be updating the chart as the day goes on
I have to agree with you on that. When I was younger RS was the place to go for me. I bought everything there. Like I said earlier im only playing this on a chart play off of a double bottom bounce. I hit an run lol
Sorry but I cant answer pm's. I can answer your question in public if you would like
Anytime you have a stock that has a pullback into consolidation you want a nice strong decline in volume. This and a descending stochastics allow the buying pressure to build up. This is what attracts seasoned traders like me and hundreds of others to take notice. This is an accumulation period. Stocks cant just keep climbing. There has to be a pullback at some point. A retracement to close the gap and allow the moving averages to catch up and show support. You can usually notice that the volume gets smaller and smaller as a few days go by then another explosion for another move north. Learning to read charts will let you know when its time to take some profits and ad some more into the pullback
Sorry but I don't make stupid trading decisions. I had a very successful trading career by taking profits and trading smart
RMTD chart
RMTD was flat lined for a few years. Huge volume explosion out of nowhere the last couple weeks. Nice decline in volume followed by a descending stochastics. This coupled with steady consolidation is primed for a breakout. Sudden increase in volume today and broke out of trading channel. Looks to explode

On what do you base your call on this? Just curious. Its a chart play for me
Ok that was funny lol
If she does decide to run you folks make sure you take some off the table to cover your positions

