 News
News  Market Data
  Discover
Support: 888-992-3836
Copyright © 2023 InvestorsHub Inc.


Nilbud
![]()
![]()
Register for free to join our community of investors and share your ideas. You will also get access to streaming quotes, interactive charts, trades, portfolio, live options flow and more tools.
Register for free to join our community of investors and share your ideas. You will also get access to streaming quotes, interactive charts, trades, portfolio, live options flow and more tools.
That's a great story, is there a stock connected to it?
Bearish Falling Three Methods Candlestick
• Direction: Bearish
• Type: Continuation
• Reliability: Strong

• In a downtrend, a long red day occurs
• The second, third and fourth days are short blue days that fall within the range of the first day
• The fifth day continues the downtrend with a long red candle that creates new lows
The Falling Three Methods pattern occurs in a bear market, where during a downtrend the market rests before resuming the trend. The bearish trends break is reflected by small candles that all stick to a strict market range formed by the aggressive move on day one.
A typical explanation for this type of formation might that the market is slowly digesting the relatively larger move in day-one. These small daily ranges often precede significant economic reports. Such periods of relative inactivity and tight trading are common in markets. Falling Three Methods is confirmed where a red candle dives down to new lows reinstituting the bearish trend.
Number of Middle Candles - In a picture perfect formation the middle candles number three. But realistically the pattern may have two, four or even five candles. Individually each middle candle may be a star or doji, red or blue.
Middle Candle Wicks - Important to note is that each middle candle wick needs to stay within the first candles high/low range to signal a strong continuation signal. With the bearish Falling Three Methods this is especially important for the highs. Should a wick trade to a high above the first large red candles high, it casts doubt over the strength of the established down trend.
Bullish Morning Doji Star
• Direction: Bullish
• Type: Reversal
• Reliability: Strong

• After an established down trending day-one is a long red day
• Day-two is a doji where the open and close are equal.
• Day-three is a blue day
Bullish Morning Doji Stars are a rare reversal pattern that offers one of the strongest bullish reversal signals in the Forex Market. Morning Star formations are characterized by a continuation of a bearish trend followed by a Doji, reflecting uncertainty in the strength of trend.
Up to day two we actually have a Doji Star formation, a moderate strength bullish pattern. After the day of indecision, the trend reversal is confirmed when a rally creates the large bullish candle. The stronger the move up on day-three, the stronger the reversal signal. Watch for additional bullish price action in the next few days.
In FX this formation practically identical to the bullish Abandoned baby. In non-FX markets candlestick analysts traditionally look for gaps to signal the strength of the Morning Doji Star pattern. Gaps between the close price and open price are very common outside efficient FX markets, since exchanges are traditionally limited to very short trading periods. Because Foreign Exchange trades 24 hours, gaps are very uncommon and need to be ignored in identifying Morning Star patterns.
Abandoned Baby (Bullish)

• Direction: Bullish
• Type: Reversal
• Reliability: Strong
• Day-one is a red day continuing an established bear trend.
• Day-two is a doji whose shadows trades below day-ones close.
• Day-three is a blue day that opens and trades above with little or no overlapping shadows
The Abandoned Baby is a rare bullish reversal pattern characterized by a large down move followed by a doji or small candle, and then a third candle heading in the opposite direction.
The formation reflects a classic three period reversal of market sentiment where after a bearish trend, finally enough buyers enter the market to take control. They first stop the trend's momentum (forming the doji), and then ultimately reverse the direction of the market.
This first red candle suggests a continuation of the bear market. That move is followed by a doji, where markets trade in a small range suggesting uncertainty in trend and a rally potential. Up to day two we actually have a Bullish Doji Star, moderate strength bullish pattern. After the day of indecision, a large bullish candle confirms buyers are staging a rally and reversal. The stronger the move up day-three, the stronger the reversal signal. Watch for additional bullish price action in the next few days.
Shooting Star
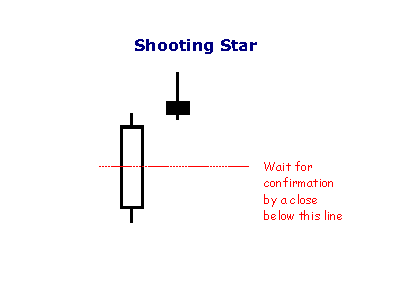
The shooting star is a type of bearish reversal pattern. The Shooting Star looks exactly the same as the Inverted hammer, but instead of being found in a downtrend it is found in an uptrend and thus has different implications. Like the Inverted hammer it is made up of a candle with a small lower body, little or no lower wick, and a long upper wick that is at least two times the size of the lower body.
The long upper wick of the candlestick pattern indicates that the buyers drove prices up at some point during the period in which the candle was formed but encountered selling pressure which drove prices back down for the period to close near to where they opened. As this occurred in an uptrend the selling pressure is seen as a potential reversal sign. When encountering this pattern traders will look for a lower open on the next period before considering the pattern valid and potentially including it in their trading strategy.
As with the Inverted hammer most traders will see a longer wick as a sign of a greater potential reversal and like to see an increase in volume on the day the Shooting Star forms.
Inverted Hammer

The Inverted Hammer is a type of bullish reversal pattern. As its name implies, the Inverted Hammer looks like an upside down version of the hammer candlestick pattern. Like the hammer candlestick pattern, the Inverted Hammer consists of one candle and when found in a downtrend is considered a potential reversal pattern.
The pattern is made up of a candle with a small lower body and a long upper wick which is at least two times as large as the short lower body. The body of the candle should be at the low end of the trading range and there should be little or no lower wick in the candle.

The long upper wick of the candlestick pattern indicates that the buyers drove prices up at some point during the period in which the candle was formed but encountered selling pressure which drove prices back down for the period to close near to where they opened. As this occurred in an uptrend the selling pressure is seen as a potential reversal sign. When encountering the Inverted Hammer traders will look for a higher open on the next period before considering the pattern confirmed and potentially including it in their trading strategy.
Marubozu Candlesticks
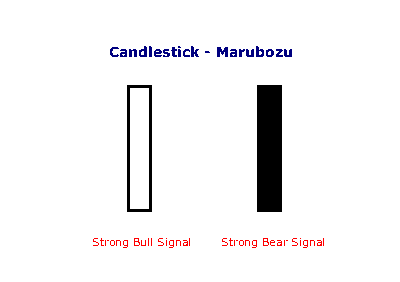
Marubozu are even stronger bull or bear signals than long lines as they show that buyers/sellers have remained in control from the open to the close -- there are no intra-day retracements.
Candlestick Patterns
Long Lines
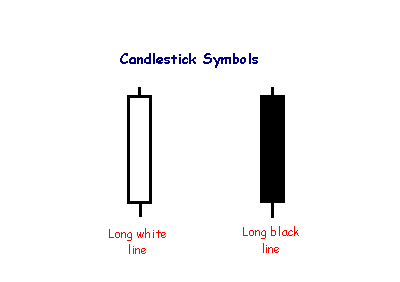
The long white line is a sign that buyers are firmly in control - a bullish candlestick.
A long black line shows that sellers are in control - definitely bearish.
Candlestick Colors
For improved presentation, Incredible Charts uses colors such as red and blue/green to indicate filled or hollow candlesticks:
Blue (or green) candlestick if the close is higher than the open;
Red candlestick if the open is higher than the close (i.e. the candlestick is filled);
The same color as the previous day, if the open is equal to the close.
Shadow and Tail
The shadow is the portion of the trading range outside of the body. We often refer to a candlestick as having a tall shadow or a long tail.
[img]static.incrediblecharts.com/images/png_images/candle_shadow_tail.png
[/img]
A tall shadow indicates resistance;
A long tail signals support.
Candlestick Charts
The Japanese have been using candlestick charts since the 17th century to analyze rice prices. Candlesticks were introduced into modern technical analysis by Steve Nison in his book Japanese Candlestick Charting Techniques.
Candlesticks contain the same data as a normal bar chart but highlight the relationship between opening and closing prices. The narrow stick represents the range of prices traded during the period (high to low) while the broad mid-section represents the opening and closing prices for the period.
If the close is higher than the open - the candlestick mid-section is hollow or shaded blue/green.
If the open is higher than the close - the candlestick mid-section is filled in or shaded red.
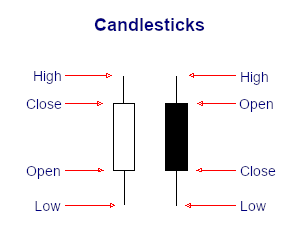
The advantage of candlestick charts is the ability to highlight trend weakness and reversal signals that may not be apparent on a normal bar chart.
Form TA-W ~ SEC Filings Explained
Notice of withdrawal from registration as transfer agent filed pursuant to the Securities Exchange Act of 1934
Form TA-2 ~ SEC Filings Explained
Annual report of transfer agent activities filed pursuant to the Securities Exchange Act of 1934
Form TA-1 ~ SEC Filings Explained
Application for registration as a transfer agent filed pursuant to the Securities Exchange Act of 1934
Form T-3 ~ SEC Filings Explained
Initial application for qualification of trust indentures
Form S-8 ~ SEC Filings Explained
Initial registration statement for securities to be offered to employees pursuant to employee benefit plans
Form S-6 ~ SEC Filings Explained
Initial registration statement filed on Form S-6 for unit investment trusts
Form S-4 ~ SEC Filings Explained
Registration of securities issued in business combination transactions
Form NT 11-Q ~ SEC Filings Explained
Notice under Rule 12b25 of inability to timely file all or part of a form 11-K
Form NT 10-Q ~ SEC Filings Explained
Notice under Rule 12b25 of inability to timely file all or part of a form 10-Q or 10-QSB
Form NT 10-K ~ SEC Filings Explained
Notice under Rule 12b25 of inability to timely file all or part of a Form 10-K, 10-KSB, or 10KT
Form N-Q ~ SEC Filings Explained
Quarterly Schedule of Portfolio Holdings of Registered Management Investment Company
Form N-PX ~ SEC Filings Explained
Annual Report of Proxy Voting Record of Registered Management Investment Companies
Form N-CSRS ~ SEC Filings Explained
Certified semi-annual shareholder report of registered management investment companies
Form N-CSR ~ SEC Filings Explained
Certified annual shareholder report of registered management investment companies
Form N-8F ~ SEC Filings Explained
Application for deregistration made on Form N-8F
Form N-8B-2 ~ SEC Filings Explained
Initial registration statement for unit investment trusts
Form N-8A ~ SEC Filings Explained
Initial notification of registration under section 8(a) filed on Form N-8A
Form N-6 ~ SEC Filings Explained
Registration statement for separate accounts
Form N-54A & N-54C ~ SEC Filings Explained
Notification of election by business development companies
Form N-4 ~ SEC Filings Explained
Initial registration statement on Form N-4 for separate accounts (unit investment trusts)
Form N-30D ~ SEC Filings Explained
Initial annual and semi-annual reports mailed to investment company shareholders
Form N-30B-2 ~ SEC Filings Explained
Periodic and interim reports mailed to investment company shareholders
Form N-23C3A ~ SEC Filings Explained
Notification of periodic repurchase offer Filed pursuant to Rule 23c-3(b) only
Form N-23C-2 ~ SEC Filings Explained
Notice by closed-end investment companies of intention to call or redeem their own securities
Form N-2 ~ SEC Filings Explained
Initial filing of a registration statement on Form N-2 for closed-end investment companies
Form N-2 ~ SEC Filings Explained
Initial filing of a registration statement on Form N-2 for closed-end investment companies
Form N-1A ~ SEC Filings Explained
Initial registration statement for open-end management investment companies
Form N-14/A ~ SEC Filings Explained
Initial registration statement for open-end investment company (Amendment)
Form N-14 8C ~ SEC Filings Explained
Initial registration statement filed on Form N14 by closed-end investment company (business combinations)

