 News
News  Market Data
  Discover
Support: 888-992-3836
Copyright © 2023 InvestorsHub Inc.


Bullwinkle
![]()
Register for free to join our community of investors and share your ideas. You will also get access to streaming quotes, interactive charts, trades, portfolio, live options flow and more tools.
Register for free to join our community of investors and share your ideas. You will also get access to streaming quotes, interactive charts, trades, portfolio, live options flow and more tools.
Police Cutbacks Drive Increase in Violence
THE REAL TRUTH Magazine
August 13, 2010
Across the United States, record numbers of law enforcement and public safety employees are being laid off due to budget shortfalls, prompting higher levels of violence in certain cities.
In Oakland, California, one of the nation’s most violent cities, 25 percent of the police force was cut due to a $42 million dollar budget gap. Likewise in Miami, over 100 officers were laid off from the force, with many more to follow in the coming months.
In the crime-plagued city of East St. Louis, leaders approved a measure to reduce the number of officers by 30 percent.
“I want our citizens to know we have some of the bravest police officers and firefighters in the country, but we don’t have the money to pay them,” the city’s Mayor, Alvin Parks told the St. Louis Post-Dispatch.
In some cities, a reduction in the number of officers means there are certain activities that law enforcement officials will not be able to do. Time-consuming investigations, tedious crime-lab procedures, stake-outs, DWI arrests and quelling mass protests all take time and often many officers. In states such as Michigan, which has only 24 officers per 10,000 people, law enforcement authorities have to prioritize their work, while keeping in mind that they may not have back up officers to assist them should a dangerous situation arise.
Authorities have already witnessed a rise in crime as a result of the cuts and shrinking police force. New York City reduced its force by 4,685 officers so far this year, and plans to cut an additional 3,150 more by 2011. The reduction spurred an increase in violent crime, with homicides up 22 percent, and shootings up 14 percent.
In Manhattan alone, robberies increased by 14 percent and burglaries by 19.8 percent. There has also been a noticeable rise in nearly all other reported crimes, such as rape, prostitution, drug sales and car thefts.
New York Mayor Michael R. Bloomberg told The New York Times the increase in violent crime is “worrisome.”
“We have fewer police officers on the streets than we did before,” he said.
With federal stimulus and grant money evaporating and limited options, officials expect to see more cuts in government services nationwide.
http://www.realtruth.org/news/100813-003-crime.html
Gold Hedge Fund Takes Aim at Gold ETFs
Source: Seeking Alpha
Aug 16 10:54 AM
There’s more glitter than gold in gold exchange-traded funds, one prominent gold hedge fund has claimed.
Hinde Capital took aim at gold ETFs and State Street’s SPDR Gold Trust (GLD) in particular, in a recent paper. The London-based firm wrote that central banks’ practice of lending gold to commercial banks leads to a lot of double-counting in the global markets, and that ETFs are one of the biggest culprits on that score.
“We see it as highly likely that encumbered gold or leased gold could be in ETF products,” CEO Ben Davies wrote. “If we were a major ETF holder, we would demand delivery of our physical bullion before all other investors demanded theirs from either ETFs or the OTC market.”
Of course, Hinde isn’t a major gold ETF holder, because, as Davies wrote, gold and other precious metal ETFs “should not be owned by serious professional investors,” the Financial Times reports.
Davies also called State Street’s management of the SPDR Gold Trust—by far the largest gold ETF—into question, noting that the fund’s custodian, HSBC, is a substantial shorter of gold. State Street brushed off the criticism.
http://seekingalpha.com/article/220675-gold-hedge-fund-takes-aim-at-gold-etfs?source=yahoo
25 Questions To Ask Anyone Who Is Delusional Enough To Believe That This Economic Recovery Is Real
Source: The Economic Collapse Blogspot
May 25th, 2010 at 11:26 am
Are You Prepared For The Coming Economic Collapse And The Next Great Depression?

If you listen to the mainstream media long enough, you just might be tempted to believe that the United States has emerged from the recession and is now in the middle of a full-fledged economic recovery. In fact, according to Obama administration officials, the great American economic machine has roared back to life, stronger and more vibrant than ever before. But is that really the case? Of course not. You would have to be delusional to believe that. What did happen was that all of the stimulus packages and government spending and new debt that Obama and the U.S. Congress pumped into the economy bought us a little bit of time. But they have also made our long-term economic problems far worse. The reality is that the U.S. cannot keep supporting an economy on an ocean of red ink forever. At some point the charade is going to come crashing down.
And GDP is not a really good measure of the economic health of a nation. For example, if you would have looked at the growth of GDP in the Weimar republic in the early 1930s, you may have been tempted to think that the German economy was really thriving. German citizens were spending increasingly massive amounts of money. But of course that money was becoming increasingly worthless at the same time as hyperinflation spiralled out of control.
Well, today the purchasing power of our dollar is rapidly eroding as the price of food and other necessities continues to increase. So just because Americans are spending a little bit more money than before really doesn't mean much of anything. As you will see below, there are a whole bunch of other signs that the U.S. economy is in very, very serious trouble.
Any "recovery" that the U.S. economy is experiencing is illusory and will be quite temporary. The entire financial system of the United States is falling apart, and the powers that be can try to patch it up and prop it up for a while, but in the end this thing is going to come crashing down.
But as obvious as that may seem to most of us, there are still quite a few people out there that are absolutely convinced that the U.S. economy will fully recover and will soon be stronger than ever.
So the following are 25 questions to ask anyone who is delusional enough to believe that this economic recovery is real....
#1) In what universe is an economy with 39.68 million Americans on food stamps considered to be a healthy, recovering economy? In fact, the U.S. Department of Agriculture forecasts that enrollment in the food stamp program will exceed 43 million Americans in 2011. Is a rapidly increasing number of Americans on food stamps a good sign or a bad sign for the economy?
#2) According to RealtyTrac, foreclosure filings were reported on 367,056 properties in the month of March. This was an increase of almost 19 percent from February, and it was the highest monthly total since RealtyTrac began issuing its report back in January 2005. So can you please explain again how the U.S. real estate market is getting better?
#3) The Mortgage Bankers Association just announced that more than 10 percent of U.S. homeowners with a mortgage had missed at least one payment in the January-March period. That was a record high and up from 9.1 percent a year ago. Do you think that is an indication that the U.S. housing market is recovering?
#4) How can the U.S. real estate market be considered healthy when, for the first time in modern history, banks own a greater share of residential housing net worth in the United States than all individual Americans put together?
#5) With the U.S. Congress planning to quadruple oil taxes, what do you think that is going to do to the price of gasoline in the United States and how do you think that will affect the U.S. economy?
#6) Do you think that it is a good sign that Arnold Schwarzenegger, the governor of the state of California, says that "terrible cuts" are urgently needed in order to avoid a complete financial disaster in his state?
#7) But it just isn't California that is in trouble. Dozens of U.S. states are in such bad financial shape that they are getting ready for their biggest budget cuts in decades. What do you think all of those budget cuts will do to the economy?
#8) In March, the U.S. trade deficit widened to its highest level since December 2008. Month after month after month we buy much more from the rest of the world than they buy from us. Wealth is draining out of the United States at an unprecedented rate. So is the fact that the gigantic U.S. trade deficit is actually getting bigger a good sign or a bad sign for the U.S. economy?
#9) Considering the fact that the U.S. government is projected to have a 1.6 trillion dollar deficit in 2010, and considering the fact that if you went out and spent one dollar every single second it would take you more than 31,000 years to spend a trillion dollars, how can anyone in their right mind claim that the U.S. economy is getting healthier when we are getting into so much debt?
#10) The U.S. Treasury Department recently announced that the U.S. government suffered a wider-than-expected budget deficit of 82.69 billion dollars in April. So is the fact that the red ink of the U.S. government is actually worse than projected a good sign or a bad sign?
#11) According to one new report, the U.S. national debt will reach 100 percent of GDP by the year 2015. So is that a sign of economic recovery or of economic disaster?
#12) Monstrous amounts of oil continue to gush freely into the Gulf of Mexico, and analysts are already projecting that the seafood and tourism industries along the Gulf coast will be devastated for decades by this unprecedented environmental disaster. In light of those facts, how in the world can anyone project that the U.S. economy will soon be stronger than ever?
#13) The FDIC's list of problem banks recently hit a 17-year high. Do you think that an increasing number of small banks failing is a good sign or a bad sign for the U.S. economy?
#14) The FDIC is backing 8,000 banks that have a total of $13 trillion in assets with a deposit insurance fund that is basically flat broke. So what do you think will happen if a significant number of small banks do start failing?
#15) Existing home sales in the United States jumped 7.6 percent in April. That is the good news. The bad news is that this increase only happened because the deadline to take advantage of the temporary home buyer tax credit (government bribe) was looming. So now that there is no more tax credit for home buyers, what will that do to home sales?
#16) Both Fannie Mae and Freddie Mac recently told the U.S. government that they are going to need even more bailout money. So what does it say about the U.S. economy when the two "pillars" of the U.S. mortgage industry are government-backed financial black holes that the U.S. government has to relentlessly pour money into?
#17) 43 percent of Americans have less than $10,000 saved for retirement. Tens of millions of Americans find themselves just one lawsuit, one really bad traffic accident or one very serious illness away from financial ruin. With so many Americans living on the edge, how can you say that the economy is healthy?
#18) The mayor of Detroit says that the real unemployment rate in his city is somewhere around 50 percent. So can the U.S. really be experiencing an economic recovery when so many are still unemployed in one of America's biggest cities?
#19) Gallup's measure of underemployment hit 20.0% on March 15th. That was up from 19.7% two weeks earlier and 19.5% at the start of the year. Do you think that is a good trend or a bad trend?
#20) One new poll shows that 76 percent of Americans believe that the U.S. economy is still in a recession. So are the vast majority of Americans just stupid or could we still actually be in a recession?
#21) The bottom 40 percent of those living in the United States now collectively own less than 1 percent of the nation’s wealth. So is Barack Obama's mantra that "what is good for Wall Street is good for Main Street" actually true?
#22) Richard Russell, the famous author of the Dow Theory Letters, says that Americans should sell anything they can sell in order to get liquid because of the economic trouble that is coming. Do you think that Richard Russell is delusional or could he possibly have a point?
#23) Defaults on apartment building mortgages held by U.S. banks climbed to a record 4.6 percent in the first quarter of 2010. In fact, that was almost twice the level of a year earlier. Does that look like a good trend to you?
#24) In March, the price of fresh and dried vegetables in the United States soared 49.3% - the most in 16 years. Is it a sign of a healthy economy when food prices are increasing so dramatically?
#25) 1.41 million Americans filed for personal bankruptcy in 2009 - a 32 percent increase over 2008. Not only that, more Americans filed for bankruptcy in March 2010 than during any month since U.S. bankruptcy law was tightened in October 2005. So shouldn't we at least wait until the number of Americans filing for bankruptcy is not setting new all-time records before we even dare whisper the words "economic recovery"?
http://theeconomiccollapseblog.com/archives/25-questions-to-ask-anyone-who-is-delusional-enough-to-believe-that-this-economic-recovery-is-real
Marc Faber: Protect Your Property with High Voltage Fences, Barbed Wire, Booby Traps, Military Weapons and Dobermans
by Mac Slavo
August 10, 2010
SHTF Plan
Recently by Mac Slavo: Marc Faber and Mish on Inflation, Deflation, Doom and the End of Civilization
Investment guru and publisher of The Gloom, Boom and Doom report, Marc Faber, regularly discusses investment strategies for protecting and building wealth during times of economic distress. He has recommended purchasing gold, silver and foreign assets because of what he perceives to be an impending economic catastrophe in the United States.
He’s suggested that war, including traditional international conflict, civil war and non-traditional terror strikes, may eventually affect the United States and potentially turn it into what would could be perceived as a third-world country. Even if the US were to avoid a war on our own soil (which is unlikely according to Faber), the economic crisis will lead to serious problems for citizens by driving most into bankruptcy through hyperinflation of the US dollar, forcing most to literally fight for food and resources – thus he sees social unrest and riots on the horizon.
In addition to investment advice, Marc Faber also provides practical advice for those looking to preserve their well being. His advice is often looked at as a joke, but make no mistake, Faber is totally serious, even if he has a grin on his face when he says that the world as we know it is coming to an end.
In his latest GBD Report, Faber again advises those with the means to do it, to leave urban areas and seek safety in rural, country areas, preferably farms, and to be prepared to defend that land in the event the worst happens:
Faber has an interesting suggestion for investors if the plunge comes to pass.
With tongue apparently in cheek, he says buy a farm you can tend to yourself way out in the boondocks. And protect it with high voltage fences, barbed wire, booby traps, military weapons and Dobermans.
source: Money News
For those expecting a full-fledged recovery to take hold and new highs in the stock market, be careful. Marc Faber on markets:
The market is overbought, and there is a renewed sense of complacency that could get shattered pretty quickly.
While the stock market is not a clear-cut measure of the health of an economy, most Americans watch only the Dow Jones to determine the state of affairs. According to many, all is well. The Dow Jones is back over 10,000 and the depression, as President Obama himself has said, has been averted.
Those same perceptions will shift on a dime if the stock market were to collapse yet again – which in our view, is likely going to happen.
Though the stock market itself will not be the responsible for a hyperinflationary collapse, the resulting government intervention in terms of massive monetary expansion (like we saw after 2008) could very well lead to Marc Faber hyperinflation scenario somewhere down the road.
In a recent interview on CNBC, Marc Faber sees the crisis accelerating and the-powers-that-be have only one solution they’ll use to try to save the system:
The Fed would continue to monetize and this is my view. They will never let up. They will print and print and print, until the final crisis wipes out the entire system.
The Federal Reserve with its policy and with the writings and papers that Mr. Bernanke has published about the great depression that more quantitative easing will be forthcoming. And significantly more.
Significantly more.
The take away from Faber? As he’s stated before, it’s going to end in total disaster and you must own gold and land.
And if you do happen to make it to the boondocks (or are already there) in the worst case scenario, consider the thousands, perhaps millions who will be migrating out of major cities in search of food, clean water, resources and a safe place to sleep.
Perhaps having several hundred feet of barbed wire stored up in the barn out back isn’t such a bad idea.
Reprinted from SHTF Plan.
Mac Slavo [send him mail] is a small business owner and independent investor.
http://www.lewrockwell.com/orig11/slavo8.1.1.html
Washington's Idea of Fiscal Restraint
Posted by Ron Paul
08-16-2010, 01:14 PM
It has been months now since the new healthcare reform bill was passed into law. As is so typical, this massive piece of legislation was passed with a sense of urgency so acute that leadership declared America could not afford to wait until legislators, their staff and the general public had time to thoroughly read the bill.
The truth comes out eventually, however. Much like the recently discovered exemption from Freedom of Information Act requirements for the SEC that was slipped into the equally massive and “urgent” financial reform bill, we are finally seeing what other insidiousness has been hiding in the fine print of the healthcare reform bill. It seems that all provisions in this poorly written and poorly conceived monstrosity need to be repealed as soon as possible.
One such disaster-waiting-to-happen is one of the revenue generating provisions used to claim that the healthcare reform bill was “paid for”. $17 billion in additional tax revenues is supposed to come from an onerous new IRS reporting requirement that any taxpayer with business income who spends over $600 in one year with one business will have to report those expenditures to the IRS. Mind you, this is a cumulative total of $600 in transactions in one year. This will involve so much extra accounting and paperwork that the IRS claims it will be unable to deal with it effectively, and even the American Institute of Certified Public Accountants (to whom it should be a boon) has come out against it! Apparently they realize they will actually lose customers, especially small businesses, to bankruptcy because of this!
Gold dealers are especially alarmed by this provision, as most of their transactions easily top $600. This represents a significant outlay of time and paperwork and no additional revenue for businesses with which to hire people. Not to mention this makes every business a de facto IRS agent, as if they didn’t have enough to worry about already!
Of course, there is a tremendous outcry against this. Several other legislators also see how unreasonable this is and are trying to repeal it. However, this would simply mean that $17 billion in healthcare funding will have to come from somewhere else, and there are no good options. Taxes from some other equally bad collection scheme? Borrowing and more debt? Creating more money from thin air and adding to inflationary pressures?
The best answer, of course, would be to repeal the entire health care law, along with all other unconstitutional spending. But Congress is more likely to continue the shell game to cover the fact that we are broke and can afford none of this.
This whole idea of “paying for” new programs is a political euphemism that suggests that raising taxes is just as good as cutting spending since neither one increases the national debt. Raising taxes and overwhelming small businesses with paperwork and regulations still increases governmental burden on our fragile economy. But this is our government’s idea of “fiscal restraint” in action. Washington needs to stop creating new programs and spending so much money. That would be true fiscal restraint.
http://www.house.gov/htbin/blog_inc?BLOG,tx14_paul,blog,999,All,Item not found,ID=100816_3732,TEMPLATE=postingdetail.shtml
A Fragile Economic Outlook Continues
John P. Hussman, Ph.D.
August 16, 2010
Last week, the markets responded to further evidence of a slowing in economic activity, including a further deterioration in new claims for unemployment. Given that the sharpest deterioration in leading economic measures such as our Recession Warning Composite and the ECRI weekly leading index growth rate occurred in the May-June period, we will remain concerned about deterioration in employment conditions through the October-November time frame, based on typical lags in the data. Weakness in the ISM data typically follows leading economic measures more quickly, so the August and September readings will be important data points. Clearly, we are in the window where the market would be expected to be very sensitive to changes in the economic outlook, which is largely what we observed last week in both stocks and bonds.
Among modest positive signs, the growth rate of the ECRI Weekly Leading Index ticked up slightly to a -9.3% reading, but still at a level that would be consistent with an ISM Purchasing Managers Index in the low 40's by October or November. While the ECRI has expressed increasing economic concerns, it has not yet warned conclusively of a double dip. This is not a heated disagreement, simply a difference in analysis and statistical interpretation. For our part, we view the recent few quarters of economic expansion as the result of enormous fiscal and monetary stimulus, without much "intrinsic" private sector expansion at all. Now that inventories are replenished and the fiscal stimulus is tapering off, my impression is that the underlying and still uncorrected fragility in the economy is likely to reassert itself for a time.
I should note that the ECRI recently published a piece reflecting frustration at the misinterpretation of its data by a number of analysts. Since we have a lot of respect for ECRI, I checked with Lakshman Achuthan to make sure we hadn't contributed to that. Lakshman assured us "We don't have any problem with your work. In our article, we were trying to address the overly simplistic analysis done by a number of commentators ... and that wasn't you. Basically, the amount of slanted or confused commentary was becoming so great that we saw a growing risk in terms of permanent reputational damage to the WLI."
From our standpoint, the best interpretation of the ECRI data is that we've observed clear indications of a likely slowdown in economic activity, though there remains some uncertainty as to whether it will be sufficiently deep to define a double dip or an extension of an existing recession. The WLI has a very strong correlation with ISM data with a lead time of about 13 weeks, and significant though less powerful correlation with new unemployment claims with a lead time of about 23 weeks. For that reason, the next few months will be an important window for the U.S. economy. The stock market is currently priced in a manner that largely requires the economy to avoid such a soft patch, and the likelihood of avoiding a downturn entirely is extremely low on a statistical basis. There is enough fragility in the housing and employment markets that even a moderate period of economic weakness would likely have very pronounced effects on variables such as confidence, credit spreads, mortgage delinquencies, and other sentiment-related measures. Stock prices seem unlikely to be excluded from that group.
To put some numbers on this, since 1967, when the growth rate of the ECRI Weekly Leading Index has been negative and falling (i.e. no more than 10 points from its 6-month low), the 4-week average of new claims for unemployment has been above its 5-year average, and the S&P 500 has been - based on our standard estimation methodology - priced to deliver a 10-year average annual total return of anything less than 9% (our current projection is closer to 6%), the S&P 500 has lost value at a -17.3% annual rate. Interestingly, the prevailing trend of the market has not mattered in this environment. For example, the average loss has been nearly the same regardless of whether the S&P 500 was above or below its 50-day moving average, though returns have actually been somewhat worse if the S&P 500 was above its 200-day moving average at the time. Suffice it to say that the present combination of valuations and economic indications is not constructive.
Market Climate
As of last week, the Market Climate for stocks was characterized by rich valuations, unfavorable economic pressures, and elevated though not extreme bullish sentiment (the Investors Intelligence figures are 41.7% bulls vs. 27.5% bears). We also observed an abrupt and somewhat surprising amount of technical damage last week. That damage is not quite to the level that would create urgent downside concerns, but as I noted last week, the deterioration could be very abrupt if the economic data continue to come in weaker than expected. We are fully hedged in the Strategic Growth Fund. Given the repeated tendency for investors to "buy the dips" on the false perception that stocks are cheap (primarily on the "forward operating earnings" argument that we've analyzed in recent weeks), we may see a "fast, furious, prone-to-failure" advance to clear the short-term oversold conditions we developed last week. Still, caution is important here, since we're in a set of conditions where one or two hard down days can wipe out weeks of choppy upside progress.
In bonds, the Market Climate remained characterized last week by unfavorable yield levels and favorable yield pressures. Over the near term, perceptions of economic risk are clearly dominant, and given the tendency for the Treasury yield curve to flatten during periods of economic weakness, we may see long-term Treasury yields pressed even lower for a while. At the same time, however, increased risk perceptions could hit corporate bonds very hard even in a softening economic environment. While corporate cash levels may very well reduce liquidity risk for companies that would otherwise need to raise funds in a tight credit market, investors should not ignore that the overall debt burden of U.S. corporations is higher than it has ever been.
For companies with low earnings cyclicality, cash provides a clearly better margin of safety than for companies that are prone to earnings losses during periods of economic weakness. Just as dividends have to be evaluated in relation to the earnings available to cover those dividends, and the stability of those earnings, investors wishing to hold corporate bonds for additional "pickup" in yield should pay close attention to earnings stability, cash reserves, and overall debt burdens. We would emphatically avoid the debt of financials and cyclicals that are prone to massive "extraordinary" losses that can quickly wipe out available liquidity.
New from Bill Hester: The Paradox of the Zero Bound
---
Prospectuses for the Hussman Strategic Growth Fund and the Hussman Strategic Total Return Fund, as well as Fund reports and other information, are available by clicking "The Funds" menu button from any page of this website.
http://www.hussmanfunds.com/wmc/wmc100816.htm
Fed "Guidance" and Trade Data Torpedo Market
By Louis Navellier
Monday, August 16, 2010
As the second quarter earnings season draws to a close, 75% of the reporting S&P 500 companies have exceeded analysts' estimates, while the average earnings surprise has been 10.6% above expectations, delivering the sixth straight quarter of positive earnings surprises. Despite this upbeat trend, the market tanked, due to some shockingly negative trade numbers and misguided "guidance" by top Fed officials. As a result, the S&P lost 3.8% last week, pushing the stock market into negative territory, year-to-date.
Stat of the Week: $50 Billion June Trade Deficit Deflates GDP
What rattled last week's stock market the most was Wednesday's report by the U.S. Commerce Department that the June trade deficit grew by 18.8% to $49.9 billion, up from $42 billion in May. This was the largest monthly trade deficit in 21 months and the biggest increase in 11 months.
Looking more closely at the components, June's imports rose 3% to $200.3 billion, while exports fell 1.3% to $150.5 billion. Since June was the closing month of the second quarter, this shocking statistic means that the initial second-quarter GDP estimate of +2.4% will likely have to be revised down to 1.5%, or 1.2%, or perhaps as low as 1% (GDP will be released August 27). The reason for this revision is that output once thought to be domestically produced came from imports instead - goods made overseas.
The global economic recovery remains strong, especially in China and Germany, while the U.S. appears to be a drag on the global economy. A closer look at July retail sales, for instance, reflects this trend. July's 0.4% rise in retail sales was mostly due to rising gasoline prices - up 2.3% in July. A rising dollar volume of sales disguised a real (after-inflation) decline, since sales at most retail stores fell in July.
In addition, the Labor Department announced on Thursday that new jobless claims rose by 2,000 (to 484,000) in the latest week. The four-week average of new jobless claims rose by 14,250 to 473,500, the highest level since late February. Although this rise may seem small, any rise during a recovery is disappointing, reigniting fears of a "double dip" recession, due to stubbornly high jobless figures.
In other news, The Wall Street Journal survey of 53 economists, released Thursday, showed that most economists are getting more pessimistic. On average, they expect the U.S. economy to add just 136,000 jobs a month over the next 12 months, down from their earlier forecast of 157,000 in July. In addition, these economists did not support the termination of the 2003 tax cuts. Only three of the 53 economists wanted these tax cuts to expire, while 32 economists said these tax cuts should be extended for everyone.
Misguided Fed "Guidance" Also Spooked the Markets
The Federal Reserve also contributed to last week's market fears, with their tangled verbiage during and after last week's Federal Open Market Committee (FOMC) meetings. Specifically, the Fed's official statement said that a "more modest" economic recovery led the Fed to reinvest the proceeds of maturing mortgages in U.S. Treasury debt. Translated from Fedspeak, this means that the Fed will resume their "quantitative easing" (QE) by buying Treasury bonds, which will likely depress long-term Treasury rates.
Although most economists anticipated that the Fed would resume its quantitative easing, due to slower economic growth rates, statements like "the pace of economic recovery is likely to be more modest in the near term than had been anticipated," and "lending by banks…has continued to contract" seemed to rattle investors around the world. Many investors sold stocks due to the Fed's new wrinkle in monetary policy.
Speaking for the Fed minority, Kansas City Fed President Thomas Hoenig - who has been a dissenter at every FOMC meeting this year - said in a Friday speech in Lincoln, Nebraska that the Fed's policy of keeping interest rates near zero represents "a dangerous gamble" during a time of moderate growth. He warned that Fed Chairman Ben Bernanke and his allies were risking a double-dip recession.
Specifically, Hoenig said that "a zero policy rate during a crisis is understandable, but a zero rate after a year of recovery gives legitimacy to questions about the sustainability of the recovery and adds to uncertainty." Hoenig also stressed that "monetary policy ... cannot solve every problem faced by the United States today. In trying to use monetary policy as a cure-all, we will repeat the cycle of severe recession and unemployment in a few short years by keeping rates too low for too long."
The positive side of Hoenig's view is that he thinks the economy is stronger than most analysts realize. In fact, Hoenig is one of the more bullish Fed officials about the overall economic outlook. He argued on Friday that the economic news was not as bad as reported in the media or by Wall Street experts, saying that, "while the monthly data may be mixed, the trend data are consistently positive."
China and Other Global Markets Fuel U.S. Earnings Explosion
The U.S. may be sputtering, but the global economic bus continues to be driven by China and other nations. The main reason why we see a V-shaped recovery in earnings, despite a flat-line U-shaped recovery (so far) is that approximately 40% of the S&P 500's earnings come from overseas operations, where economic growth is far more robust than it is within the United States. Take China, for instance:
On Wednesday, Wall Street was rattled a bit when it was announced that China's industrial output slowed in July, "falling" to a 13.4% annual pace, down from a 13.7% rate in June. Additionally, China's capital spending "slowed" to a 22.3% annual pace in July, down from 25% in previous months. Finally, China's retail sales in July "slowed" to a 17.9% growth rate, down from an 18.3% annual pace in June. Since Wall Street usually shoots first and thinks later, this China report added to Wednesday's market carnage.
In Europe, strong Chinese demand continues to lift Germany's exports, which surged 16% in June (vs. May, on an absolute basis). As a result, Germany's GDP rose an estimated 2.2% in the second quarter compared to the first quarter, an annualized GDP growth rate of 9.1%! Unlike the U.S., Germany has chosen not to engage in any trade wars with China, so they have not been hit with any extreme tariffs. Meanwhile, China has installed a 105% tariff on U.S. broiler chickens, due to our tariffs on their tires.
I should add that the growing middle class in Asia, India and Latin America continue to create global demand and drive GDP growth. While exports are rising to these regions and helping to boost European GDP growth, the U.S. has been left behind, especially now that it has been revealed that U.S. exports actually fell in June. China's exports continue to soar (by a whopping 38.1% in July) and are now at their highest level in 18 months, while U.S. exports have contracted, due in part to the U.S./China trade wars.
Obama's Budget Blues Deepen, as Mid-Term Elections Loom
On Wednesday, the Treasury Department announced that the federal budget deficit was a whopping $165 billion in July, marking the 22nd straight monthly deficit. Federal outlays rose to $321 billion, while tax receipts were only $156 billion, so the U.S. government spent more than twice what it collected in taxes.
Complicating matters is that after 48,000 state and local workers lost their jobs in July (and over 300,000 since August 2008), Congress reconvened for an emergency session to pass a $26.1 billion aid package to save more state and local jobs from financially troubled states like California, Illinois and New York. But in order to pass that $26 billion aid package, Congress took $12 billion from the food stamp program!
Bottom line, with unemployment now apparently at the highest level in almost six months and Congress desperately raiding food stamp money to try to preserve more jobs, unemployment is likely to be the #1 issue for Congressional representatives running for re-election in the upcoming mid-term elections.
This brings up the best piece of good news I can offer you. Historically, the mid-term election-year rally begins in late September and lasts 26 months - all the way through the 2012 Presidential elections. If we see a major political shift this November, as we did in 1994, the next two years could be great, as 1995 and 1996 were, when the Clinton Administration worked well with the new Congressional leadership.
I don't know if the tax cuts will really end next year, but I do know that 142 stocks in the S&P 500 have boosted their dividends so far this year. If federal taxes on dividends end up rising from 15% to 39.6% next year, then we can take advantage of companies "front-loading" their dividends before tax rates rise.
As long as the Dow yields more than Treasury bonds and more companies rush to boost their dividends, I believe that the foundation for a major stock market rally is definitely brewing for the upcoming months.
http://navellier.com/commentary/weekly_marketmail.aspx
MMA Comments for the Week
Beginning August 16, 2010
Written by Raymond Merriman
Review and Preview
Did you see that?
The Federal Reserve Board’s decision last Tuesday to resume buying U.S. Treasuries (but not mortgage backed securities) instead of drawing down its post-2007 triple-sized bloated balance sheet, is at least the third major development that has occurred within the midsection of the Cardinal Climax, July 21-August 21. The other two include passage of the “Financial Regulatory Reform Act” on July 21 and the extremely dry and hot drought conditions that have caused deadly fires in Russia, and led to a huge run up in Wheat prices around the world.
Many world equity markets fell fairly hard last week, following the series of intermarket bearish divergence signals in all regions of the world between June 21 and the highs that have occurred within the central time band of this Cardinal Climax. In Europe, the AEX of Netherlands attained a recent high of 341 on August 4, which was below its high of 343.32 recorded on June 21. The SMI of Switzerland also made a lower high on August 6 at 6409 than its previous cycle high of 6531 on June 21. But this not the case in the German DAX and London FTSE, which both exceeded their highs of June 21. The DAX made a new yearly high at 6386 on August 6, and the FTSE made a new cycle high of 5418 on August 9. Each of these indices then fell sharply into weekly lows on Thursday or Friday.
In Asia and the Pacific Rim, intermarket bearish divergence was also evident on the recent highs into the heart of the Cardinal Climax. The 9750-9760 highs of July 28 and August 3 in the Japanese Nikkei Index were far below its 10,251 high of June 21. Australia’s All Ordinaries got to 4618 on August 9, but that was slightly under the prior cycle high of 4631 on June 21. But the Hang Seng or Hang Kong, NIFTY of India, and MICEX of Moscow all make new cycle highs in this Cardinal Climax midsection before tumbling down into the end of last week.
In the Americas, the Bovespa of Brazil and Merval index of Argentina made new cycle highs on August 9, along with the Dow Jones Industrial Average. They all exceeded their prior cycle highs of June 21. However this did not occur in the NASDAQ Composite Index, which could only get up to 2309 on August 9, well below its 2341 high of June 21. When you have so many cases of intermarket bearish divergence in a critical reversal zone, where one index in a region makes a new cycle high and others do not, it is oftentimes followed with a sharp decline. In many cases, it will indicate a primary cycle crest is in. If that is the case now, the market could be under pressure into the mid-term elections, or Venus changing to its retrograde direction (October 8). The last Venus retrograde took place on March 6, 2009, the low of the “Panic Crisis” bear market. Every 8 years it retrogrades in approximately the same degree of the zodiac. In this case that will be in Scorpio. The Venus retrograde of 8 years ago was on October 10, 2002. Other stock indices made a slightly lower 4-year cycle in March around the world following President Bush’s decision to invade and overthrow the regime of Saddam Hussein in Iraq.
Equities were not the only financial markets to make noteworthy moves last week. The most important development was in the U.S. Treasury markets, which blasted upwards following the Fed’s decision to resume purchase of these very long-term debt obligations of the U.S. Government. We said there could be a bubble, and if it happened in Treasures, it would result in “Double Bubble Trouble.” Indeed, that seems to be happening now as Treasuries approach the levels present in the height of the 2008 Panic. The Fed’s decision makes one wonder if things are progressing so badly that there is real danger of another economic and market collapse. Why would they take Treasuries back to the level of the 2008 crisis days if the economy was improving and stabilizing as the White House and its “Economic Dream Team” continues to insist? Somebody is not telling the whole story to the American people and the world. Don’t take my word for it. Take the word of the San Francisco Federal Reserve Bank report issued last week, stating that “… the probability that the U.S. economy will slip back into recession over the next two years is higher than that of economic expansion.” (CNBC.com, August 10).
Short-Term Geocosmics
Another powerful line up of geocosmic signatures is set to engage this week, which is all part of the July 21-August 21 midsection of this tremendous celestial pattern known as the Cardinal Climax (2008-2015). The good news is that we will begin to exit the deepest part of the cosmic abyss. The not-so-good-news is that some of the decisions that have been made and policies that have been enacted in the past three weeks may lead to prolonged economic difficulties and perhaps bear markets in several financial markets. That, by the way, is an opinion of mine and not a given fact. I could be wrong, because we are in uncharted waters, and no one knows for certain what the consequences will be. But over the next few weeks (and in Forecast 2011) I will explain my reasoning within the context of historical instances of such geocosmic signatures and their correlation to the outcome similar economic and political themes.
We have much to look forward to this coming week in terms of geocosmic activity that will complete this phase – the fifth and deepest layer - of the Cardinal Climax. On Friday, August 13, Uranus moves back into Pisces from Aries. It will return to Aries for seven years after March 4, 2011. In the meantime, it may suggest going back and redoing parts of the Health Care Reform Act (Pisces rules health care, and Uranus represents changes). Perhaps Congress will consider removing the onerous non-health care mandate within that bill of hiring thousands of new IRS agents with the task of siphoning through massive amounts of new government reporting requirements for quarterly business expenditures exceeding $600. What does hiring more IRS agents have to do with health care reform, if the cost is not a tax?
On Monday, August 16, Jupiter will form its second of three oppositions to Saturn. This is a 20-year planetary cycle that has a fairly reliable correlation to long-term market cycles, and oftentimes coincides with 4-year cycles. You may remember the last opposition between these two planets was in 1990, which also coincided with a recession and a modest bear market in stocks. It also correlated with a hefty tax increase by President George H. Bush (father of ‘W’).
At the end of this week (August 20-21), the current phase of the Cardinal Climax will end with Venus will conjunct Mars in Libra (Venus rules Libra, Mars is in detriment in Libra), the Sun will be in opposition to Neptune (a very powerful Level 1 reversal signature), Mercury will commence its three-week retrograde motion through September 12, and Saturn will end its 32-37 year waning square to Pluto cycle. As stated last week, “Then we might be able to look back and realize the importance of what just happened. Or maybe we will even need to wait until Mercury retrograde ends before we begin to understand it all.”
Longer-Term Thoughts
Laying on the ground up here late into the night, in the back woods and on the ancient inland waterways of Northern Michigan, watching the awesome shooting stars of the Perseid meteor showers, it came to me in a flash. The Cardinal Climax is all about a shift in power, a shift in the balance of power in all aspects of world finance and politics. Think of it as the decisions that will lead to shift in power between banks, business, and the government and its new army of regulators, not to mention the people (who are they in this new world that is being crafted?). A shift in the value of currencies, and hence rearrangement of economic strength of nations, may be a natural result of what is transpiring in the heat of the Cardinal Climax. In my opinion, this powerful time band is indeed living up to its hype. Money will soon be valued differently, led by different nations and different standards than are used today. An era is coming to an end.
This cause for this shift in power is related to the explosion of debt in the world, and how various countries are dealing completely differently with it. “The economy is looking brighter in Britain and Germany after these governments announced plans to reduce spending,” according to an article in Thursday’s Wall Street Journal by Professor Allen Metzner, titled, “Europe Jumps of the Keynesian Bus.” But what did the United States do?
Last week the United States and its Central Bank, the Federal Reserve Board, had a choice regarding economic policy. They could take Britain and Germany’s path of “Chic Austerity,” denoted by Saturn in Libra as it forms a T-square to the Sun-Pluto opposition of the FRB chart (December 23, 6:02 PM, Washington, DC, source: New York Times via Matt Carnicelli of the ISAR Financial Yahoo groups). Or they could continue the “Keynesian Bus” path of Jupiter-Uranus conjunction in early Aries, (“Chic Stimulus”), which is in T-square also (from the other side) to the Fed Sun-Pluto opposition. This path will encourage greater spending and debt with the hope (again) that this time it will really result in reducing the national deficit. Go figure how spending more money has - or will - reduce the deficit in this phase of the economic cycle.
If the Fed and Government want to be truly serious about getting people back to work, why not take Mark Leibovit’s idea (www.VRTrader.com) and make those 0-.25% loans available to credit-worthy businesses who really need the money and can hire people to make the economy grow again, rather than solely to “banksters” that are members of the Fed and hoard the money? Do you know anyone who can really borrow money at the much publicized rate of 0- .25%? Do you know any banks that will lend that money - that is only available to them at this rate – for anything less than 8%? If they lend it at all? For why should they take the risk of loaning it out at even 8% to credit worthy businesses, when they can simply turn around and buy 4% U.S. Treasuries with absolutely no risk and at the guarantee of the U.S. Government? Or are they missing something? I don’t know what it is, but I think they are missing something. When Jupiter and Uranus square your Sun (as it is doing in the Fed chart) you tend to over-estimate and make decisions that could lead to losses. When it squares your Pluto (as it is doing in the Fed chart), there is a tendency to increase your debt when you should be paring down your liabilities.
I am not sure what the results will be from these decisions of the past three weeks, and especially last Tuesday. But as a Financial Astrologer, it seems clear that this government and this central bank are still following the ghost of John Maynard Keynes, and going the route of Jupiter and Uranus in Aries. They are pushing the pedal to the metal as they rev up the depleted engine of a deteriorating economy for one last run. As Wednesday’s Wall Street Journal writes (taking a lead from our columns of the last few weeks perhaps), “Yesterday the Fed decided it won’t shrink its balance sheet, which would have resulted in monetary policy moving from 200 miles per hour to 190 or so. Instead the Fed will stay at full throttle, reinvesting the proceeds from expiring mortgage-backed securities on its balance sheet into direct purchases of long-term treasury securities.” They are not even going to continue supporting the weakest part of the economy, the housing sector. They are supporting banks (themselves included). But it’s getting dark outside and the lights on this race car of monetary policy are about to go out. It’s another "double or nothing" gamble and it may very well indeed lead Treasuries into “Double Bubble Trouble.” It is only a matter of time before we hear, “What the ____ do I do now?”
http://www.mmacycles.com/weekly-preview/mma-comments-for-the-week/mma-comments-for-the-week-beginning-august-16,-2010/
Dreadful Market Perceptions
Bob Chapman
August 14 2010:
A weekly excerpt from the subscription issue of The International Forecaster, taken from Bob Chapman's weekly publication.
Dollar dumped and bad decisions, pour in money or impose austerity, more subprime and eurozone crises on their way, insiders killed by the truth, economists urge action against unemployment, Wells Fargo overdraft charges slammed in class action
As we explained in the last issue that when GDP figures are again revised we would find 2nd quarter GDP growth was really 1.3% to 1.5%, not 2.4% revised down from 3.7%. This experience points out the really bogus nature of government statistics. Several months ago we projected that without QE the economy in the 3rd quarter would result in 1% growth and minus 1% in the 4th quarter. Insiders on wall Street knew months ago that we’d get QE, which was announced on Wednesday by the FOMC and that is why they projected GDP growth for the 2nd half of 1-1/2%. We project zero to 1%. Even with a $5 trillion injection over the next two years by the Fed, we can only project 1-1/2% growth accompanied by 14% plus inflation. If you own gold and silver you will be happy. Such stimulus eventually fails and burns out, markets fall and interest rates rise.
What most professionals can’t understand is why the dollar is being dumped. It is not because it is mired in debt and bankrupt. It is not because other nations will lose 2/3’s of 60% of their foreign reserves. It is because those in power behind the scenes want world government and a global central bank based on the use of the SDR, special Drawing Right, or the bancor. This would end up with a loss of sovereignty for all nations, plus no individual monetary or fiscal policies. All decisions would be in the hands of some one-world Illuminist bureaucrat. You would be abandoning the world’s fiat currencies, excepting the euro, which is partially gold backed, for another fiat currency such as the SDR, or the bancor. How can that present an improvement? Look at the mess that bureaucrats have made of the euro zone and the EU. Look at how the European elitists had to get a constitution passed and then it wasn’t even a constitution. It was some kind of agreement to subjugate Europeans -an agreement that most of the inhabitants of Europe voted against.
If the SDR or the bancor becomes a world currency the decisions, not only financial, monetary and fiscal, will be made in some foreign country, perhaps in Brussels, NYC or London. Decisions that will affect everything you do. Those policies will control every facet of your life. You will become controlled and enslaved.
The attempted changes could come next yr or in 2 or 3 years, but they are coming, if you allow them to come.
You ask what will work if the dollar no longer is the world reserve currency? We see the best alternative in an index of G-50 currencies weighed by financial conditions in each country backed by somewhere between 15% and 25% in gold. Nothing less will work. Unfortunately, the people in charge behind the scenes will never allow that to happen again, because they cannot control such a gold backed currency. Fractional banking would be limited to nine times deposits or less. That means no massive speculation on inside information. They will no longer be able to screw the public and create bubbles and busts on a whim. This is what these creatures are up too. Do not underestimate them, they will do everything they can to have a world currency and you will pay for it dearly.
Now that the turmoil in European markets has stabilized, at least temporally, the infighting continues on as to whether the Federal Reserve should pour another $5 trillion into the economy, or whether the US should begin an austerity program similar to what is being executed in the UK and Europe. Even with all the bogus numbers, Europe only has unemployment of 12% to 14%, whereas the US has 21-3/8%. Without such stimulus the US economy would collapse into a state of affairs far worse than experienced in the 1930s. Although no matter what the Fed does to stimulate ultimately the US and the world are facing deflationary depression. The administration and Messrs. Summers, Greenspan and Rubin believe the deflationary depressions should begin now. Others want another broad stimulus until they see the best opportunity to plunge the system into that deflationary depression. We believe the latter want to get a worldwide war underway, so they can cover up what they have been up too for the last many years. If such a war is in progress the dislocations caused by such a conflict can be used to explain the economic and financial failure. How this dilemma behind the scenes can be solved we can’t venture a guess, but the verbal conflict is well underway. One thing is for certain we will soon know which way they are going to precede. All present outward moves lead us to believe that massive liquidity will be introduced, but then again we are not on the inside, so we have to back into our conclusions. Do not forget sovereign and other debt issues have not gone away; they have simply been temporarily painted over. Anyone who contends that the problems of Greece, Portugal, Spain, Ireland and Italy are behind them is foolish. Look at the other side of the problem. The banks that bought the bonds of these unfortunate nations from money they created out of thin air and the nations such as Germany and France that are on the hook for trillions of dollars of unpayable debt. No the problems have not disappeared with a $1 trillion commitment. Thus, the euro zone and the EU stumble on having at least for now, accepted austerity and higher taxes – a sure formula for deflationary depression.
Here we are three years later back to square one. Now we not only have a new subprime crisis on the way due to the actions of government via Fannie, Freddie, Ginnie and FHA, but we still have the euro zone crisis to contend with. The financial environment is still one of Ponzi finance; little has changed. Let us say emphatically that neither crisis is over and behind us.
This time around expectations are the same. The Fed will come to the rescue as the Dow slides toward 9686 again, something that cannot be tolerated. A lower market would spark a loss of confidence again, as well as a fall in value of assets.
This time we do not have the luxury of cutting interest rates, which are currently near zero. That leaves the Fed with only one weapon; flooding the economy with money and credit, known as quantitative easing. The alternative is deflationary depression, as advocated by Obama, Summers, Greenspan and Rubin, etc. the Trilaterals, Council on Foreign Relations and Bilderbergers are arguing as to which road to take. If they take the low road they had best get there next war going post-haste.
We also see former Fed Chairman Sir Alan Greenspan has jumped aboard the low road bandwagon stating that the Bush tax cuts should be eliminated. This strikes another blow for the deflationists. If he and the others, who agree with him, hold forth they had best plan for a much lower stock market and a continued flight to gold and silver, as the only real safe havens in all this terrible tumult.
Worse yet, everything the administration has done has been disastrous. They do not even want to talk about their successes because the public lowers their ratings almost every day. A financial regulations bill that makes the privately owned Federal Reserve a financial monopoly and dictatorial power. This is all bad, but do not forget he doesn’t make the decisions. They are made by the CFR-types behind the scenes that are running scared. Half want stimulus and the other half want depression. This is a mess, but it was predicable. Talk radio, the Internet and a handful of newspapers, magazines and newsletters have been raising havoc with elitist plans. The public is learning the truth and it is killing the insiders. That is why you are seeing vicious attacks on anyone that is effective, such as many attacks on radio programs that we appear on. Desperate people do desperate things and that is the vise that the shadow government is in presently. If you had any doubts why are gold and silver and commodities rising and the dollar falling? It is because the stimulus program was a failure and the geniuses behind the scenes do not know what to do. It’s inflate or die. If these one-worlders lose they lose everything just as they did when the Lombard system collapsed in 1348. This is where this is all headed and they are terrified and they should be.
Perceptions of the market are dreadful. 72% of the volume is front running, which happens to be illegal, known as black box trades. The public has been a major share seller for the last year and one-half. Why is the market rising again? It is called, “The President’s Working Group on Financial Markets,” which works 24/7 manipulating markets worldwide to serve the goals of those who want world government, a world currency and a world bank.
These people learned nothing from the first three years of the credit crisis except how to bail out the financial system, which is still broke. They still do not get it. It is the economy and jobs and the federal government’s desire to peer into everyone’s lives and control them. The vote in the November elections will be devastating for the criminals behind the scenes. They will have to find a way to buy all those new politicians and many won’t be for sale, because they want to be reelected.
Very few have faith in our federal government and less in global government. The politicians and their handlers have few options. The majority of people worldwide are unhappy with their governments and if they do not shape up they’ll be shipped out one way or another. They have found stimulus does not equal stability and they want answers and there are none to be had. These facts will all lead to destabilization and the public realizes it. The bankers and the Illuminists are being found out and their policies are not working. The public only has so much patience as we learned from the French in 1789.
The world is on the edge of revolution; passive or violent. We won’t have to wait long, because the world public is seething and in that climate anything can happen.
The community Recovery and Enhancement Act has been introduced by Congresswomen Shelly Berkley to subsidize equity investment in commercial real estate assets. You get to pay for the banks losses.
Senators Pat Leahy, John Cornyn, Ted Kaufman and Charles Grassley and Rep. Darrell Issa in the House have introduced legislation that would delete from the Dodd-Frank Act, which gives the SEC power to not have to listen to FOIA requests.
A basket of 31 items was compared at a Wal-Mart Super Center, Kroger, Safeway, Harris Teeter and Whole Foods. The basket showed a 5.8% increase in average prices at Wal-Mart, the most significant jump in 1-1/2 years. Wal-Mart still holds a 10.4% lead vs. traditional supermarkets relative to 16% in June.
Congress approved a final spurt of spending Tuesday to bolster the sluggish recovery, sending on to the White House a $26 billion plan to save the jobs of thousands of teachers and other government workers. The measure, likely the last significant effort at economic stimulus until after the November elections, brings total federal spending on the economy to just over $1 trillion since the Great Recession began in late 2007. It passed the House 247 to 161, with most Republicans voting no.
A judge ordered Wells Fargo & Co. to stop manipulating debit-card transactions without consumers’ knowledge to increase revenue from overdraft fees while ruling the bank should pay about $203 million to customers because of the practice.
U.S. District Judge William Alsup in San Francisco sided with three customers who sued in 2007 on behalf of thousands of Californians charged overdraft fees. In a ruling yesterday, he agreed that the practice was unfair, deceptive and fraudulent.
In 2001, Wells Fargo, the largest U.S. home lender, changed the way it treated daily debit transactions and cash withdrawals so that transactions with the highest dollar amount posted first, rather than in the order they occurred, according to the complaint. The practice, allegedly intended to boost revenue from overdraft fees, led to customers overdrawing accounts by small amounts multiple times a day, according to the complaint.
Customers don’t “reasonably expect that they will have to pay up to 10 overdraft fees when only one would ordinarily be incurred,” Alsup wrote, deciding the case without a jury. The multiple fees are “so pernicious,” he said, that they should be allowed only if customers expected them and in this case “the proof is the opposite.”
Wells Fargo “went to great lengths to bury the words deep in a lengthy fine-print document and the words selected were too vague to warn depositors, as even the bank’s own expert conceded,” Alsup wrote. [This is premediated criminal fraud. No charges were brought and interestingly the bank was not fined on a civil basis for deliberately defrauding its customers.]
The Federal Reserve reversed plans to exit from aggressive monetary stimulus and decided to keep its bond holdings level to support an economic recovery it described as weaker than anticipated.
Central bankers meeting yesterday adopted a $2.05 trillion floor for their securities portfolio, pivoting toward a quantitative target for monetary policy. Treasuries surged and stocks pared losses as some investors judged the decision opened the door to a resumption of large-scale asset purchases. [We had predicted $2.5 trillion for each of the next two years in QE, and we will probably get something close to that. The big question is when will WWIII start.]
President Obama approved a final spurt of spending Tuesday to shore up the sluggish recovery, signing into law a $26 billion plan to save the jobs of thousands of teachers and other government workers. The measure brings total direct federal spending on the economy to nearly $1.2 trillion since the nation descended into recession in late 2007.
With economic growth faltering and unemployment stuck at 9.5 percent, some economists are urging additional action. But senior Democrats and administration officials said the package of state aid is likely to be the last major effort at economic stimulus -- at least until after November congressional elections, for which the soaring national debt has become a major issue.
House Speaker Nancy Pelosi (D-Calif.), determined to demonstrate a commitment to fighting job losses, summoned lawmakers back from their August vacation for an unusual one-day session to vote on the package. Democrats argued that it would preserve the jobs of more than 300,000 workers by helping state governors plug their own budget holes.
The trade deficit widened a surprising 18.8 percent in June on a surge of consumer goods from China and other suppliers, suggesting second-quarter economic growth was much weaker than previously thought.
The monthly trade gap totaled $49.9 billion, the highest since October 2008, the Commerce Department reported on Wednesday, as U.S. exports stumbled a bit.
The deficit was wider than any of the 67 Wall Street forecasts collected before the report, and is likely to prompt analysts to ratchet down estimates of second-quarter gross domestic product growth.
"The strength in imports, though hinting at some pickup in consumer spending, continues to undermine GDP growth. Moreover, the slowing in exports will only fan fears of a faltering U.S. recovery," said Sal Guatieri, senior economist at BMO Capital Markets.
Many economists have already trimmed their estimates on signs business inventories had risen more slowly than the government first thought. In its first estimate of GDP growth late last month, the Commerce Department had said the economy grew at a 2.4 percent annual rate in the April to June period.
U.S. imports of goods and services grew 3 percent in June to $200.3 billion, the highest since October 2008, in a show of strengthening domestic demand. Imports of consumer goods hit a record $43.1 billion and imports of non-petroleum goods were the highest since August 2008. Imports from China soared to $32.9 billion, the highest since October 2008.
The closely watched U.S. trade deficit with the East Asian manufacturer widened to $26.2 billion, also the highest since October 2008, while U.S. exports to China fell slightly.
The big jump in the U.S. trade deficit follows Chinese government data on Tuesday that showed China's trade surplus surged to $28.7 billion in July, an 18-month high.
The trade data had little impact on U.S. financial markets. U.S. stock index futures were lower on Wednesday as weak Chinese manufacturing data and a gloomier U.S. economic outlook from the Federal Reserve led to mounting concerns about the health of the global economy.
The dollar hit a 15-year low against the yen.
The trade data is likely to intensify calls in the U.S. Congress for China to move more aggressively to raise the value of its currency against the dollar.
China loosened the yuan from a nearly two-year peg to the dollar in June, but it has barely risen since then. Many lawmakers believe it is undervalued by at least 25 percent.
U.S. imports from Germany and the 27-nation European Union also had their best showing since October 2008.
Overall U.S. exports fell 1.3 percent in June to $150.5 billion, the biggest month-to-month drop since April 2009.
U.S. automotive exports were the highest since October 2008, but other important categories like capital goods, industrial supplies and materials and food, feeds and beverages posted declines.
A second report showed U.S. home loan demand climbed last week but record low mortgage rates failed to light a fire in a market constrained by unemployment and tight lending practices.
Mortgage purchase and refinancing applications rose less than 1 percent in the first week of August, even as 30-year loan rates fell to 4.57 percent, the lowest in 20 years of record keeping by the Mortgage Bankers Association.
http://www.theinternationalforecaster.com/International_Forecaster_Weekly/Dreadful_Market_Perceptions
Hidden inflation takes a bow...
I have decided that an OT is allowed as long as it is the beginning of the post. This way nobody gets alienated. Besides that it is difficult to separate the economy and/or politics being as the two are related in many aspects of the economy as a whole.
If you see an OT, then skip the post. No harm, no foul... I am guilty of posting OT stuff, but not necessarily politics, but other topics and I never used an OT as I should have. So I need to lead by example.
Now as for the post to which you are speaking of and I am replying to, we are discussing unemployment and why anyone would go and find a job if they are getting paid to do nothing. I am not sure how that is considered a political post.
Bottom Line: As long as the majority of posts are related to the economy, market trends, cycles, etc. I will let it go especially if the OT rule is followed. If this turns out to be a bad idea and the OT rule is disrespected, then I will bring order and crack down on those posts.
I know I cannot keep everyone happy, but I am certainly going to try.
PS- If you can show me where trickle down has EVER worked, I am all ears, you know, the clueless one.. LOL
Would make a double bottom off of Mar'09 correction.
A lot of bearish flag/pennant set-ups out there...
The Hindenburg Omen: Analysis of HO’s from the Chart Addict (24 Charts)
John Lee
August 14th, 2010
http://chartsgonewild.com/2010/08/14/the-hindenburg-omen-analysis-of-hos-from-the-chart-addict-24-charts/
A Three-Year Look at Commodities: Digesting the Markdown Phase (21 Charts)
Posted by: John Lee
August 15th, 2010 at 11:42 am
http://chartsgonewild.com/2010/08/15/a-three-year-look-at-commodities-digesting-the-markdown-phase-21-charts/
You know what, it was not working earlier and when I went back to skip that portion of info, there it was. Now it is gone again. Not sure why, but here is the link:
http://chartmechanic.com/chart.jsp?c=demo/NYSE%20Margin%20Debt.chart
That's what happens when you get money for nothing, a lot like the wealthy.
Give 'em tax breaks and tax cuts, etc., they have no incentive to give back. This is why trickle down does not work.
•• International Indices Aug 15th ••
]
•• Economic Data for the Week Ahead ••
This Coming Weeks Economic #'s
http://biz.yahoo.com/c/ec/201033.html
Last Weeks Economic Results
http://biz.yahoo.com/c/ec/201032.html
•• Earnings Calendar for the Week Ahead ••
B = Before-Market Hours
D = During-Market Hours
A = After-Market Hours
EARNINGS CALENDAR - REPORTS TO BE ANNOUNCED WEEK OF AUG 15 – AUG 21
Company Symbol Date Time Eps PrevYr
3sbio Inc SSRX 08/15 D 0.17 0.18
Blue Dolphin Energy Co BDCOD 08/15 D n/a -0.06
Laxai Pharma Ltd LAXAE 08/15 D n/a n/a
Waytronx Inc WYNX 08/15 D n/a n/a
China Auto Logistics In CALI 08/16 B 0.09 n/a
China Med Technologies CMED 08/16 B 0.55 0.42
China Wind Systems Inc CWS 08/16 B 0.10 n/a
Emira Property Fund EMI.J 08/16 B n/a n/a
Emisphere Technologies EMIS 08/16 B n/a -0.12
Entech Solar Inc ENSL 08/16 B n/a -0.02
First Marblehead Corp FMD 08/16 B -0.10 -0.36
Fuqi International Inc FUQI 08/16 B 0.45 0.45
Gulf Fin Hse B S C GFH.L 08/16 B n/a n/a
Jinkosolar Hldg Co Ltd JKS 08/16 B 0.58 n/a
Lowes Cos Inc LOW 08/16 B 0.54 0.64
Sinovac Biotech Ltd SVA 08/16 B 0.01 0.14
Six Flags Entmt Corp Ne SIXFQ 08/16 B n/a -1.25
Terra Nova Rty Corp TTT 08/16 B 0.04 -0.25
Thaicom Public Company SHSTY 08/16 B n/a n/a
Tim Hellas Telecomm S A WINDH 08/16 B n/a n/a
Us Dataworks Inc UDWK 08/16 B n/a n/a
Viewcast Com Inc VCST 08/16 B n/a -0.04
Xenonics Hldgs Inc XNN 08/16 B 0.01 -0.01
Achillion Pharmaceutica ACHN 08/16 D -0.18 -0.23
Acme Communication Inc ACME 08/16 D n/a -0.07
Advanced Photonix Inc API 08/16 D -0.02 -0.01
Aeolus Pharmaceuticals AOLS 08/16 D -0.01 -0.01
Affirmative Ins Hldgs I AFFM 08/16 D n/a -0.58
American Oil & Gas Inc AEZ 08/16 D 0.00 -0.03
American Rlty Invs Inc ARL 08/16 D n/a n/a
American Spectrum Realt AQQ 08/16 D n/a n/a
Ark Restaurants Corp ARKR 08/16 D 0.67 0.46
Aryx Therapeutics Inc ARYX 08/16 D -0.10 -0.34
Atrinsic Inc ATRN 08/16 D n/a -0.10
Best Energy Services In BEYSE 08/16 D n/a -0.20
Biglari Hldgs Inc BH 08/16 D 3.80 2.20
Biomedical Tech S Hldgs BMTLE 08/16 D n/a n/a
Bitstream Inc BITS 08/16 D n/a n/a
Books-A-Million Inc BAMM 08/16 D n/a 0.10
Bp Prudhoe Bay Rty Tr BPT 08/16 D n/a 0.99
Carver Bancorp Inc CARV 08/16 D n/a 0.18
Cascade Bancorp CACB 08/16 D -0.03 -1.00
Cato Corp New CATO 08/16 D 0.54 0.41
Cdc Software Corp CDCS 08/16 D 0.23 0.33
Cel-Sci Corp CVM 08/16 D n/a -0.05
Cellcom Israel Ltd CEL 08/16 D 0.72 0.69
China Architectural Eng CAEI 08/16 D n/a 0.05
China Clean Energy Inc CCGY 08/16 D n/a 0.00
China Crescent Enterpri CCTR 08/16 D n/a 0.07
China Ritar Power Corp CRTP 08/16 D 0.12 0.09
Cintel Corp CNCNE 08/16 D n/a n/a
Ckx Inc CKXE 08/16 D 0.12 0.05
Clark Hldgs Inc GLA 08/16 D n/a n/a
Comstock Homebuilding C CHCI 08/16 D n/a -1.58
Consumer Portfolio Svcs CPSS 08/16 D -0.16 -0.32
Cpi Corp CPY 08/16 D -0.28 -0.53
Cycle Ctry Accessories ATC 08/16 D n/a -1.04
Dac Technologies Grp In DAAT 08/16 D n/a 0.02
Decorator Inds Inc DII 08/16 D n/a -0.12
Dialysis Corp Amer DCAI 08/16 D 0.09 0.07
Digital Ally Inc DGLY 08/16 D 0.04 -0.01
Digital Pwr Corp DPW 08/16 D n/a -0.02
Diguang Intl Dev Co Ltd DGNG 08/16 D n/a -0.08
Ditech Networks Inc DITC 08/16 D n/a -0.14
Drinks Americas Hldgs L DKAM 08/16 D n/a -0.02
Echo Therapeutics Inc ECTE 08/16 D -0.08 -0.46
Electro-Sensors Inc ELSE 08/16 D n/a 0.00
Elite Pharmaceuticals I ELTP 08/16 D n/a -0.12
Elong Inc LONG 08/16 D 0.03 0.06
Emerson Radio Corp MSN 08/16 D 0.05 0.04
Entremed Inc ENMDD 08/16 D 0.00 -0.04
First Pactrust Bancorp FPTB 08/16 D 0.09 0.10
Footstar Inc FTAR 08/16 D n/a n/a
Gas Nat Inc EGAS 08/16 D n/a 0.18
Gateway Energy Corp GNRG 08/16 D n/a 0.01
Gencor Inds Inc GENC 08/16 D n/a -0.08
General Employment Ente JOB 08/16 D n/a -0.44
Genetronics Biomedical GEB 08/16 D -0.02 -0.19
Geopetro Resources Co GPR 08/16 D n/a -0.05
Global Med Technologies GLOB 08/16 D n/a n/a
Goldfield Corp GV 08/16 D n/a -0.04
Great Amern Group Inc GAMR 08/16 D -0.05 n/a
Greenhunter Energy Inc GRH 08/16 D n/a 0.13
Gulf Resources Inc GFRE 08/16 D 0.34 0.28
Hallwood Group Inc HWG 08/16 D 3.22 2.34
Harbor Biosciences Inc HRBR 08/16 D n/a -0.14
Harrington West Finl Gr HWFG 08/16 D n/a -2.16
Hastings Entmt Inc HAST 08/16 D 0.06 0.06
Hauppauge Digital Inc HAUP 08/16 D n/a -0.19
Hudson Hldg Corp HDHL 08/16 D n/a n/a
Hurray Hldgs Co Ltd HRAY 08/16 D n/a -0.22
Ico Global Comm Hldgs L ICOG 08/16 D n/a 1.23
Identive Group Inc INVE 08/16 D -0.05 -0.03
Immunocellular Therapeu IMUC 08/16 D n/a n/a
India Globalization Cap IGC 08/16 D n/a n/a
Infosmart Group Inc IFSGE 08/16 D n/a n/a
Infosonics Corp IFON 08/16 D n/a 0.03
Integral Vision Inc INVI 08/16 D n/a -0.03
Ir Biosciences Hldgs In IRBS 08/16 D n/a n/a
Kit Digital Inc KDGL 08/16 D 0.01 -0.11
Lattice Inc LTTC 08/16 D n/a -0.01
Law Enforcement Assocs LAWE 08/16 D n/a 0.03
Lifeway Foods Inc LWAY 08/16 D 0.11 0.15
Lsb Finl Corp LSBI 08/16 D n/a 0.20
Lsi Inds Inc LYTS 08/16 D 0.03 0.00
Matrix Svc Co MTRX 08/16 D 0.13 0.26
Medicinova Inc MNOV 08/16 D -0.39 -0.39
Mercantile Bancorp Inc MBR 08/16 D -0.38 -5.98
Mines Mgmt Inc MGN 08/16 D -0.12 -0.08
Mitek Sys Inc MITK 08/16 D 0.00 -0.01
Nautilus Inc NLS 08/16 D -0.10 -0.22
Nco Group Inc NCOG 08/16 D n/a n/a
New Oriental Energy & C NOEC 08/16 D n/a -0.25
Nile Therapeutics Inc NLTX 08/16 D -0.07 -0.10
Novelos Therapeutics In NVLT 08/16 D -0.03 -0.13
Nutra Pharma Corp NPHC 08/16 D n/a n/a
Ohio Legacy Corp OLCB 08/16 D n/a n/a
Optibase Ltd OBAS 08/16 D n/a -0.06
Oramed Pharm Inc ORMP 08/16 D n/a n/a
Orbit / Fr Inc ORFR 08/16 D n/a -0.12
Orsus Xelent Technologi ORS 08/16 D n/a n/a
Oscient Pharmaceuticals OSCID 08/16 D n/a -1.53
Parkway Bk Lenoir North PKWY 08/16 D n/a n/a
Pinnacle Gas Resources PINN 08/16 D n/a -0.30
Pressure Biosciences In PBIO 08/16 D -0.37 -0.39
Prospect Medical Holdin PZZ 08/16 D n/a -0.01
Proxim Wireless Corp PRXM 08/16 D n/a -0.03
Puda Coal Inc PUDA 08/16 D 0.24 0.11
Pyramid Oil Co PDO 08/16 D n/a -0.01
Radient Pharmaceuticals ADL 08/16 D n/a -0.51
Ricks Cabaret Intl Inc RICK 08/16 D 0.20 0.20
Royal Std Minerals Inc RYSMF 08/16 D n/a n/a
Rue21 Inc RUE 08/16 D n/a n/a
Saker Aviation Svcs Inc SKAS 08/16 D n/a n/a
Sanfilippo John B & Son JBSS 08/16 D n/a 0.37
Singing Mach Inc SMD 08/16 D n/a n/a
Sino Gas Intl Hldgs Inc SGAS 08/16 D n/a n/a
Sky Petroleum Inc SKPIE 08/16 D n/a 0.00
Skystar Bio-Pharma Co SKBID 08/16 D 0.29 -0.06
Soligenix Inc SNGX 08/16 D -0.01 -0.01
Star Scientific Inc CIGX 08/16 D -0.04 -0.07
Station Casinos Inc STN 08/16 D n/a n/a
Superior Bancorp SUPRD 08/16 D -0.39 -0.49
Switch & Data Facilitie SDXC 08/16 D 0.06 0.05
Sysco Corp SYY 08/16 D 0.58 0.53
Tapimmune Inc TPIV 08/16 D n/a n/a
Teamstaff Inc TSTFD 08/16 D n/a -0.11
Tegal Corp TGALD 08/16 D n/a -0.31
Tel Instr Electrs Corp TIK 08/16 D n/a n/a
Telkonet Inc TKOI 08/16 D n/a 0.01
Tengasco Inc TGC 08/16 D 0.02 0.00
Tigrent Inc TIGE 08/16 D n/a n/a
Tofutti Brands Inc TOF 08/16 D n/a 0.02
Tootie Pie Company Inc TOOT 08/16 D n/a n/a
Transcontinental Rlty I TCI 08/16 D n/a -3.99
Trimedyne Inc TMEDE 08/16 D n/a n/a
Trubion Pharmaceuticals TRBN 08/16 D -0.34 -0.37
Valspar Corp VAL 08/16 D 0.71 0.67
Vitacost Com Inc VITC 08/16 D 0.07 0.15
Vocaltec Communications VOCLD 08/16 D n/a -0.17
Vringo Inc VRNG 08/16 D n/a n/a
Wuhan General Grp China WUHN 08/16 D n/a -0.01
Yuhe International Inc YUII 08/16 D 0.18 n/a
Abraxas Pete Corp AXAS 08/16 A 0.01 0.07
Agilent Technologies In A 08/16 A 0.48 0.15
Beacon Enterprise Solns BEAC 08/16 A n/a n/a
China Southn Airls Ltd ZNH 08/16 A n/a n/a
Cumberland Pharmaceutic CPIX 08/16 A 0.03 0.02
Cytomedix Inc GTF 08/16 A -0.03 -0.03
Deerfield Capital Corp DFR 08/16 A n/a n/a
Ediets Com Inc DIET 08/16 A -0.05 -0.10
Emcore Corp EMKR 08/16 A n/a -0.09
Emrise Corp ERI 08/16 A n/a -0.05
Fuwei Films Hldgs Co Lt FFHL 08/16 A n/a -0.08
Globaloptions Group Inc GOPG 08/16 A n/a -0.06
Hollywood Media Corp HOLL 08/16 A n/a -0.16
Icx Technologies Inc ICXT 08/16 A -0.01 -0.04
Interoil Corp IOC 08/16 A 0.10 0.24
Lgl Group Inc LGL 08/16 A 0.48 -0.43
Northern Dynasty Minera NAK 08/16 A n/a n/a
Onstream Media Corp ONSMD 08/16 A n/a -0.02
Pacific Ethanol Inc PEIX 08/16 A -0.12 -0.49
Perfect World Co Ltd PWRD 08/16 A 0.69 0.72
Pernix Therapeutics Hld PTX 08/16 A n/a n/a
Primus Telecommunicatio PMUG 08/16 A n/a n/a
Rino International Corp RINO 08/16 A 0.42 n/a
Solar Pwr Inc SOPWE 08/16 A -0.04 -0.04
Subaye Inc SBAY 08/16 A n/a n/a
Urban Outfitters Inc URBN 08/16 A 0.39 0.29
Widepoint Corp WYY 08/16 A 0.01 0.00
Abercrombie & Fitch Co ANF 08/17 B -0.07 0.87
Biolase Technology Inc BLTI 08/17 B -0.01 0.10
Cewe Color Hldg Ag CWC.F 08/17 B n/a n/a
G & K Svcs Inc GKSR 08/17 B 0.32 0.27
Greenman Technologies I GMTIE 08/17 B n/a -0.02
Masterflex Ag Gelsenkir MZX.F 08/17 B n/a n/a
Nxp Semiconductors N V NXPI 08/17 B n/a n/a
Saks Inc SKS 08/17 B -0.52 -0.22
Spectrum Brands Hldgs I SPB 08/17 B 0.45 -0.67
Tjx Cos Inc New TJX 08/17 B 0.73 0.61
Vanceinfo Technologies VIT 08/17 B 0.19 0.13
Aastrom Biosciences Inc ASTMD 08/17 D -0.15 -0.03
Ace Marketing & Promoti AMKT 08/17 D n/a n/a
American Electric Tech AETI 08/17 D n/a -0.04
American Mtl & Tech Inc AMGY 08/17 D n/a n/a
Aristotle Corp ARTL 08/17 D 0.04 -0.67
Bancroft Fund Ltd BCV 08/17 D n/a n/a
Bluephoenix Solutions L BPHX 08/17 D 0.00 0.06
Callisto Pharmaceutical CLSP 08/17 D n/a -0.35
Champion Inds Inc W Va CHMP 08/17 D 0.02 0.00
China Metro-Rural Hldgs MHJ 08/17 D n/a n/a
China Recycling Energy CREG 08/17 D 0.01 n/a
China Techfaith Wirls C CNTF 08/17 D n/a 0.10
Chromcraft Revington In CRC 08/17 D n/a -0.53
Clean Diesel Technologi CDTI 08/17 D n/a -0.13
Corpbanca BCA 08/17 D n/a 0.88
Crystal Riv Cap Inc CYRV 08/17 D n/a -0.26
Daxor Corp DXR 08/17 D n/a 1.46
Eclips Media Technologi EEMT 08/17 D n/a n/a
Ecotality Inc ECTY 08/17 D -0.27 -0.02
Elbit Sys Ltd ESLT 08/17 D 1.05 1.39
Hmg Courtland Pptys Inc HMG 08/17 D n/a n/a
Home Depot Inc HD 08/17 D 0.59 0.71
Hometown Bancorp Inc N HTWC 08/17 D n/a 0.03
Igi Labs Inc IG 08/17 D n/a n/a
Image Metrics Inc IMGX 08/17 D n/a n/a
Infologix Inc IFLGD 08/17 D n/a -0.19
Innotrac Corp INOC 08/17 D n/a 0.15
Inventiv Health Inc VTIV 08/17 D 0.35 0.34
Ivax Diagnostics Inc IVD 08/17 D n/a -0.05
Jesup & Lamont Inc JLI 08/17 D n/a 0.01
Lotus Pharm Inc LTUS 08/17 D n/a 0.10
Mace Sec Intl Inc MACE 08/17 D n/a -0.21
Manhattan Bancorp MNHN 08/17 D n/a n/a
Oak Ridge Finl Svcs Inc BKOR 08/17 D n/a 0.04
Orchard Enterprises Inc ORCD 08/17 D n/a -0.18
Pet Drx Corporation VETS 08/17 D n/a n/a
Pinnacle Bank Gilroy Ca PBNK 08/17 D n/a n/a
Pointer Telocation Ltd PNTR 08/17 D n/a -0.61
Positiveid Corp PSID 08/17 D n/a n/a
Provectus Pharmaceutica PVCT 08/17 D -0.05 -0.07
Ready Mix Inc RMX 08/17 D n/a -0.47
Red Point Bio Corp RPBC 08/17 D -0.02 -0.03
Riskmetrics Group Inc RISK 08/17 D 0.12 0.11
Southern Tr Secs Hldg C SOHL 08/17 D n/a n/a
Spanish Broadcasting Sy SBSA 08/17 D n/a -0.03
Spuetz Ag Duesseldorf SPZ.F 08/17 D n/a n/a
St Bernard Software Inc SBSW 08/17 D n/a n/a
Stratus Pptys Inc STRS 08/17 D -0.04 -0.19
Sypris Solutions Inc SYPR 08/17 D -0.08 -0.37
Terrestar Corp TSTR 08/17 D n/a -0.44
Txco Res Inc TXCOQ 08/17 D n/a -0.51
Uluru Inc ULU 08/17 D n/a -0.04
Viasystems Group Inc VIAS 08/17 D -0.04 -0.48
Wal Mart Stores Inc WMT 08/17 D 0.96 0.88
Westwood One Inc WWON 08/17 D n/a n/a
Wsp Holdings Limited WH 08/17 D -0.10 0.10
Zoom Technologies Inc D ZOOMD 08/17 D 0.27 -0.14
Analog Devices Inc ADI 08/17 A 0.60 0.22
Astro-Med Inc New ALOT 08/17 A n/a 0.08
Bob Evans Farms Inc BOBE 08/17 A 0.46 0.52
Caci Intl Inc CACI 08/17 A 0.93 0.95
China Digital Tv Hldg C CHRI 08/17 A 0.10 0.12
Gravity Co Ltd GRVY 08/17 A n/a n/a
Henry Jack & Assoc Inc JKHY 08/17 A 0.35 0.33
Jamba Inc JMBA 08/17 A 0.07 -0.10
Key Tronics Corp KTCC 08/17 A n/a 0.03
La Z Boy Inc LZB 08/17 A 0.11 0.04
Longtop Finl Technologi LFT 08/17 A 0.28 0.20
Photronics Inc PLAB 08/17 A 0.09 -0.13
Silicon Graphics Intl C RACK 08/17 A -0.27 n/a
Bjs Wholesale Club Inc BJ 08/18 B 0.62 0.58
Chicos Fas Inc CHS 08/18 B 0.10 0.04
Citi Trends Inc CTRN 08/18 B 0.05 0.20
Citigroup Fdg Inc MTY 08/18 B n/a n/a
Concord Med Svcs Hldgs CCM 08/18 B 0.09 n/a
Duoyuan Global Wtr Inc DGW 08/18 B 0.36 0.63
Eaton Vance Corp EV 08/18 B 0.39 0.26
Gushan Environmental En GU 08/18 B -0.10 -0.20
Afc Enterprises Inc AFCE 08/18 D 0.19 0.18
Baader Wertpapierhandel BWB.F 08/18 D n/a n/a
Baldwin Technology Inc BLD 08/18 D 0.07 0.02
Bioanalytical Sys Inc BASI 08/18 D n/a -0.13
Brooklyn Federal Bancor BFSB 08/18 D 0.11 0.15
Centerline Holdings Co CLNH 08/18 D n/a -1.11
China Shenghuo Pharm Hl KUN 08/18 D n/a n/a
Community Bankers Tr Co BTC 08/18 D n/a n/a
Deere & Co DE 08/18 D 1.21 0.99
Duane Reade Inc DRD 08/18 D n/a n/a
Enable Hldgs Inc ENAB 08/18 D n/a n/a
Ezenia Inc EZEN 08/18 D n/a -0.07
First W Va Bancorp Inc FWV 08/18 D n/a 0.34
Fusion Telecomm Intl In FSN 08/18 D n/a n/a
Heart Tronics Inc SGN 08/18 D n/a n/a
Helicos Biosciences Cor HLCS 08/18 D n/a -0.10
Helios & Matheson North HMNA 08/18 D n/a -0.19
Ksw Inc KSW 08/18 D n/a 0.02
Lecroy Corp LCRY 08/18 D 0.15 0.01
Magal Security Sys Ltd MAGS 08/18 D n/a n/a
Maxxam Inc MXM 08/18 D n/a -2.74
Mayflower Bancorp Inc MFLR 08/18 D n/a 0.11
Network-1 Sec Solutions NSSI 08/18 D n/a n/a
Oragenics Inc ORNI 08/18 D n/a -0.02
Origin Agritech Limited SEED 08/18 D 0.65 0.47
Pab Bankshares Inc PABK 08/18 D n/a 0.04
Regenerx Biopharmaceuti RGN 08/18 D -0.02 -0.03
Retractable Technologie RVP 08/18 D -0.08 -0.13
Symbion Inc Del SMBI 08/18 D n/a n/a
Target Corp TGT 08/18 D 0.66 0.82
Tefron Ltd TFRFF 08/18 D n/a -2.20
Tiens Biotech Group Usa TBV 08/18 D 0.06 0.14
Valuevision Media Inc VVTV 08/18 D n/a -0.47
Virtual Radiologic Corp VRAD 08/18 D 0.21 0.21
Vyteris Inc VYTR 08/18 D n/a n/a
Applied Matls Inc AMAT 08/18 A 0.25 -0.03
Brocade Communications BRCDD 08/18 A 0.13 0.12
China Distance Ed Hldgs DL 08/18 A 0.04 0.00
Chinaedu Corp CEDU 08/18 A 0.08 0.09
Chipmos Tech Bermuda Lt IMOS 08/18 A n/a -0.45
Flexsteel Inds Inc FLXS 08/18 A 0.23 0.12
Gymboree Corp GYMB 08/18 A 0.39 0.27
Hot Topic Inc HOTT 08/18 A -0.08 -0.01
Limited Brands Inc LTD 08/18 A 0.16 0.27
Netapp Inc NTAP 08/18 A 0.45 0.22
Netease Com Inc NTES 08/18 A 0.58 0.53
Open Text Corp OTEX 08/18 A 0.86 0.73
Petsmart Inc PETM 08/18 A 0.29 0.30
Synopsys Inc SNPS 08/18 A 0.38 0.47
1 800 Flowers Com FLWS 08/19 B 0.01 -0.04
Acorn Intl Inc ATV 08/19 B 0.05 -0.07
Autochina International AUTC 08/19 B 0.56 n/a
Bon-Ton Stores Inc BONT 08/19 B -2.24 -1.29
Buckle Inc BKE 08/19 B 0.52 0.44
Casual Male Retail Grp CMRG 08/19 B 0.04 0.05
Childrens Pl Retail Sto PLCE 08/19 B -0.44 -0.03
Delta Apparel Inc DLA 08/19 B 0.61 0.47
Dicks Sporting Goods In DKS 08/19 B 0.31 0.39
Dollar Tree Inc DLTR 08/19 B 0.54 0.42
Global Sources Ltd GSOL 08/19 B 0.14 0.15
Lancaster Colony Corp LANC 08/19 B 0.98 1.01
Magnetek Inc MAG 08/19 B -0.01 0.02
New York & Co Inc NWY 08/19 B -0.08 0.14
Orascom Constr Inds S A OCIC 08/19 B n/a n/a
Ross Stores Inc ROST 08/19 B 0.82 0.54
School Specialty Inc SCHS 08/19 B 1.16 1.51
Sears Roebuck & Co S 08/19 B 0.35 0.19
Stage Stores Inc SSI 08/19 B 0.23 0.25
Stein Mart Inc SMRT 08/19 B -0.02 -0.19
Tech Data Corp TECD 08/19 B 0.78 0.70
Torm A/s TRMD 08/19 B n/a -0.50
Toro Co TTC 08/19 B 0.78 0.54
Towers Watson & Co WW 08/19 B 0.80 0.73
Trans World Entmt Corp TWMC 08/19 B -0.62 -0.62
Trencor TRE.J 08/19 B n/a n/a
Williams Sonoma Inc WSM 08/19 B -0.09 0.08
Xinhua Sports & Entmt L XSEL 08/19 B 0.03 0.01
Agfeed Industries Inc FEED 08/19 D 0.04 0.03
Alseres Pharmaceuticals ALSE 08/19 D n/a -0.11
American Community Banc ACBP 08/19 D n/a 0.00
Arrhythmia Resh Technol HRT 08/19 D n/a 0.03
Axion International Hol AXIH 08/19 D n/a n/a
Biolargo Inc BLGO 08/19 D n/a n/a
Blue Coat Systems Inc BCSI 08/19 D 0.37 0.23
Bodisen Biotech Inc BBCZ 08/19 D -0.02 0.04
Cato Corp New CATO 08/19 D 0.54 0.41
Creative Vistas Inc CVAS 08/19 D n/a -0.01
Dell Inc DELL 08/19 D 0.30 0.29
Etelos Inc ETLOE 08/19 D n/a n/a
Flowers Foods Inc FLO 08/19 D 0.35 0.33
Franklin Cr Hldg Corp FCMCE 08/19 D n/a n/a
Gamestop Corp New GME 08/19 D 0.28 0.34
Harris Interactive Inc HPOL 08/19 D n/a -0.01
Linkwell Corp LWLLE 08/19 D n/a n/a
Mentor Graphics Corp MENT 08/19 D -0.04 0.02
Navios Maritime Holding NM 08/19 D 0.18 0.12
Nephros Inc NEPH 08/19 D n/a -0.01
Novadel Pharma Inc NVD 08/19 D n/a -0.03
Pacific Webworks Inc PWEB 08/19 D n/a 0.00
Providence & Worcester PWX 08/19 D 0.03 0.07
Raptor Pharmaceutical C RPTPD 08/19 D n/a -0.04
Sag Solarstrom Ag Freob SAG.F 08/19 D n/a n/a
Shamir Optical Industry SHMR 08/19 D n/a 0.22
Southern Conn Bancorp I SSE 08/19 D n/a -0.10
Staples Inc SPLS 08/19 D 0.16 0.21
Trans Lux Corp TLX 08/19 D n/a -1.65
Z Trim Hldgs ZTHO 08/19 D n/a n/a
Aeropostale ARO 08/19 A 0.56 0.31
Americas Car Mart Inc CRMT 08/19 A 0.66 0.60
China Fin Online Co Ltd JRJC 08/19 A 0.01 -0.11
Cost Plus Inc Calif CPWM 08/19 A -0.84 -1.14
Foot Locker Inc FL 08/19 A 0.06 0.11
Gap Inc Del GPS 08/19 A 0.32 0.32
Hewlett Packard Co HPQ 08/19 A 1.08 0.91
Intuit INTU 08/19 A -0.10 -0.10
Marvell Technology Grou MRVL 08/19 A 0.40 0.18
Nordson Corp NDSN 08/19 A 1.12 0.71
Salesforce Com Inc CRM 08/19 A 0.27 0.17
Scansource Inc SCSC 08/19 A 0.47 0.47
Telecom Corp New Zealan NZT 08/19 A n/a 0.12
Wet Seal Inc WTSLA 08/19 A 0.03 0.10
Zumiez Inc ZUMZ 08/19 A -0.12 0.09
Zygo Corp ZIGO 08/19 A 0.10 -0.33
Agria Corp GRO 08/20 B 0.05 0.02
Anntaylor Stores Corp ANN 08/20 B 0.02 0.54
Camelot Information Sys CIS 08/20 B n/a n/a
Chemspec Intl Ltd CPC 08/20 B 0.25 n/a
Corinthian Colleges Inc COCO 08/20 B 0.39 0.31
Exceed Company Ltd EDS 08/20 B 0.47 n/a
Hibbett Sports Inc HIBB 08/20 B 0.10 0.17
Hormel Foods Corp HRL 08/20 B 0.59 0.57
Kirklands Inc KIRK 08/20 B 0.04 -0.09
Mueller Die Lila Logist MLL.F 08/20 B n/a n/a
Pt Indosat Tbk IIT 08/20 B n/a n/a
Shanda Interactive Entm SNDA 08/20 B 0.51 0.90
Ship Finance Internatio SFL 08/20 B 0.56 0.60
Smucker J M Co SJM 08/20 B 0.97 0.92
Capitol Bancorp Ltd CBC 08/20 D -2.00 -1.08
Central Fed Corp CFBK 08/20 D n/a -0.21
First Clover Leaf Fin C FCLF 08/20 D 0.09 -1.08
Imaging Diagnostic Sys IMDS 08/20 D n/a n/a
Neuralstem Inc CUR 08/20 D n/a -0.09
Powerverde Inc PWVI 08/20 D n/a n/a
Presidential Rlty Corp PDLA 08/20 D n/a n/a
Primeenergy Corp PNRG 08/20 D 0.38 -1.37
Qiao Xing Mobile Comm C QXM 08/20 D -0.18 0.01
Viryanet Ltd VRYAF 08/20 D n/a n/a
Vitalworks Inc AMCS 08/20 D 0.05 -0.03
•• Monetary Base as of Aug 15th ••
Monetary Base Exponential Average (10 periods) blue, Momentum (Mo) 26 periods
and MACD (exponential 6 and 13 periods), 26 periods ROC (rate of change) blue.
The data is biweekly (1 period)
The Monetary base (definition):
The currency and central bank deposits that together provide the base for the money supply under fractional reserve banking. Also defined as the central bank assets the acquisition of which creates this monetary base by injecting domestic money into the economy. The latter definition usually includes international reserves and domestic credit. By either definition, the monetary base changes as a result of open market operations and exchange market intervention. The data is bi-weekly.
•• Margin Debt thru Aug 15th ••
•• YoY & LT Inflation Rate thru Aug 15th ••
•• SGS Alternate Data Series ••
by John Williams
Updated on July 30th thru Aug 14th
Money Supply - as of Aug 14th
Inflation- as of Aug 13th

Unemployment - as of Aug 6th

GDP- as of July 30th

USD - as of Aug 10th
•• Yield Spreads thru Aug 15th ••
Yield Spread (Recent) between 5 year Treasury Notes yield (blue), and
13 week T-Bill yield (red). 10 year Notes yield (black),30 year Bonds
yield (magenta). Spread between 5 year Notes and T-Bills (maroon).
Yield Spread between 5 year Treasury Notes yield (blue),and 13 week
T-Bill yield (red). 10 year Notes yield (black),30 year Bonds yield
(magenta). Spread between 5 year Notes and T-Bills (maroon).
•• Daily Sentiment Readings thru Aug 15th ••
Rydex Funds Nova/Ursa Sentiment Ratio


NASDAQ Daily Sentiment Index (NDSI)


Option Buyers Sentiment Gauge (OBSG)


•• AAII Sentiment & Market Vane thru Aug 15th ••
![]()
(as of 8/11/2010)
 Bullish:  39.76%
 Neutral:  30.12%
 Bearish:  30.12%
•• Deviation Charts thru Aug 15th ••
•• Short Sales Data Aug 15th ••
Short Interest Ratio
Data Unavailable
Recent Put/Call Options Ratio OEX
Put/Call Options Ratio OEX
OEX Hines Ratio
•• Sentiment & Contrary Opinion Charts thru Aug 15th ••
NOTE: Indicators usually update throughout the W.E.


•• CoT Charts thru Aug 15th ••


•• Wall St. Courier Stats thru Aug 15th ••


•• Major Indicators & Indices thru Aug 15th ••
•• Baltic Dry index (BDI) thru Aug 15th ••
BDI - Short Term

BDI - Long Term
BDI vs SPX

BDI vs GOLD

BDI vs OIL

BDI vs CRB

•• Daily/Weekly VIX-VXN thru Aug 15th ••
•• PitBull Crash Index thru Aug 15th ••

•• M3(b) ST/LT Money Supply thru Aug 15th ••
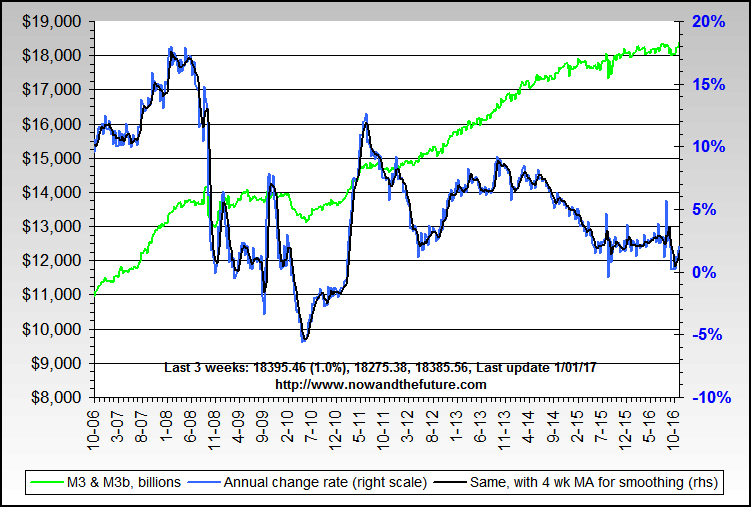
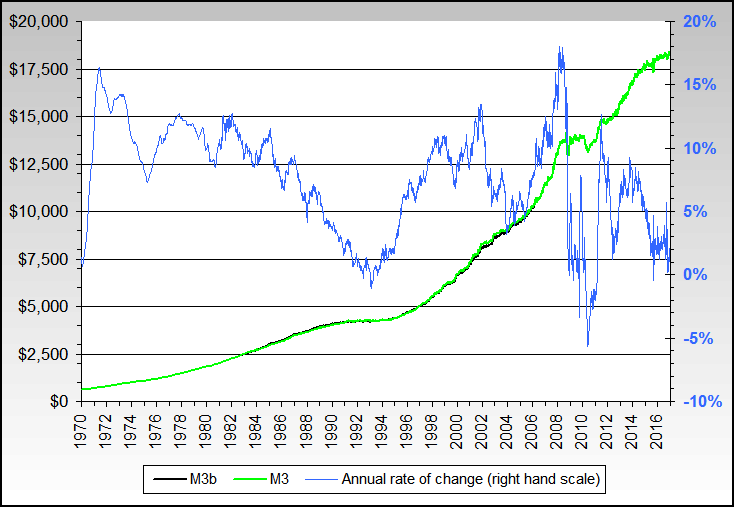
•• Insider Trade Activity thru Aug 15th ••
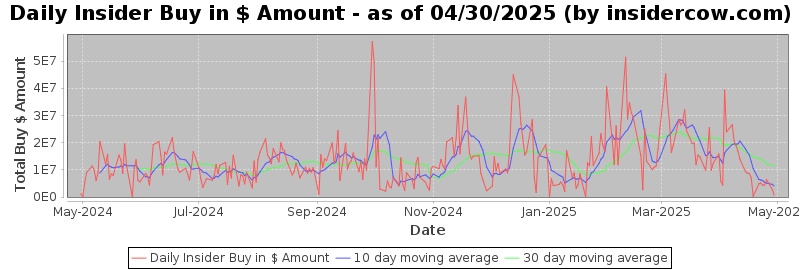
Top Buys/Sells Over Last 30 Days
http://news.moneycentral.msn.com/process/insider/top10insider.aspx?
•• Fed Market Operations thru Aug 15th ••
FRB POMO Data
http://www.ny.frb.org/markets/pomo/display/index.cfm?showmore=1
FRB SOMA Data
http://www.ny.frb.org/markets/soma/sysopen_accholdings.html
•• Program Trade 27.4% NYSE Volume (Aug 2-6) ••
http://www.nyse.com/press/1281607146627.html
Top 20 Most Active Firm
http://www.nyse.com/pdfs/PT080210.pdf
Top 3 Most Active Firms
MORGAN STANLEY & CO. INCORPORATED
GOLDMAN, SACHS & CO.
SG AMERICAS SECURITIES, LLC
                     NEW         ORG
 Aug     02-06      25.5%  or  ~51.0%
 Jul     28-02      28.4%  or  ~56.8%
 Jul     19-23      27.4%  or  ~54.8%
 Jul     12-16      28.7%  or  ~57.4%
 -------------------------------------
 4-Wks Rolling Avg  27.5%  or  ~55.0%
•• Fund Flows for Week of Aug 15th ••
08/11/2010 - Equity Fund Outflows -$503 Mil; Taxable Bond Fund Inflows $2.8 Bil
(xETFs - Equity Fund Outflows -$153 Mil; Taxable Bond Fund Inflows $2.7 Bil)
08/04/2010 - Equity Fund Inflows $2 Bil; Taxable Bond Fund Inflows $2 Bil
(xETFs - Equity Fund Outflows -$688 Mil; Taxable Bond Fund Inflows $2.1 Bil
07/28/2010 - Equity Fund Inflows $8 Bil; Taxable Bond Fund Inflows $2.3 Bil
(xETFs - Equity Fund Outflows -$38 Mil; Taxable Bond Fund Inflows $2 Bil)
07/21/2010 - Equity Fund Outflows -$2.1 Bil; Taxable Bond Fund Inflows $5 Bil
(xETFs - Equity Fund Outflows -$481 Mil; Taxable Bond Fund Inflows $3.1 Bil)
http://www.amgdata.com/#create:home:Home:/php/signup_trial.php

