 News
News  Market Data
  Discover
Support: 888-992-3836
Copyright © 2023 InvestorsHub Inc.


???
![]()
Register for free to join our community of investors and share your ideas. You will also get access to streaming quotes, interactive charts, trades, portfolio, live options flow and more tools.
Register for free to join our community of investors and share your ideas. You will also get access to streaming quotes, interactive charts, trades, portfolio, live options flow and more tools.
Thanks, I should be ready later this month.
Hey guys, I will be back in a few weeks :D
In the process of closing on a house. Taking forever but should close within 3 weeks. After that I will put together some funds and be back in business! I'm gonna be extremely rusty though!
Brown of Bankstocks.com open letter to BAC CEO
Tom Brown at Bankstocks.com shared on Thursday an open letter to Bank of America CEO Bryan Moynihan in response to the company's announcement on Wednesday that it will forgive principal on delinquent borrowers' loans. It couldn't have helped that BofA made its announcement as the government was reworking its Home Affordable Modification Program, making the Dollars for Deadbeats column fatter than ever. Here's the letter:
To: Bryan Moynihan,
CEO, Bank of America
Dear Mr. Moynihan,
I awoke this morning to read that Bank of America intends to begin forgiving mortgage principal for delinquent borrowers. I am writing to inform you that I will never bank with your firm ever again.
Principal forgiveness is an affront to every responsible, non-delinquent borrower in your book of assets. Not only is the federal reserve subsidizing the replenishment of your bank's capital by confiscating yield from savers/depositors so you can earn monstrous spreads on your loan book, but now you are rewarding those who bit off more than they could chew, while those who did not take on excess leverage, or who kept their income-to-debt ratios manageable, see no benefit, even as their home equity values have declined. Even worse, you are denying savers who sit in the cash market the opportunity to purchase inventory from the delinquent.
Capitalism should migrate assets from the weak to the strong, not the contrary. If you want to mitigate your loan losses, I suggest you advance an organized short-selling process to mitigate the expense of foreclosure, and to discover the fair market value of your delinquent assets. But for me, allowing those who are delinquent to now benefit from their financial excesses is a despicable solution that ignores the integrity and responsibility of those who actually finance the lion's share of your earnings: those who don't default.
Moral hazard be damned. Count me as one future cashflow stream you will never see again!
On lightest volume of the year
Really only a handful of days, going back over a year, that were as light as today...
DIA / NYSE / DJIA
Noticed that but then went and re-drew the lines and now the chart is updated.
Just this one day screwed up some of the indicators. I think we are due for a down week, I have no positions right now, and loving sleeping in XD
DIA 60-minute
DJIA
NYSE (check the volume on the down days, really interesting. Looks like the top 7 volume days YTD are all red bars)
Baidu - the Shooting Star from Hell
From Slope of Hope
Note to whomever paid $628.50 for BIDU: good luck with that.
DIA chart rising wedge support / resistance
So far both support and resistance have been spot on. Can only last another a couple hours or so more before it breaks one way or the other.
I'm out of all positions right now. Still think a Dow -80 to -200 is coming very soon. Slow STO rolling over...Although the indicators can instantly turn bullish (or bearish) on FED news later today within a few quick minutes....
My guess is Dow 10,400 by mid to late next week....
But I'm probably gonna sit on the sidelines unless something good pops up...
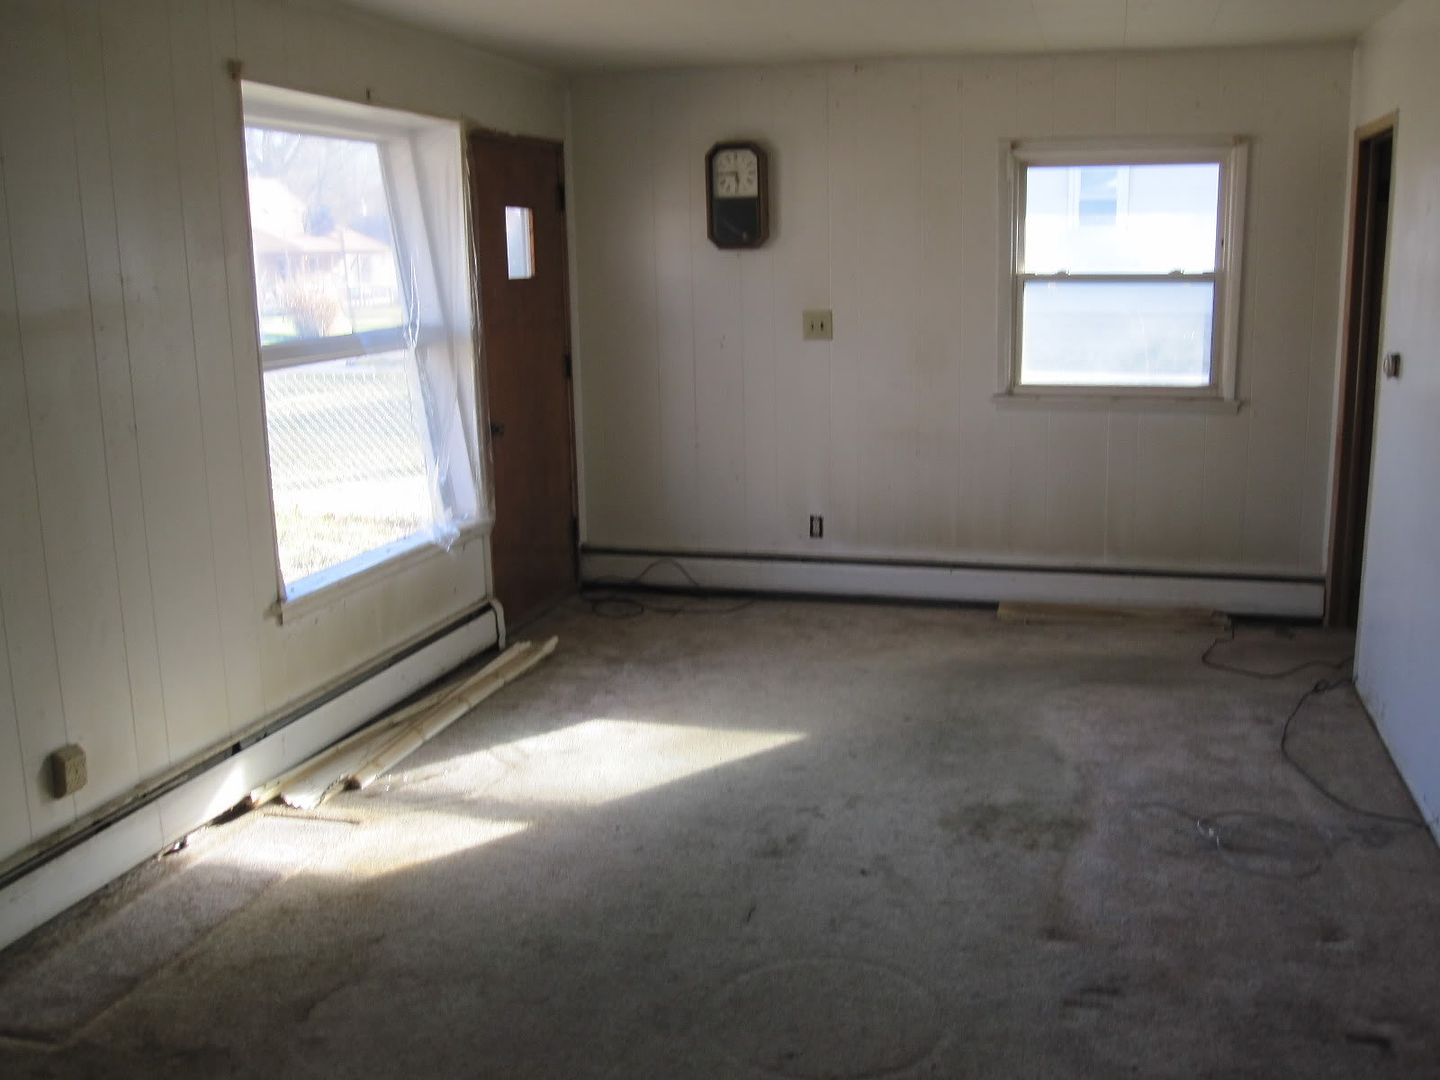
Buy a foreclosed and fix it up.
Win / Win situation. Around here (SE Michigan) you can pick up very nice foreclosed homes (well if you see the before pics you might not call them 'very nice') for the price of a decent used car, and that is after putting all the upgrades in. Then no mortgage, just pay summer/winter taxes and call it a day.
I got one under my belt last fall. Looking for one more either this summer or whenever I can set $20,000 aside. I got a nice house in the suburbs of Detroit for $10,700 including taxes. Put $10,000 into it, slapped a couple coats a paint, new doors, windows, lights, carpet, etc., the place looked brand new....
EDIT: Not sure why pics coming out so large. I'm using Linux so maybe it shows up normal on Windows...Try holding CTRL and hitting the minus sign about 10 times if you are getting absurdly large pictures....
BEFORE
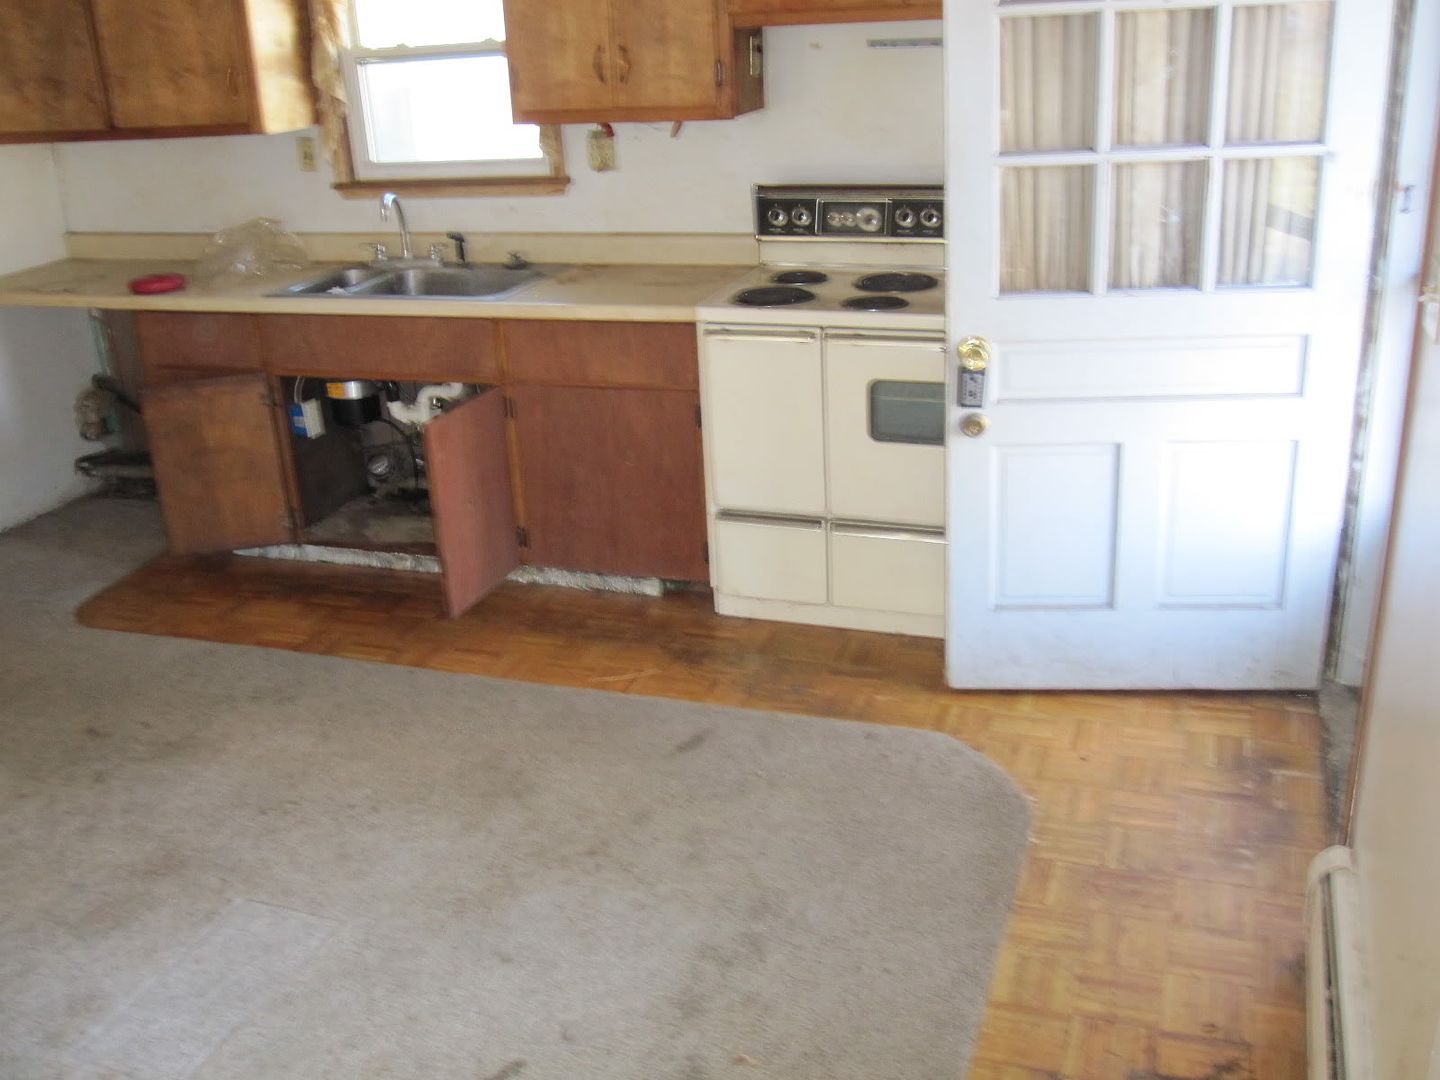
AFTER

BEFORE

AFTER

BEFORE

AFTER

BEFORE
AFTER

Markets will probably pick a direction tomorrow
...for a short-term move rest of week in the amount of 150-200 points imo. But, after being up so many days in a row, I think the odds are in favor of the bears. I'm not a permabear by any means although I may come off as one, here is how I am looking at it.
Imagine if the SPY was DOWN 18 of the last 20 days. 4 full weeks of trading and only 2 GREEN days. I would be all over calls at that point! The opposite is happening right now so I expect a short reversal. Being conservative just looking for 2-3% for starters. That is nothing, can happen in 2 days.
So from 10642 (current) looking for 2-3% pullback, 10,430-10,325.
This is a snap of the volume bars of the SPY last 20 days....If the opposite was going on (all red but 2 green bars) then I'd be looking for a short-term pop....But the way things look right now, I'm looking for a short-term drop. Although very green, the indexes have been pretty much flat which is a red flag to me.

VIX looks bullish for the next week. The NYSE, $COMPQ, and $RUT look like they are going to give up some gains over next week..bearish candle patterns last few sessions IMO...
This 60 minute chart of the DIA has been working like a charm for support / resistance. Will be interesting to see how tomorrow goes. Chart is a stillshot...

$INDU: Friday's hod = 10,644.95 Today's = 10,644.19
Chalk it up as a win for the bears....Also lower highs/lows on the $SPX/$COMPQ

SPY to close green 12th day in a row
Sure, why not!
$SPX Volume Very Strong Today (on down days)
Everything looks like it's rolling over in perfect harmony...
The support off the rising wedge on the DIA 60-minute chart is broken. Pretty much has to break as by the end of this week it will be at roughly $108 and the week after somewhere around $112
Dow Double Top List (BAC, GE, INTC, TRV, UTX)
WMT broke through...up almost 3% today keeping the Dow losses less bad
Hey Lang, what are you trading today
for options? Or looking at?
I am a mental midget.....Loaded RIG $85 puts on Friday at 98 cents and then doubled down at 80 cents.....they closed at 69 cents and I thought I was fecked. RIG closed exactly on the 50 day moving average @ $86.07.
Well I sold all this morning at 90 cents with RIG at about $85.3
Now RIG is somehow at $83.6 at the lod and the ask on the puts is $1.88, up 168%....Sold $1/contract too soon.
I switched to DIA $106 puts @ 63 cents so hopefully they hit $1.6 by tomorrow!
I think the markets will be fecked for the next couple weeks:
DIA rising wedge 60-minute
$INDU rising wedge 60-minute from TheChartPatternTrader:
GS 60-min chart: Candle of death

DIA Rising Wedge Support Broken
Markets should get worse as the day progresses imo....Support line can be drawn at varying angles so hard to say which line of support is most accurate as there can be many ways to draw the line.
But, support on this 60-minute chart is rising by the hour...By the end of today it will be at $106.3.....by the end of tomorrow $106.6....By the end of the week roughly $108....So it is pretty much a NO BRAINER that support will fail...
Following support levels are for the $INDU (last 10,575)....
1) 10,582: 34 day simple moving average
2) 10,558: 50 day moving average on 60-minute chart
3) 10,551: pSAR on 60-minute
4) 10,532: 10EMA on daily chart
5) 10,507: pSAR on daily...will flip bearish if the $INDU touches it
6) 10,385: 50 day moving average on daily
$COMPQ Channel
Moody's Says US Deficit Could Pressure Credit Rating
3/15/2010
9:26:00
Moody's is expected to warn that there will be "downward pressure" on America's triple-A credit rating unless the U.S. deficit is reined in to a greater extent than currently predicted by the Obama Administration, according to the Financial Times.
Pre-market: GOOG $568 // BIDU $569
Pre-market: GOOG -$12 // BIDU +$18
Posted by: thegreatgate
Date: Sunday, March 14, 2010 11:57:26 AM
I think GOOG is gonna pull back a lot on Monday and BIDU is gonna skyrocket. Just my guess. Maybe $15-$20 down for GOOG and $15-$20 up for BIDU...
Asia mostly lower, Dow futures -47
I can see it now. A flat open and by 10:30am Dow up another 50 points, lol...
I have some SPY puts, betting that the SPY won't be green for the 12th day in a row...and will get a red candle making 3 red of last 20 days...
$HSI index down 175 points or .82%...trading slightly higher than 21,000
Cutting it real close on the DIA rising wedge...a half a point from support...a half a point from resistance....Looking at the chart, it is extremely likely the gap at 104.5 will fill. The only thing that is certain is it will break one way or the other. Because of the astronomical run-up over the last 4 weeks I am anticipating a break to the downside. By closing bell support will have risen to roughly 106.3 so even a slightly down day tomorrow will cause a break of support:
Not priced in. Actually the opposite of that..
This is unexpected, shareholders thought the GOOG/China dispute would be resolved with GOOG staying in China.
In fact, part of the reason GOOG tanked in JAN/FEB was when they threatened to pull out of China (which also boosted BIDU share price).
Also GOOG soared last week partly because of comments from the CEO that the China matter would be 'solved soon'
I think GOOG is gonna pull back a lot on Monday and BIDU is gonna skyrocket. Just my guess. Maybe $15-$20 down for GOOG and $15-$20 up for BIDU...
Google '99.9 Percent' Sure to Shut Down in China
Hey, that sucks, I got the AMZN $120 calls at $2.97 and I think they hit $14 on Thursday....I got the AMZN $125 calls at $1.48 and they hit $11.25 on Thursday. I sold my $120s at $5 and my $125s at $2.5x or so...
Also was VERY heavy in the February Google calls but it was trading like such a pos that I skipped getting back in with you on the March calls. When I was watching it the Dow would rally over 100 points and Google would be up a half of 1 percent (and BIDU up 3-4%). Would close off $3 from the hod and would have very weak closes where it'd come down $2 in the last half hour of trading. So skipped calls for March. I'm just lucky I didn't buy puts...
I wonder if BIDU will skyrocket on Monday?????????
By Chia-Peck Wong
March 13 (Bloomberg) -- Google Inc. has drawn up detailed plans to shut its search engine in China and is “99.9 percent” certain of going ahead with the closure, the Financial Times reported today, citing a person it didn’t name.
The company may make the decision very soon, while it will take time to carry out a closure to make sure staff don’t suffer reprisals from authorities, the paper said, citing the person as familiar with Google’s thinking. Marsha Wang, a Beijing-based spokeswoman for Google, said she had no comment on the report when reached by phone.
Google said on Jan. 12 that it will stop filtering results in China after what it called an infiltration of its technology and the e-mail accounts of Chinese human-rights activists. China yesterday called Google’s plan to defy government censorship rules “unfriendly and irresponsible.”
“The usual headline is companies are coming into China, not companies pulling out,” said Duncan Clark, Beijing-based chairman of business advisory company BDA China Ltd. “China wants to be the leading place for research and development. They’d like to have tech companies here but they don’t want the content involvement. But you can’t separate the two.”
Revenue Cost
Google may have to pull out of China pending talks with authorities, it said in January. An exit from the world’s biggest Internet market would cost Google, whose sales growth slowed during the U.S. recession, $600 million in revenue, according to estimates by JPMorgan Chase & Co.
China is “a market that no company can ignore, Google included,” JP Gan, managing director at Shanghai-based Qiming Venture Partners, which oversees more than $500 million, said before the FT report. “You have to play by the local rules if you want to operate here.’
The resolution of the dispute with Google rests on the company, not the government, Li Yizhong, minister of industry and information technology, said on March 12. “If one company violates the Chinese law and is unfriendly and irresponsible, that’s unwanted and means the company doesn’t merit its world class status.”
Talks with the Chinese government may yield results “soon,” Google Chief Executive Officer Eric Schmidt said on March 10.
‘Sophisticated’ Attacks
Google’s systems were targeted by “highly sophisticated” attacks aimed at obtaining proprietary information, as well as personal data belonging to human rights activists who use the company’s Gmail e-mail service, it said in January. At least 20 other international companies in technology, finance and chemicals were similarly targeted, Google said at the time.
Symantec Corp. and McAfee Inc., the world’s two biggest makers of security software, said this month they are working with the U.S. government on an investigation of the source of the cyber attacks.
China may have 840 million Internet users, or 61 percent of the population, by 2013, according to EMarketer Inc. in New York. The country had 384 million at the end of last year, according to government data.
--With assistance from John Liu in Beijing and Mark Lee in Hong Kong. Editors: Mark McCord, Alex Devine.
To contact the reporter on this story: Chia-Peck Wong in Hong Kong at cpwong@bloomberg.net
To contact the editors responsible for this story: Young-Sam Cho at ycho2@bloomberg.net
www.businessweek.com/news/2010-03-13/google-99-9-percent-sure-to-shut-down-in-china-ft-says.html
S&P secret code within 1149.99
LoL...
I thought some of these posts were hilarious. From the SPY board on Yahoo...

S&P secret code within 1149.99
Flip the last three digits upside down and you get:
666
* 666 signaled the original Buy in March 2009
* 999 signals the sell (upside down = 666)if you catch my drift.
Even more interesting is that "they" incorporated words into the code. The digits before the 999 (666 upside down meaning sell)...are "one" and "four"....so it says "One for upside down satan".
Heard this at a McDonalds Playland earlier today....Ronald and McBurgler were talking just a little too loud.
HAAAAAAAAAAAA, HAAAAAAAAAAAAAAAA ...have a great weekend.
i think you are right, upside down and reversed it says 411-666 meaning information for satan = SELL
or "I one for satan"
yeah and if you add up
1 + 1 + 4 + 9 + 9 + 9 = 33
and 3 + 3 = 6 !!!
oh man it just gets worse but you have it wrong, you didnt go far enough:
33*6=198
1+9+8=18
6+6+6=18
also take the last number put it on front of the first number and you have Sept 11
holy sheet that is 9-11 and 9-1-1, dipped in double meaning again.
The high of the day on the day the market hit 666 as a low had close to the same 999........699.09 was the high
the other day my portfolio gained $666 for the day; I took a snapshot of it and later discarded the picture after I started losing money the next day
The market has gone up every day for the last 2 weeks.
I suppose it can go up everyday next week too but at some point the MMs will pull the plug. Again, not saying Armageddon back to 8,000 on the Dow....But a couple hundred points off the Dow would be very healthy.
The SPY has gone up every single day for the past month. LITERALLY! Only 2 red days going back to February 16th which will be 4 weeks ago come Tuesday.

In the first 10 days of the month here is how the indices have performed:
$SPX: 4.12%
$INDU: 2.9%
$COMPQ: 5.78%
$RUT: 7.64%
$NYA: 4.66%
Hammer candles put in on the QQQQ, SPY, and DIA daily charts today, not that it means anything...

^^^^^^^^^^^**Note all those green volume bars on the QQQQ/SPY last couple weeks**^^^^^^^^^^^


S&P secret code within 1149.99
From the Yahoo Finance SPY board
S&P secret code within 1149.99
Flip the last three digits upside down and you get:
666
* 666 signaled the original Buy in March 2009
* 999 signals the sell (upside down = 666)if you catch my drift.
Even more interesting is that "they" incorporated words into the code. The digits before the 999 (666 upside down meaning sell)...are "one" and "four"....so it says "One for upside down satan".
Heard this at a McDonalds Playland earlier today....Ronald and McBurgler were talking just a little too loud.
HAAAAAAAAAAAA, HAAAAAAAAAAAAAAAA ...have a great weekend.
Bran
i think you are right, upside down and reversed it says 411-666 meaning information for satan = SELL
yeah and if you add up
1 + 1 + 4 + 9 + 9 + 9 = 33
and 3 + 3 = 6 !!!
dude, stairway heaven still playing on the upside down van at the bottom of the gorge holding two corpses with one tire still spinning
also take the last number put it on front of the first number and you have Sept 11
the other day my portfolio gained $666 for the day; I took a snapshot of it and later discarded the picture after I started losing money the next day
$SPX Chart Says It All!!! Here it is:

DIA Rising Wedge Nearing Support
If it breaks, IMO the best case scenario is a fall to $105.5 at the 50MA (roughly 10,550).
But what I think most likely will happen is a test of the 100MA at $104.60 (roughly 10,460).
DIA Falling Wedge Nears Support: CAREFUL!!!
The resistance line has worked like a charm, didn't adjust it since posting this chart a couple days ago and the markets bounced off resistance this morning...
If DIA $106.00 falls later today or on Monday it could be a bad week...
Some Dow charts that could pose a problem
Possible double tops...
TRV
UTX
INTC
BAC
Others (WMT, JNJ, GE, HPQ) all within $1 of a double top
$SPX 1149.64 ... SPY 115.47
Markets at 61.8% retracement lines
DIA a better example (SPY a couple points below):
POT calls?
$130 April ?
52-week high: $126.47
Today's close: $116.93
After hours close: $125.72
I'm just concerned the markets might take a blood bath either next week or the week after.
Nice volume on the SPY today
LMAO @ GS going red
I know it will probably close green, why not?
Close down $2 would be nice...
VIX up 4% (daily chart buy signals galore)
DIA Falling Wedge Support Clearly Broken
EDIT: Wrong Chart, nevermind, but close:
GS $170 PUTS what a stock
What a manipulated stock....Got in with GS soaring around $173....Went red....Wonder if it will go back green.
In $1.64...last $2.11....wow!
Anything on radar today?
I got some QQQQ 47 puts before the bell...Held the SPY puts...
Looking at GS $170s

