 News
News  Market Data
  Discover
Support: 888-992-3836
Copyright © 2023 InvestorsHub Inc.


Looking for my next Forex trade
pennies2007
![]()
Looking for my next Forex trade
Register for free to join our community of investors and share your ideas. You will also get access to streaming quotes, interactive charts, trades, portfolio, live options flow and more tools.
Register for free to join our community of investors and share your ideas. You will also get access to streaming quotes, interactive charts, trades, portfolio, live options flow and more tools.
Looking for my next Forex trade
New Forex Forum Just for Us
Ok gang, I've had it with IHUB at this point. It's bad enough we have to pay to get unlimited posts and then still have to deal with ads and slowdowns, problems posting, etc. Then to have to sit back while it goes down for 2 to 3 days (yet again) is more than I can stand.
So I'm following through on my original promise several years ago...I've created a brand new Forex forum for anyone who wants to join.
1. It's totally free...forever.
2. There are NO advertisements on the forum.
3. You have unlimited posts.
4. You can use the exact same screen names that you have here...mine is already set up as Pennies2007 on the new forum.
5. Looking at posted charts is super easy...you can expand and unexpand the charts without leaving the post itself.
6. We have a free Mobile app as well, although I do have to let you know up front that the mobile app is a general mobile forum app so there are some ads there but they're not intrusive. Plus, the mobile app does a great job of allowing you to see chart screen shots.
I have nothing to sell and nothing to gain by doing this. I just want a clean place that doesn't cost a dime (that doesn't go down every time you turn around) where we can work on trading strategies.
If anyone wants to take a look, just go to this link and register for free.
http://taforextrading.createaforum.com/general-discussion/ta-forex-trading/
Looks like it dropped a bit more there for ya Kirby. Good call. I'd be pretty leery about it from here on out though on shorts.
Interesting area we're in right now on the daily line chart. Really nice confluence for potential strong resistance.
Time will tell...I'm patiently waiting. 
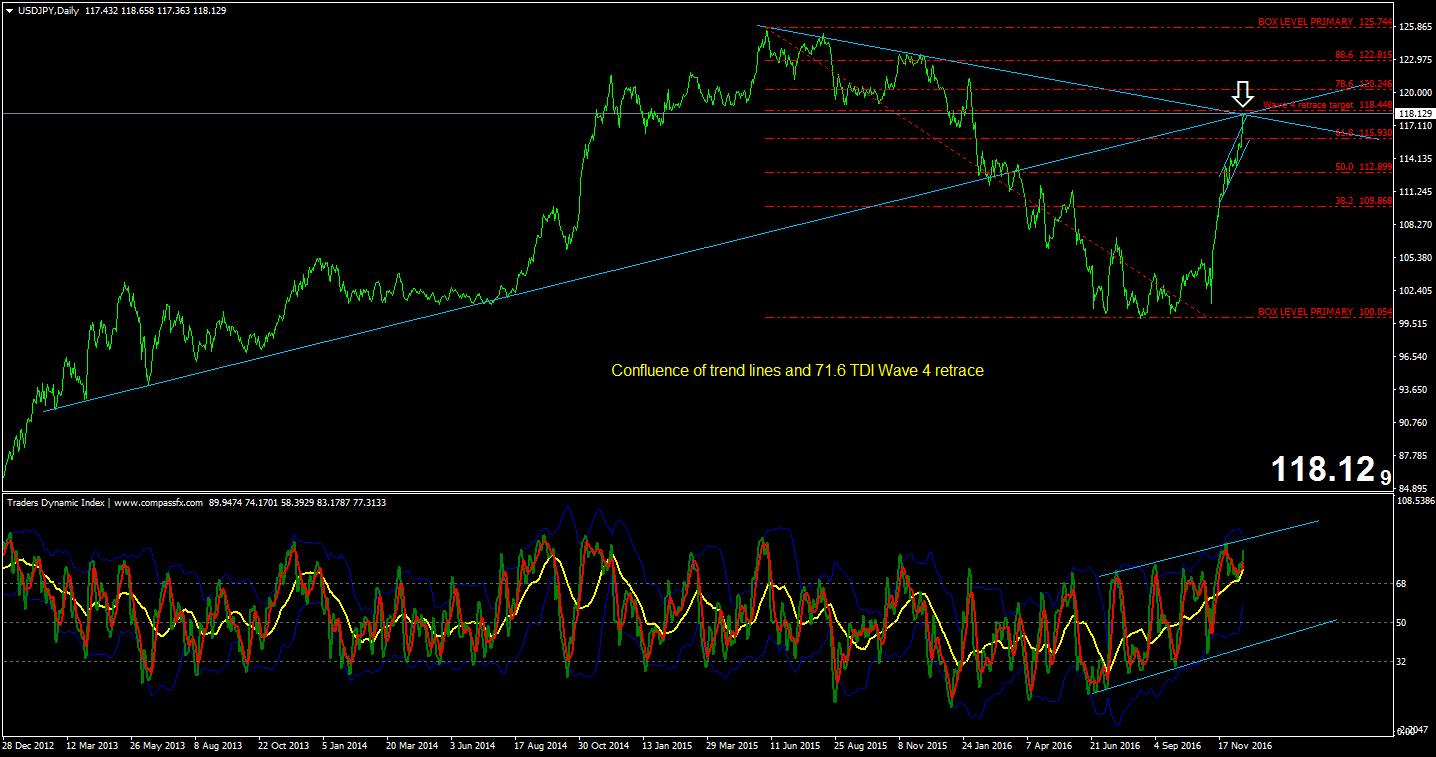
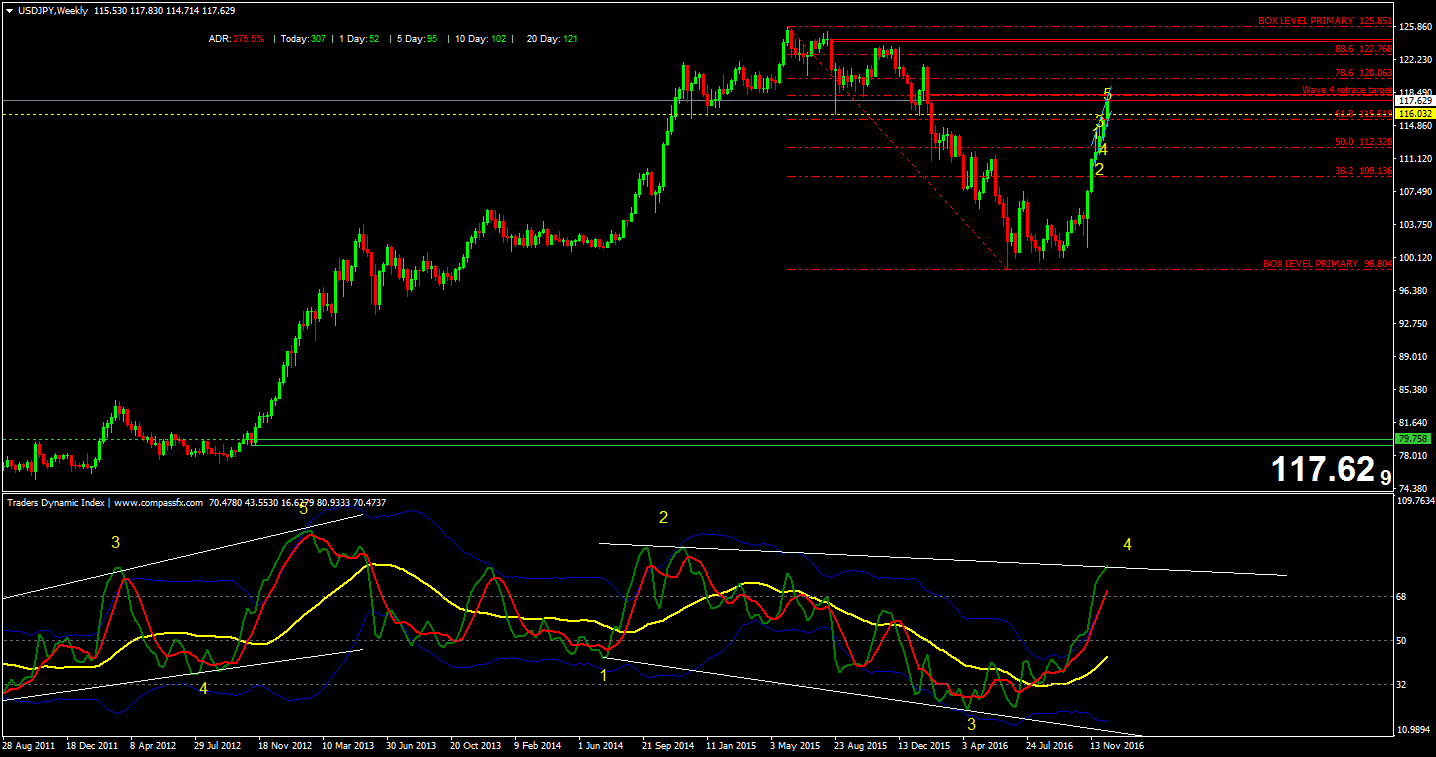
I really should have had this pegged the whole time on the end target area. This is a Wave 4 TDI movement on the UJ weekly and Wave 4 almost always move back up to between the 61.8 and the 71.6 fib, with the 71.6 fib getting hit the majority of the time.
Hey Kirby. Watch EU carefully. I still suspect that this is just a Wave D finishing movement before it takes off north again hard. Usually, one of the 3 wave movements can overthrow the trendline, making it look like it's gonna keep going right before it pulls a hard reversal the other direction.

Yep, market went totally bonkers and took the sucker vertical right here at the end...could still make 118.
UJ 4 Hour Update
Capitulation candle going on here with a trendline overthrow. Key sign that the market has gone way too far. Time to double down on the shorts.
UJ 4 Hour Chart
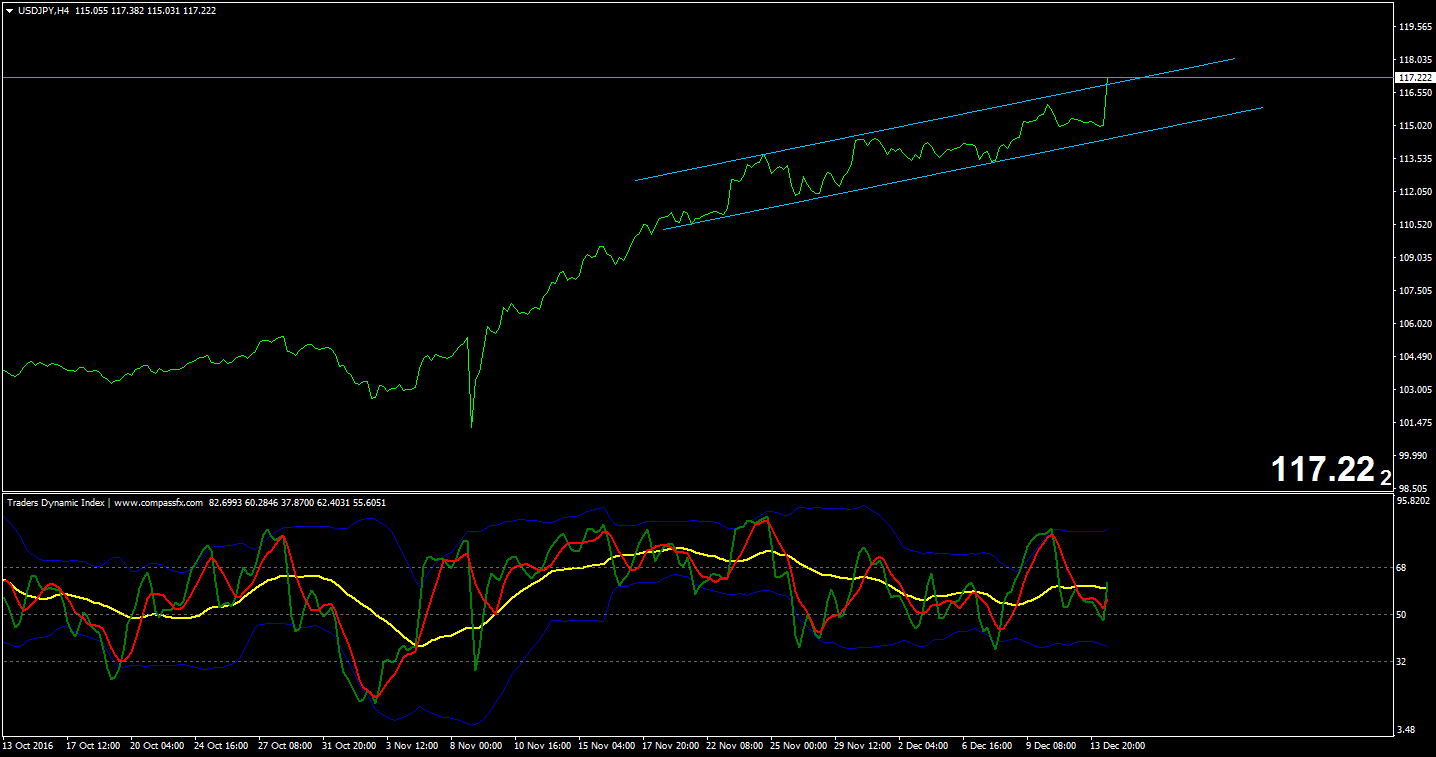
Yellen did go ahead with the 25 basis points...fair enough. UJ is still cycling within the final movement up inside the 4 hour line chart channel here.
Final surge going on now...

The Fed's Magic Act
And so we come to it tomorrow...the big day the market has been waiting on for the year-end Fed announcement.
The entire market has priced in a 100% chance of a 25 basis point hike...literally. That's all the analysts talk about. They also say it'll be a ho-hum moment and that all they're really gonna look at is the statement after the announcement when she speaks at the press conference.
But the EU and UJ charts tell us something different. Those 2 charts are telling us that we're due for some kind of shock reversal on both pairs.
So the question is...what could cause such a shock? It certainly isn't the 25 basis point increase everyone expects, although the "buy the rumor, sell the news" story could kick into play. But that really wouldn't be that volatile.
You see, Yellen's back is really against the wall here. Every country out there is doing nothing but cuts...watering down their currency by cutting rates. Yellen really doesn't want to be the only kid on the block raising rates and risking the US dollar going even higher because she knows that's counter productive. But, she doesn't want to stop the stock market rally either.
Currently, the US dollar and the stock market have gone up together, which is unnatural. They should have an inverse relationship...market up, dollar down and vice versa.
So how does she pull a rabbit out of the hat and keep the market up and tank the dollar? What if...just what if...she pulls a shocker and only raises rates by 1/8 of a percent...only 12.5 basis points instead of 25. Or, better yet, what if she really throws em a curve ball and holds steady with NO RATE INCREASE. Now that one would severely tank the dollar and the market would love the idea of a further free ride...thus effectively killing 2 birds with one stone.
Of course, it doesn't have to be Yellen...the shock could come from another source. But I'm really wondering at this point if things won't go very differently tomorrow than what literally 100% of the analysts are all saying.
Time will tell...just putting in my humble opinion as always.
EU Weekly Chart
Nothing has changed here so far. Still expecting the move back north again very soon.

I haven't seen his video before but I just looked at it Jav. Pretty standard stuff...I didn't see anything new in there that I haven't seen before. The TDI squeeze was actually done by Dean Malone several years ago as a viable trade pattern. It can be useful but not when used by itself. I have seen the squeeze patterns fail if they're not coupled with other diagnostic tools to confirm a trade.
DOW Jones Long Term Outlook...Correction
I just realized I posted an incorrect wave count on the DOW Jones chart. This chart shows the corrected version. Basically, we're wrapping up a large 5th wave expanding diagonal. The expanded flat I mentioned in the first post ended in a C wave down during the last recession.
So the sell off, when it comes, will ultimately break the expanding diagonal you see on the chart to the down side. The down side target is still down around 1000...maybe less.

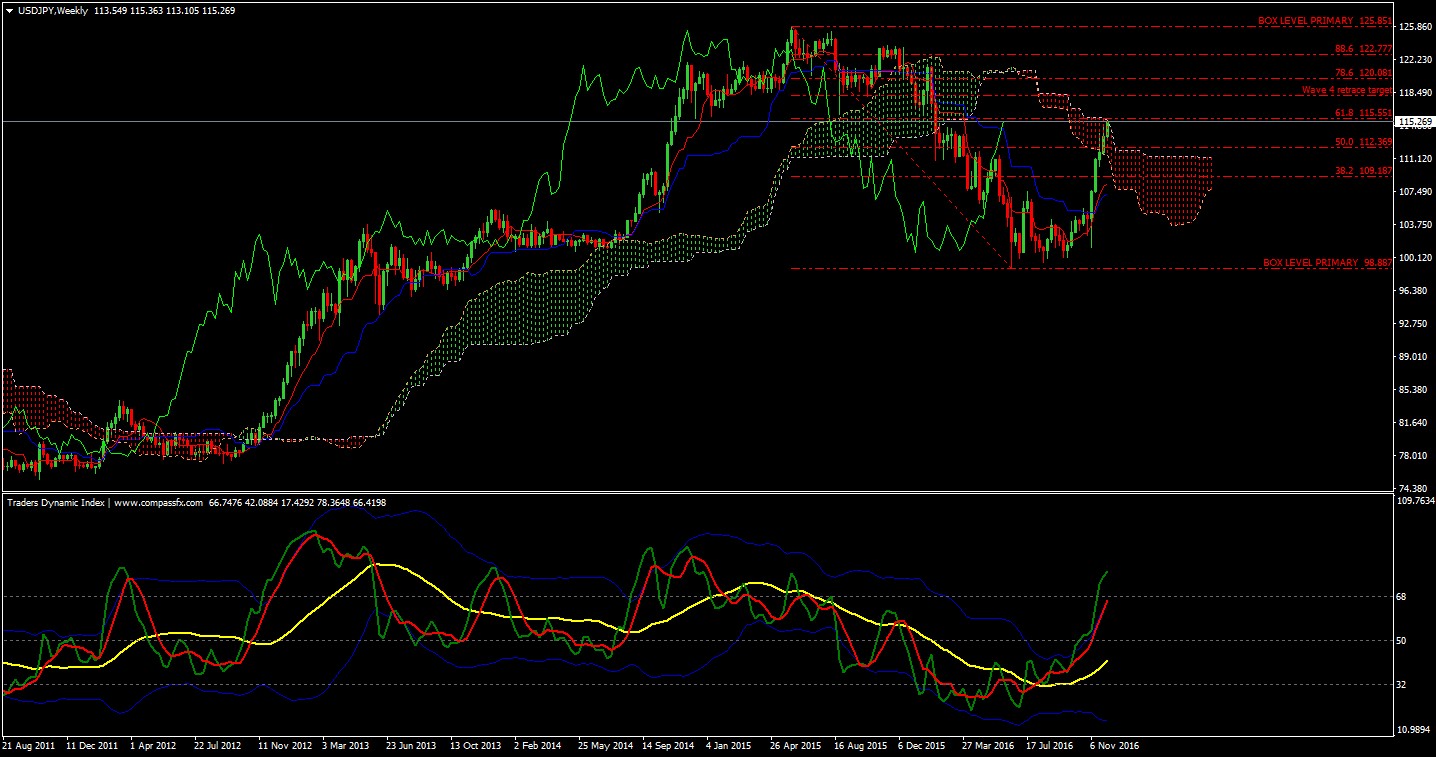
UJ Weekly Chart with Ichimoku Cloud
I remember seeing this a while back and though I'd throw it out there since several of us are watching UJ. I don't use the cloud much anymore but I still glance at it from time to time.
Basically, the last big sell off on UJ caused the cloud to flip over to bearish and thicken out...that provides a really big resistance level to get through and the chances of UJ breaking through this level, combined with the 61.8 retrace, are slim to none.
No problem. Simple introduced the line chart concept to us a long time ago and then Jav made a post about a guy who was using the line charts in a unique way to trade. I just incorporated it in with my other trading methods and it seems to work well. Just another good tool in the box.
One more view of the UJ 4 hour chart using the original line chart I had set up, including a wedge pattern on the top...it also shows a final topping process with a retest of the broken trend line.

And here's the UJ 4 hour chart showing the final channel 5th wave progression...it falls right in that area as well.

If we back off of the daily chart a bit, it looks like things are still gonna be wrapping up pretty soon here on UJ. We have the overall 61.8 fib retrace sitting at 115.519 and that's just below a long term prior support level now turned resistance at 116.03.
UJ is very likely to hover until the Fed announcement Wednesday where I strongly suspect it'll just be one of those "buy the rumor, sell the news" deals. A 25 basis point increase has long since been priced in on the dollar rally.
UJ Daily Chart...

DOW Jones Long Term Chart Outlook
Well gang, it's been a long time coming but the market is finally moving up into the ecstatic "it's gonna go up forever" mentality again. Retail is finally bullish again on the overall market perspective and we've got crazy calls coming out about DOW 25,000, etc...same old garbage we always see around long term tops.
Looking at the longer term charts, the DOW has moved into the 2nd leg of a larger corrective series called an expanded flat in Elliott Wave terminology. These are tricky waves because each leg actually extends beyond the starting point of the previous wave leg. So Wave B extends itself out and the final Wave C extends itself beyond the previous Wave A peak, either up or down.
In this case, the last big recession saw the market complete a 5 wave series to the downside. Now, we're in the final throws of a large 3 wave correction topside that made new all-time highs. The next leg down is gonna be seriously ugly though. Since the C wave down has to extend beyond the previous lows, that means the previous lows around 6000 are gonna get smack-gobbered. The market could actually work it's way all the way back down to 1000 or less...yes, you heard that right...1000 or less. Basically, all of the wealth accumulated in the market since the early 70's would vanish.
But, after all of that nonsense is over with, we're gonna embark on a new bull-market that will last for many years. Hyper-inflation, massive upside gold prices, etc...you get the idea.
Here tis...

Yep Heavy, I've got things narrowed down to just the basics now...makes it much easier to see what's going on.
Near as I can tell at this point, UJ is still moving up and down in a near-term correction wave series with a peak near 114.40 or so. After that's tested again, I expect some nice downside volume movement to occur.
UJ 4 Hour Chart
Nice rejection here on the 4 hour line chart. I took another short position right at 114 in anticipation of this.
The standard 4 hour candle chart also looks like it's ready to break down as well.

Yep, I had one over a week ago I posted on EU but here it is again as it stands now Jav. The Elliott wave count pattern suggests that EU is headed back up to the top trend line to complete the final "E" wave in a large Wave 4 consolidation pattern. After that, it's likely to fall apart and head down to just below parity...somewhere around .9980. After that, it's due for a long term bounce back up.
EU Weekly Chart...

Evening Jav. I took profits on some flipper UJ shorts but still holding a primary short position for a 107 hit later.
I jumped into another EU long this morning but bailed out again way too fast. As I thought, it did pop nicely off that lower trend line and should continue working it's way back up towards an "E" wave completion later above 1.13 and very likely well above 1.14.
Evening gang. The Italy referendum is gonna make things really interesting tonight and tomorrow on the currency markets...sort of like a smaller version of Brexit.
I bailed out of my EU longs last week for a small profit well before the weekend. Still short UJ though. I think a "No" vote on the referendum could send UJ spiraling downward in a major way. If the Italians pull a rabbit out of the hat with "Yes" vote though, we still have the Fed coming up soon and that would result in a sell off too, so either way, short UJ should be a good bet until the 107 mark is hit to the downside.
Gotta run gang...everybody have a good one.
Yep, that's the wordy word of the day Jav...LOL! In the immortal words of Hannibal...

Definitely the best spot to take a shot at it. I'm in early (of course), just like always...LOL!
Yep, larger trend is still very much down Jav. And the TDI wave count suggests the same thing. That's how I based this UJ short trade on charts I posted several days ago. This method you found just goes to substantiate what I already saw using a totally different method.
Here's a UJ hourly chart showing the longer term trend line break. This particular retest resulted in a slightly higher high but notice where the target is if we look for a full range of movement inside the 2nd box...just above the 106 level which would easily give us our 107 lowside target on the shorts.
Basically, the chart is saying this is the ideal spot to short UJ and hold it for a 107 target. It also aligns nicely with that larger weekly chart at the same key level. So we have the weekly, daily, and hourly chart all showing UJ shorts are the way to play.
UJ Hourly...

I'm seeing more and more instances where taking profits at the 61.8 fib retrace of the 2nd box was very wise...many, many times price turned right there and headed right back the other direction.
Here's another example back on the daily UJ chart again when it first broke that trend line and retested it. Taking profit at or near the 61.8 fib in the 2nd box would have been just right.
Here's a bigger picture of that same NU 15 minute chart, Jav. You might want to zoom out and take a look at the larger picture first before going in really close.
Notice here how the retest of the broken trendline was the perfect place to go short on NU.
I noted on the chart here that the 61.8 fib inside the 2nd box is a really good place to take some or all of the trade off the table and wait to see what happens next.
NU 15 Minute chart...

The box should cover the entire trend line move from lowest point to highest point from where you begin and end the initial trend line that you're watching.
The method is very similar to the standard box method we've explored before here on the board. The difference is that the trader is using line charts and he's estimating box size based on the trendline size rather than a standard price action box...but the overall setup is still familiar.
No worries...as long as the shorter time frame is moving in the direction of the larger time frame, I would take it as a safe trade.
I took out my magic crayons and marked up your chart...LOL!
Explanations are on the chart...

I would say right off hand that the best way to handle this type of setup Jav is to go to the weekly chart first to look for the larger patterns. The drop to the daily to fine tune the trend lines. After that, you can probably switch over to the 4 hour charts to trim it up a bit more but that's probably about as low on the time frames as you'd want to go.
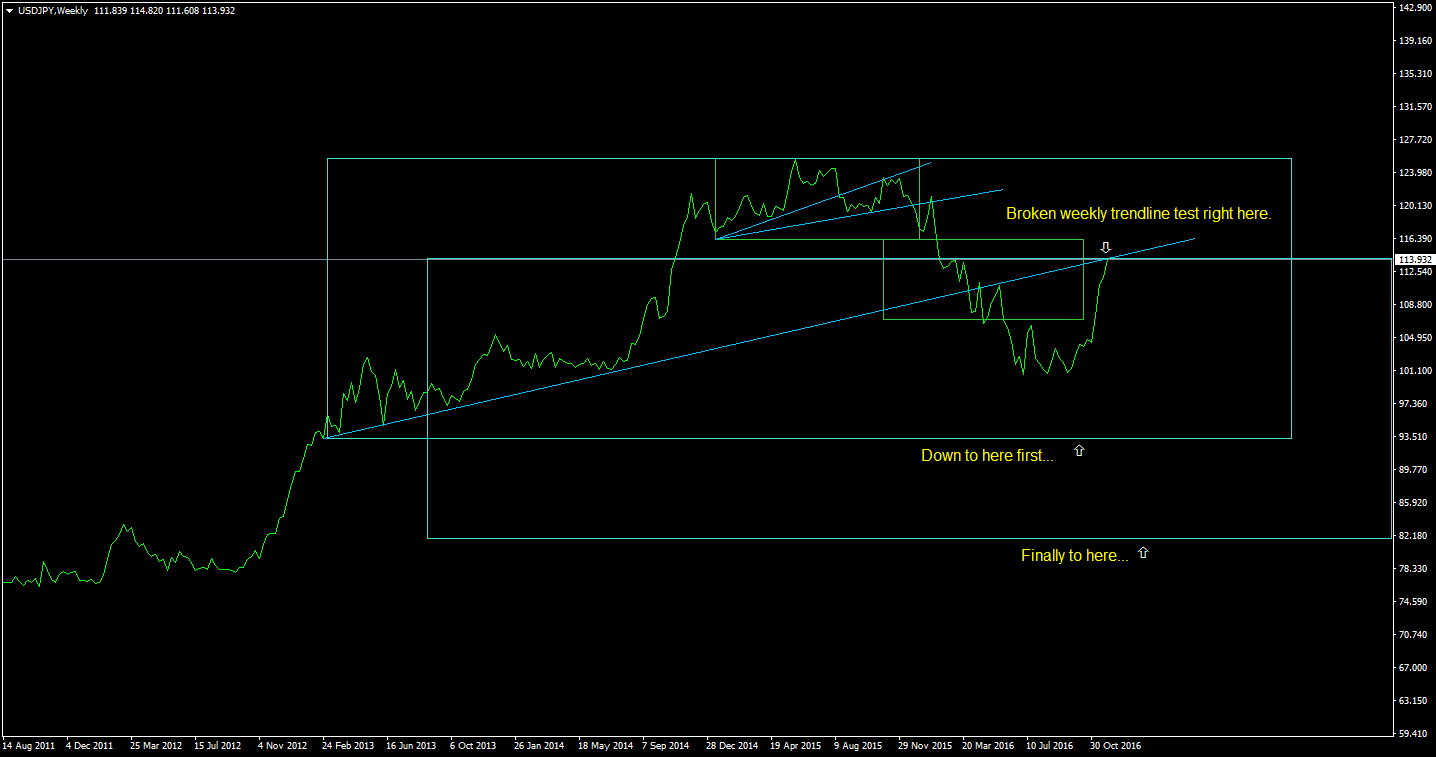
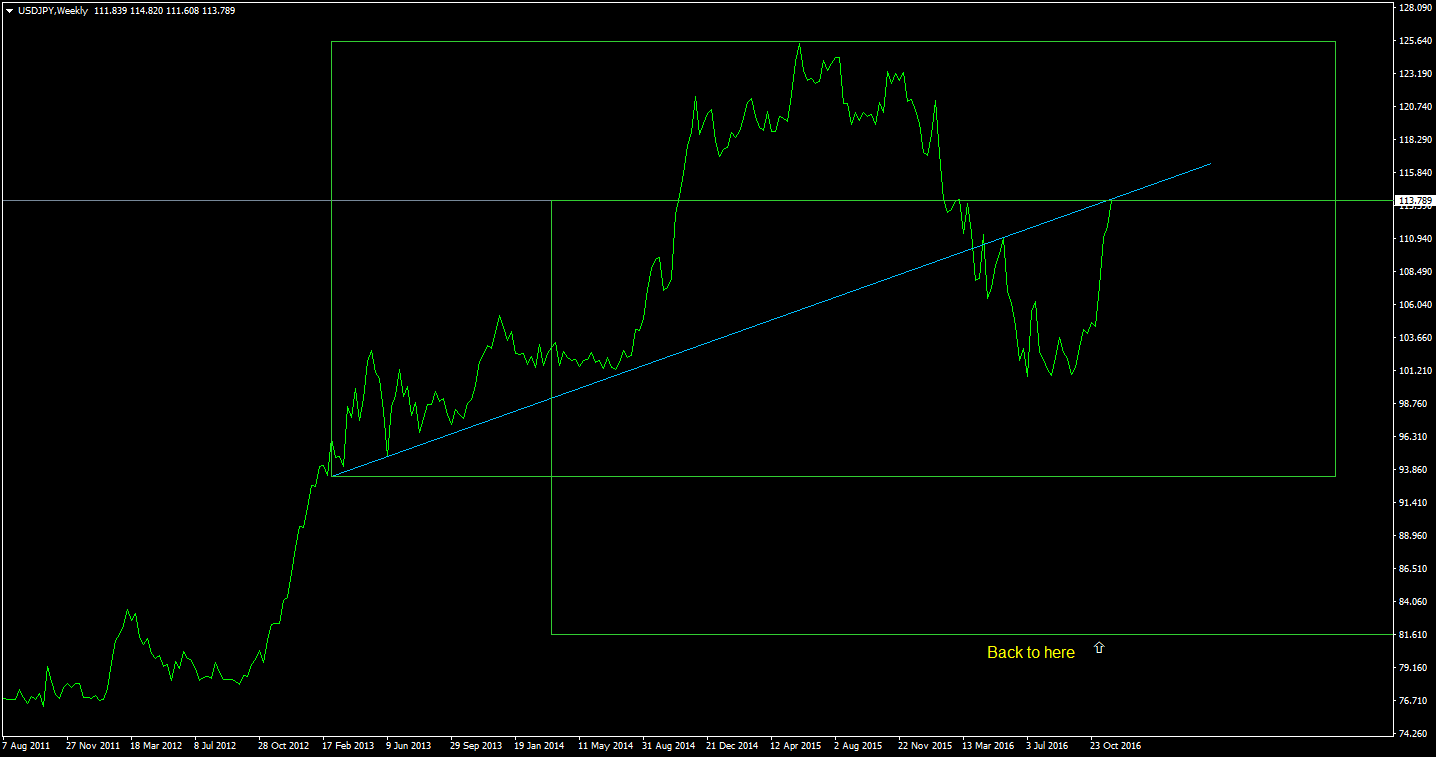
Those small boxes were nothing but a measured move inside a much larger pattern. This is the UJ weekly chart which suggests a massive sell off coming in UJ.
Weekly chart...
It's definitely interesting...I may look into it more to see how it aligns with my current method of trading. Could be another useful tool in the arsenal.
I was reading through his posts and he did mention that the lower time frames may not be as reliable since the larger trend is in charge.
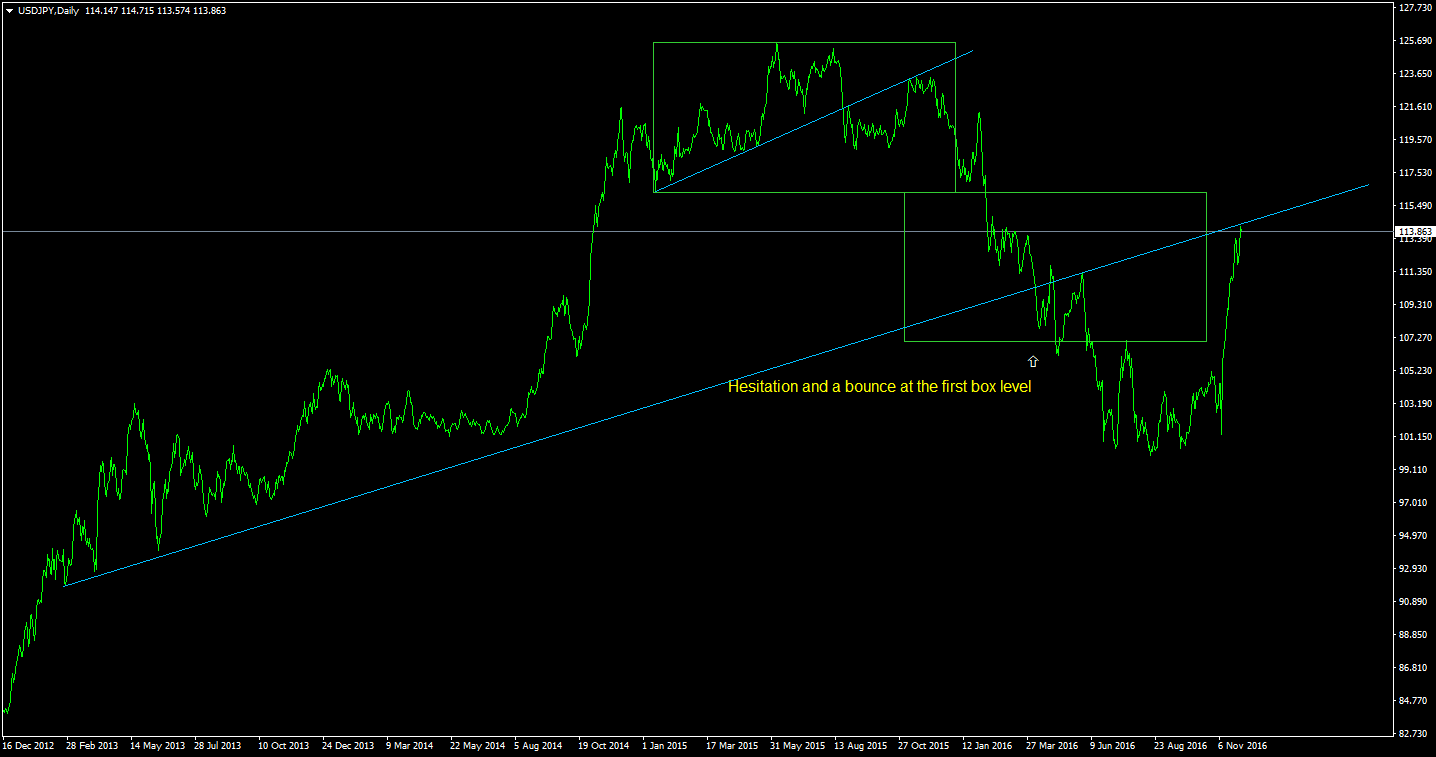
Here's another example showing another trend line break and retest and the measured move that followed afterward, along with a temporary recovery bounce at the bottom of the 2nd box.
UJ Daily chart again...
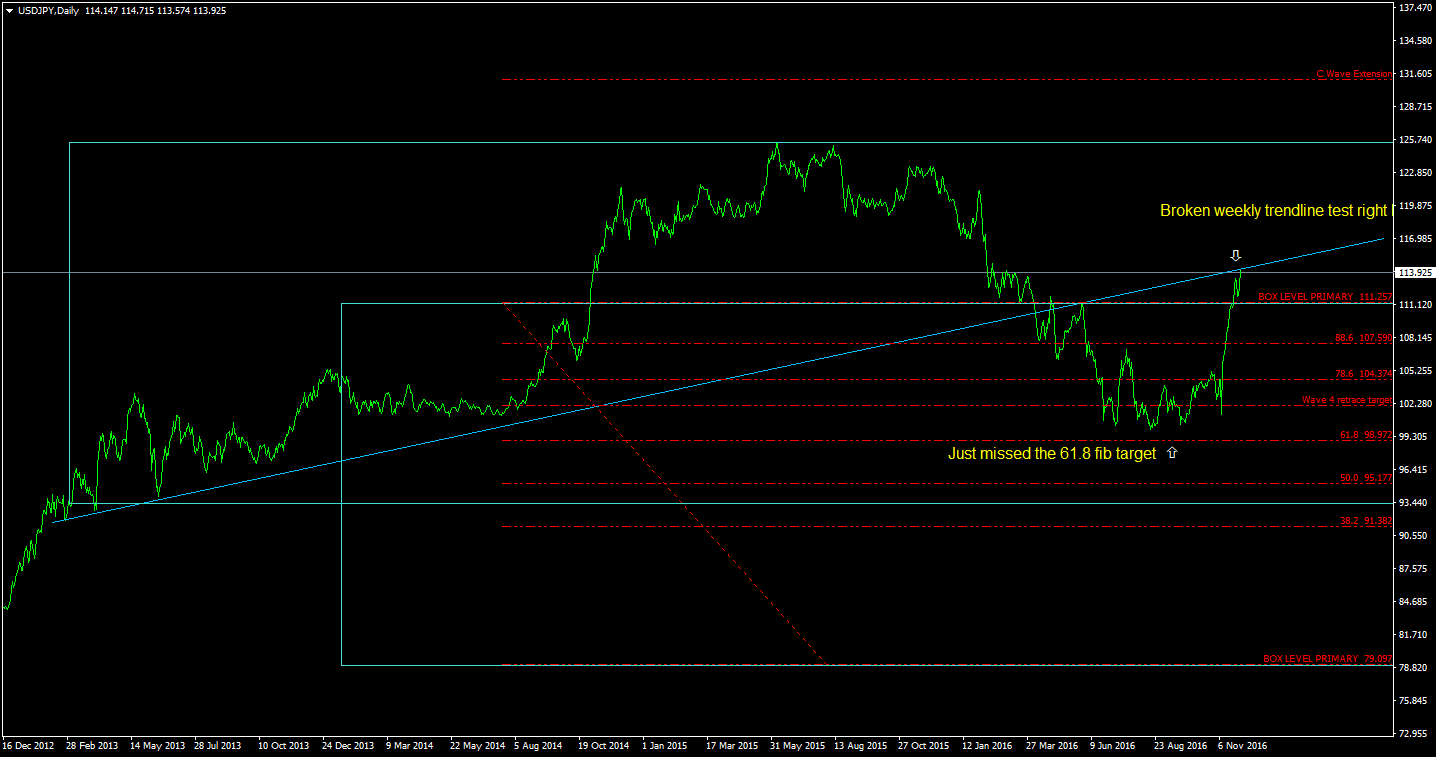
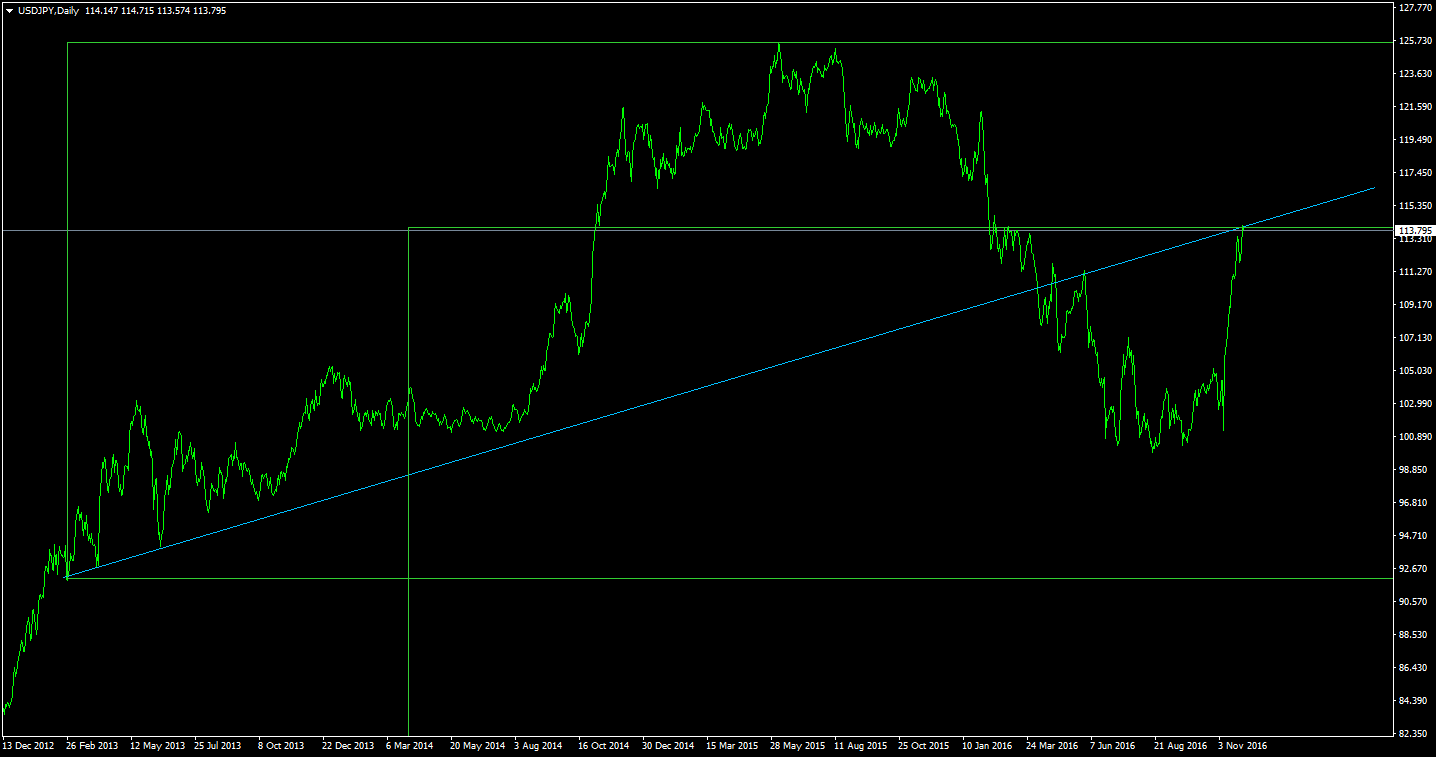
Interesting reading there Jav...makes sense, too. I used his method on the weekly and daily UJ charts...looks like his method and mine both agree that UJ is in for a nice move down soon. I'm only looking for 107 for the time being but the larger picture suggests a move all the way back down to the 82 area where the large uptrend move started.
Weekly UJ chart first and then daily chart showing more detail...
Looks like the final upward surge on UJ now in an exhaustion candle setup...I was hoping it would make one more new high before collapsing. That fits the pattern much better.

