 News
News  Market Data
  Discover
Support: 888-992-3836
Copyright © 2023 InvestorsHub Inc.


Attempting to add nano-particles of (K) to bottle of bucky-ball (C)60 to make it float in air..what are you doing?
tothe
![]()
Attempting to add nano-particles of (K) to bottle of bucky-ball (C)60 to make it float in air..what are you doing?
Register for free to join our community of investors and share your ideas. You will also get access to streaming quotes, interactive charts, trades, portfolio, live options flow and more tools.
Register for free to join our community of investors and share your ideas. You will also get access to streaming quotes, interactive charts, trades, portfolio, live options flow and more tools.
Attempting to add nano-particles of (K) to bottle of bucky-ball (C)60 to make it float in air..what are you doing?
GSAC charts~~~ Two bullish patterns in last four months where the first two months panic selling settled into two reversal patterns. The last two months show three valleys of higher lows.
https://thepatternsite.com/3rv.html
https://thepatternsite.com/udb.html
https://school.stockcharts.com/doku.php?id=chart_analysis:chart_patterns:double_bottom_reversal
* A brief on chart Indicators
https://investorshub.advfn.com/boards/read_msg.aspx?message_id=146368673
* Monday's AI Deep Forecast post... and the sellers should be exhausted by now so we should start serious accumulation.
https://investorshub.advfn.com/boards/read_msg.aspx?message_id=172211684
chart & T/A thread post
https://stockcharts.com/h-sc/ui?s=gsac&p=D&yr=0&mn=4&dy=0&id=p24986097784&listNum=23&a=1113701411

https://stockcharts.com/h-sc/ui?s=GSAC&p=30&yr=0&mn=0&dy=15&id=p24986097784&listNum=23&a=1113701411

ILUS ***institutional holdings,.Insider Holders.& Insider.Ownership, trading***
https://www.secform4.com/insider-holders/1496383.html
chart & TA post thread
https://stockcharts.com/h-sc/ui?s=ILUS&p=D&yr=0&mn=4&dy=0&id=p24986097784&listNum=23&a=1113701411

@Janet; Added link to Info Box (IBOX) tagged "GSAC Insider Trading Activity" under Share Structure header.
https://www.secform4.com/insider-trading/890725.htm
@Stalker; +chart~~~ .0009 is good today because there were a lot of profit takers embedded in the four days of 670mil volume last week. 
https://stockcharts.com/h-sc/ui?s=GSAC&p=W&yr=0&mn=11&dy=25&id=p34307943936&a=1105106922&listNum=2

GSAC chart~~~ Two bullish candlestick patterns today. The week of June 12 we had two sets of these in five days!
https://thepatternsite.com/MatchingLow.html
https://thepatternsite.com/TweezersBottom.html
* A brief on chart Indicators
https://investorshub.advfn.com/boards/read_msg.aspx?message_id=146368673
chart & T/A thread post
Technical EMA 8 -34 chart~~~ Try not to get too excited by the positive diversions of OBV and AccumDist are happening in a consolidation (seller flush) and retracement low just after a speculative run up.
* Trix
https://school.stockcharts.com/doku.php?id=technical_indicators:trix
https://stockcharts.com/h-sc/ui?s=GSAC&p=D&yr=0&mn=3&dy=0&i=p6680853606c&a=639143585&r=1548554336877

GSAC chart~~~ Two months with two Vertical Runs and one Double Bottom.
* First run up from .0002 to .0012 retrace to .0005 or 62%
Second run up from .0005 to .0017 retrace to .0008 or 70%
https://thepatternsite.com/VerticalRunUp.html
* Ugly Double Bottom in throwback to .0008
https://thepatternsite.com/udb.html
https://school.stockcharts.com/doku.php?id=chart_analysis:chart_patterns:double_bottom_reversal
chart & TA post thread
https://stockcharts.com/h-sc/ui?s=GSAC&p=D&yr=0&mn=3&dy=0&id=p24986097784&listNum=23&a=1113701411

@North; Good call on Fibs. The .0012 retrace was 62%, now the .0017 retrace is at 70%.
I picked up .0009's yesterday to be on the safe (North) side of 62%.
@Stalker +chart~~~ One wimpy sell in the first 15 minutes is not exactly a strong case for S2.
Buyers will not risk spilling their first cup of coffee of the day on their laptop!
https://stockcharts.com/c-sc/sc?s=GSAC&p=2&yr=0&mn=0&dy=1&id=p69741074503&a=1100650802&listNum=23

GSAC charts~~~ Ugly Double Bottom setup: yes, they do outperform the pretty ones.
Yes, the next leg up is more explosive, possibly leading to a gap up and throwback to fill it.
https://thepatternsite.com/udb.html
https://thepatternsite.com/ugly.html
https://school.stockcharts.com/doku.php?id=chart_analysis:chart_patterns:double_bottom_reversal
chart & TA post thread
https://stockcharts.com/h-sc/ui?s=gsac&p=D&yr=0&mn=4&dy=0&id=p24986097784&listNum=23&a=1113701411

15d 30min~~~ for closer development & decision making. Oh, sellers appear to be exhausted so now we are left with "now you see it and now you don't" technical bid/ask stacking.
https://stockcharts.com/h-sc/ui?s=GSAC&p=30&yr=0&mn=0&dy=15&id=p24986097784&listNum=23&a=1113701411

@Stalker +chart~~~; Agree. $0.0009 support puts us back to last Tuesday. The sellers were carless with market orders giving us a 23% erosion of the PPS. Suspect we saw small retail today who were buyers from two weeks ago at $0.0007 dumping for meager profits, a seller flush encouraged by buyers who casually stack the low bids. No problem, nothing we haven't seen before in the OTC swamp, we got five trading sessions to get back to $0.0012.
* Sorry for the late response I had to watch the grandkids today.
 BULLISH
https://stockcharts.com/h-sc/ui?s=GSAC&p=30&yr=0&mn=0&dy=10&id=p24986097784&listNum=23&a=1113701411

GSAC charts~~~ Good set up for next week, TA is with the charts.
https://school.stockcharts.com/doku.php?id=technical_indicators:on_balance_volume_obv
https://school.stockcharts.com/doku.php?id=technical_indicators:chaikin_money_flow_cmf
* A brief on chart Indicators
https://investorshub.advfn.com/boards/read_msg.aspx?message_id=146368673
chart & T/A thread post
10dy 30min~~~ Bullish shakeout with $0.0012 strong base for support next week.
* Short term bullish bias setting up with OBV diversion, CMF(60) the six day look back, PPO & PMO approaching signal line crossover.
https://stockcharts.com/h-sc/ui?s=GSAC&p=30&yr=0&mn=0&dy=10&id=p24986097784&listNum=23&a=1113701411

Daily ~~~ Second candle body over MA(200) or $0.0011. Powerful OBV diversion with CMF(60) agreeing. PPO & PMO signal lines crossed last week. You guys who are rabid RSI and MACD followers try not to freak out.
* Candlestick pattern continuation bias..
https://thepatternsite.com/8NewPriceLines.html
https://stockcharts.com/h-sc/ui?s=GSAC&p=D&yr=0&mn=3&dy=0&id=p24986097784&listNum=23&a=1113701411

@Burd; Thanks everyone. You guys did tremendous protection on $0.0012 support today. I do not subscribe to Level2 because I think it is a gateway drug to video games. However with my Fidelity account I can see dynamic bid-ask swapping between .0011 and .0013 sometimes as high as 6mil shares jumping between the two! Then during power hour there was some serious calls on these bluffs.... I think you guys are dangerous Poker Players!
GSAC weekly.chart~~~ Two bullish patterns for May.&.June..
* May 8 & 15 : Weekly Upside Reversal and we are still in it.
https://thepatternsite.com/WeeklyRevsUpside.html
* June 15 Open Close Reversal Downtrend two week retrace and resuming the upside.
https://thepatternsite.com/OCRD.html
chart &TA post thread
https://stockcharts.com/h-sc/ui?s=GSAC&p=W&yr=0&mn=11&dy=25&id=p34307943936&a=1105106922&listNum=2

GSAC chart~~~ Reminder we have completed three sessions of a four session week. We have packed a lot of volume in these last three days. Note that today's candle body (gravestone doji) closes over the MA(200).
* We satisfy this pattern because of + $0.0001 (8.70%) close gives us bullish bias to a continuation pattern.
https://thepatternsite.com/ShootingStar2.html
* This pattern needs a green candle tomorrow for a continuation.
https://thepatternsite.com/8NewPriceLines.html
  ADX Value    Trend Strength
   0-25         Absent or Weak Trend
   25-50        Strong Trend
   50-75        Very Strong Trend
   75-100       Extremely Strong Trend


@Stalker; I invite everyone to borrow the charts, that's why I keep links with the chart. I have "live" charts in the INFO box that I am currently constructing.
I use 'Microsoft Paint' for annotation. StockCharts keeps my charts because of heavy usage for their promotions. I do not have a StockCharts account currently, the chart templates you see are about two years old.
@BERKSHIRE; I keep projected valuation with the relative value of the current PPO crossover to the last major crossover of June 2022. During the past year there was small 64mil dilutive eguity financing. It is like saying the speed of light is constant but you have blue and red shifts corresponding to buy-back or dilution.... so PPO signal line crossovers are the closest thing we have to relativistic calculation.
Use the 1yr. 1m. chart to see the $0.002- $0.004's of June 2022 and follow the horizontal line that utilizes time telescoping back to the big bang.
https://school.stockcharts.com/doku.php?id=technical_indicators:price_oscillators_ppo
https://stockcharts.com/h-sc/ui?s=GSAC&p=D&yr=1&mn=1&dy=0&id=p24986097784&listNum=23&a=1113701411

A Trader (or Master of Fake Volume) doing ETF trades on his dual platform(s) and/or with different brokerages. This has been going on for years and makes the OTC casino the 'Speculators Paradise' with all those Unsolicited Bids flying around like confetti.
GSAC chart~~~ Today's $0.001 resistance flipped to support.
* RSI goldilocks and Williams%R agreeing over 50%
https://investmentu.com/relative-strength-index-rsi-ultimate-overbought-oversold-indicator/
* CMF(20) volume money pressure over 20% again and agreeing MFI the RSI of volume money
* OBV diverting up from AccumDist showing free trading float seriously winding up.
* ChiOsc the MACD of AccumDist line showing buyers outnumbering sellers/
* A brief on chart Indicators
https://investorshub.advfn.com/boards/read_msg.aspx?message_id=146368673
chart & T/A Post Thread
https://stockcharts.com/h-sc/ui?s=GSAC&p=D&yr=0&mn=5&dy=0&id=p24986097784&listNum=23&a=1113701411

Weekly volume turbulence watch
https://stockcharts.com/h-sc/ui?s=GSAC&p=W&yr=1&mn=0&dy=0&id=p34307943936&a=1105106922&listNum=2

@Gail; The compound chart is used for modest gains on the higher exchanges and the OTC. The indicators are plug-in values used in most common algorithms found on the internet. The chart forces us to use "wetware'' rather than someone's software in decision making.
* A brief on chart Indicators
https://investorshub.advfn.com/boards/read_msg.aspx?message_id=146368673
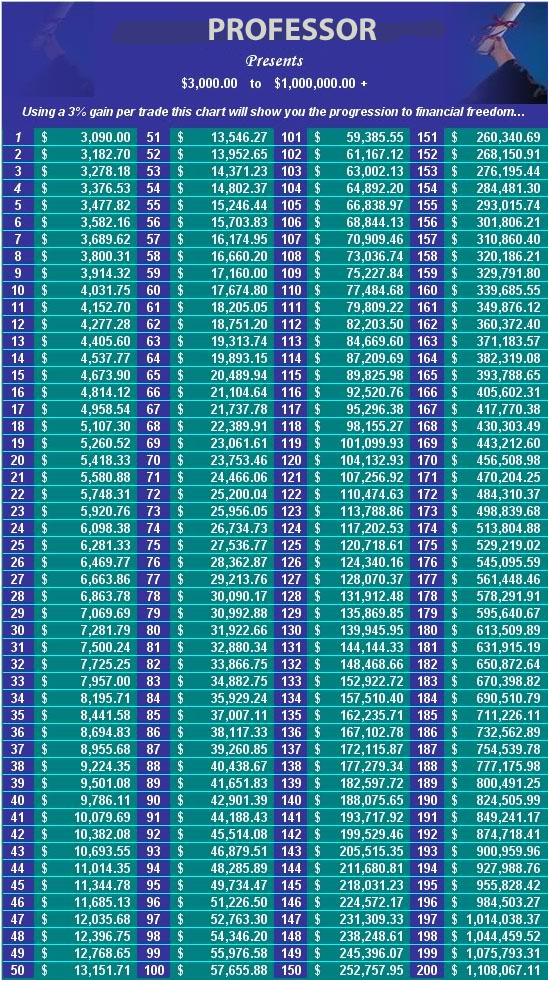
Compounding
The main focus here is to compound our gains. Too many people enter the stock market with the intent of trying to hit a home run. Swinging for the fences also gives you a high strike out ratio. It is important to compound your gains and go for the singles and doubles and you will find that you eventually hit triples and home runs as well. The chart below shows how you can turn only 3k into 1 million dollars in 200 steps. So join me in moving up the steps of our compounding gains chart. Compound those gains!
https://investorshub.advfn.com/boards/read_msg.aspx?message_id=125078854
GSAC compound chart~~~ AROON8 up from zero (\0/) was the first indicator signal, the others a day later.
chart thread post
Compound Chart
#1. AROON- 8 You watch as the AROON DOWN crosses the 75 down and the AROON UP comes up from zero. Most important. (\0/)
#2. WILLIAMS%R- 9 You watch the line cross the 50.
#3. CMF- 15 You will usually only see growth when the CMF is in the negative.
#4. ADX/DMI-5 You watch as the D+ line either crosses the D-, or crosses above the 20.
#5. MACD histogram- 5,15,10 You watch the negative bars register -50% smaller then the bar before it, or -50% smaller then the largest in the grouping.
#6. Full Stoch- 5,3 You watch the fast line cross the slow line while the AROON DOWN(8) crosses the 87.50. Crossing the 20 would be best, when the Williams agrees.
#7. Bollinger Band 20,2 You watch for the Magic Box to occur when the negative close touches above the lower bolly and the next day’s close to it is positive growth in a white candle.
#8. RSI 5 you watch as the indicator crosses above the 50 for a quick pop.
#9. MA(2) Watch the 2 day MA cross above the 5 day MA. That’s helpful.
#10. MA(2) To sell it just watch the 2 day MA kiss the bottom center of the red candle body.
https://stockcharts.com/h-sc/ui?s=GSAC&p=D&yr=0&mn=3&dy=0&id=p29397895492&listNum=23&a=1093863074

THE MAGIC BOX
(A) The Magic Box is a pure two-day pattern. Basically the "close" of a red candle printing on or near lower Bollinger Band with the next day printing an "open white candle."
A gift from The Seasonality Stock Reports Board
The reason that I named this setup the Magic Box was so that you could relate to it and remember it faster. Without relationship to something, it is nothing to us. It must be something memorable to you before you can set it into your subconscious mind and see it always.
(A1) On day one the Aroon Down is setting at 100 on the indicator and price is near the lower Bollinger Band. The Candlestick is dark-shadowed.
(A2) On day two, to form the Magic Box, the Aroon Down must drop to 87.50, and price to form a white candle, to complete the box. No other indicator is watched until this occurs for this setup, just the Bollinger Band and the Aroon Down.
If you see a Magic Box develop, that being, on the first day the Aroon Down going from 100.00 while the close is either on or just above the lower Bollinger Band and the second day the Aroon Down is now 87.50, you have a Magic Box.
(B) The buy opportunity occurs when the confirmation of two things happens: on day three or few days later the Aroon Down goes to 75.00 and the Williams%R comes above the -50%. That is the buy. The Williams must come through the -50%. It may take more than three days but you must wait for the confirmation of the William%R. I have seen again and again, the Aroon Down come down from 100.00 to zero without the Williams ever crossing the -50%, those are the ones you pass on. There will be no growth when this happens. At most there is consolidation or a small drop. During this process the Aroon Up can rise slowly but without the Williams you have nothing.
There are other Magic Boxes that develop in a stock's life cycle, too, and they, too, can give great growth. These are the supported median, the floating, and the rising Magic Boxes. The buy-in criteria, though, will remain the same for all of them. The Aroon Down comes to the 75.00 and the Williams crosses the -50%. June 7th, 8th, and 9th accomplish this in the 2007 HGR chart, though the William%R took until June 13th to confirm. You must wait.
Trading: It is highly recommended that you paper trade the system to familiarize yourself with it thoroughly. As with anything in life nothing is guaranteed, so, always use appropriate stop loss according to your risk tolerance.
Kenneth J. Goodrich
http://investorshub.advfn.com/SEASONALITY-STOCK-REPORTS-1616/
Example
http://investorshub.advfn.com/boards/read_msg.aspx?message_id=37119243
Sell trigger
https://investorshub.advfn.com/boards/replies.aspx?msg=40130527
Buyers are doing a good job picking up on the wash. The profit takers are holding cores of free shares so there really is no complete dump and the only "pump" today was my bullish chart. I followed (stalked) Dasqeezr to the chat room today and liked what I saw.
200mil volume !?
https://stockcharts.com/h-sc/ui?s=Gsac&p=D&yr=0&mn=4&dy=0&id=p24986097784&listNum=23&a=1113701411

GVSI weekly chart~~~ Candle body closed over 13 week EMA, also we are in the apex of a five week Symmetrical Triangle. The Primary Trend is up (50 week SMA) and we are on a rapid approach to resume a trip North.
https://thepatternsite.com/st.html
chart & TA post thread
BULLISH
https://stockcharts.com/h-sc/ui?s=GVSI&p=W&yr=1&mn=0&dy=0&id=p34307943936&a=1105106922&listNum=2

GDVM weekly chart~~~ Thursday catalyst brushed the 13 week EMA. Cyber security was also in the national news perhaps helped with the 20mil volume. Apparently we are on a lot of Value Investor radars. So we are back to waiting on FINRA, CUSIP, name change and full Q-2 financials..
https://twitter.com/veemost?s=21
Jun 15
$GDVM VeeMost's team is hard at work. We have begun establishing a partnership with one of the world's leading AI firms. Combined with our other partnership, we are prepared to deliver our clients with AI solutions.


@Cri5co: (charts) I agree on cyber attacks. With over 1000 shareholders of record we may have a high percentage of IT professionals keeping track of GDVM. Yesterday's innocent little progress report tweet (falls under 'Mid Month Shareholder Letter'?) resulted in two day's total volume of 15mil shares traded. Altogether that is a stunning reaction by Value Investors.... we are on a "Technical Radar".
Tweet reaction yesterday, vertical run up with retracement low, I am calling it non-speculative.
https://thepatternsite.com/VerticalRunUp.html
https://stockcharts.com/c-sc/sc?s=GDVM&p=5&yr=0&mn=0&dy=2&id=p69741074503&a=1100650802&listNum=23

Volume carried into following day
https://stockcharts.com/h-sc/ui?s=GDVM&p=D&yr=0&mn=3&dy=0&id=p29397895492&listNum=23&a=1093863074

GDVM 2d 5min Chart~~~ Big swings today, we may just snag a green Friday candle if this keeps up.
 BULLISH
* 2d 5min ~~~
VWAP refresher. EMA(30) for 21/2 hours, EMA(79) is all day.
https://school.stockcharts.com/doku.php?id=technical_indicators:vwap_intraday
https://stockcharts.com/c-sc/sc?s=GDVM&p=5&yr=0&mn=0&dy=2&id=p69741074503&a=1100650802&listNum=23

GDVM compound chart~~~ All indicators clicked today. The lower BB bounce is the hardest one to get to read on the compound charts, this one is one of the rare birds.... like in baseball: A straight steal of home.
chart & T/A thread post
Compound Chart
#1. AROON- 8 You watch as the AROON DOWN crosses the 75 down and the AROON UP comes up from zero. Most important. (\0/)
#2. WILLIAMS%R- 9 You watch the line cross the 50.
#3. CMF- 15 You will usually only see growth when the CMF is in the negative.
#4. ADX/DMI-5 You watch as the D+ line either crosses the D-, or crosses above the 20.
#5. MACD histogram- 5,15,10 You watch the negative bars register -50% smaller then the bar before it, or -50% smaller then the largest in the grouping.
#6. Full Stoch- 5,3 You watch the fast line cross the slow line while the AROON DOWN(8) crosses the 87.50. Crossing the 20 would be best, when the Williams agrees.
#7. Bollinger Band 20,2 You watch for the Magic Box to occur when the negative close touches above the lower bolly and the next day’s close to it is positive growth in a white candle.
#8. RSI 5 you watch as the indicator crosses above the 50 for a quick pop.
#9. MA(2) Watch the 2 day MA cross above the 5 day MA. That’s helpful.
#10. MA(2) To sell it just watch the 2 day MA kiss the bottom center of the red candle body.
https://stockcharts.com/h-sc/ui?s=GDVM&p=D&yr=0&mn=3&dy=0&id=p29397895492&listNum=23&a=1093863074

THE MAGIC BOX
(A) The Magic Box is a pure two-day pattern. Basically the "close" of a red candle printing on or near lower Bollinger Band with the next day printing an "open white candle."
A gift from The Seasonality Stock Reports Board
The reason that I named this setup the Magic Box was so that you could relate to it and remember it faster. Without relationship to something, it is nothing to us. It must be something memorable to you before you can set it into your subconscious mind and see it always.
(A1) On day one the Aroon Down is setting at 100 on the indicator and price is near the lower Bollinger Band. The Candlestick is dark-shadowed.
(A2) On day two, to form the Magic Box, the Aroon Down must drop to 87.50, and price to form a white candle, to complete the box. No other indicator is watched until this occurs for this setup, just the Bollinger Band and the Aroon Down.
If you see a Magic Box develop, that being, on the first day the Aroon Down going from 100.00 while the close is either on or just above the lower Bollinger Band and the second day the Aroon Down is now 87.50, you have a Magic Box.
(B) The buy opportunity occurs when the confirmation of two things happens: on day three or few days later the Aroon Down goes to 75.00 and the Williams%R comes above the -50%. That is the buy. The Williams must come through the -50%. It may take more than three days but you must wait for the confirmation of the William%R. I have seen again and again, the Aroon Down come down from 100.00 to zero without the Williams ever crossing the -50%, those are the ones you pass on. There will be no growth when this happens. At most there is consolidation or a small drop. During this process the Aroon Up can rise slowly but without the Williams you have nothing.
There are other Magic Boxes that develop in a stock's life cycle, too, and they, too, can give great growth. These are the supported median, the floating, and the rising Magic Boxes. The buy-in criteria, though, will remain the same for all of them. The Aroon Down comes to the 75.00 and the Williams crosses the -50%. June 7th, 8th, and 9th accomplish this in the 2007 HGR chart, though the William%R took until June 13th to confirm. You must wait.
Trading: It is highly recommended that you paper trade the system to familiarize yourself with it thoroughly. As with anything in life nothing is guaranteed, so, always use appropriate stop loss according to your risk tolerance.
Kenneth J. Goodrich
http://investorshub.advfn.com/SEASONALITY-STOCK-REPORTS-1616/
Example
http://investorshub.advfn.com/boards/read_msg.aspx?message_id=37119243
Sell trigger
https://investorshub.advfn.com/boards/replies.aspx?msg=40130527
GDVM chart~~~ PSAR flip positive today. Looks like we are headed multiple PSAR flips like the October thru December blue sky run to $0.11.
This time it is not a share reduction but a Cibersecurity AI partnership. I am disappointed that last month's profits and revenues were ignored. We should have been at $0.10 last week but you can't stop Rabid OTC Traders from playing self immolation head games with each other.... jerks.
Watch for the usual suspects do market order profit taking that results in Intraday PPS erosion.
chart & TA thread post
https://stockcharts.com/h-sc/ui?s=GDVM&p=D&yr=0&mn=10&dy=0&id=p24986097784&listNum=23&a=1113701411

GDVM midweek chart~~~ PSAR shorting tool flipped negative 15 days ago or four days after May 23 "earnings surprise" 10Q. Stock price and trend appears illiquid in the post earnings positive news because Speculative Traders are slowly exchanging millions of shares at "best price" with OTC Value Investors... read consolidation.
Remember Q1 was less than 30 reporting days so this current consolidation could last into a full reporting Q2! So the best strategy is to HOLD or play 'auction market' to accumulate for a best buy as the seller looks for a best sell... go figure that one out.
* ChiOsc (MACD of Accum Dist line) trending positive for five days as the PPS tanks showing MM's accumulating for a run.
* MFI (RSI of Volume Money) is choppy but is in the goldilocks zone over 20%.
* CMF(20) showing positive buying pressure.
* OBV showing dilutive diversion... this may be Broker Dealers borrowing from the DTC or as I like to put it "counterfeit dilution".
* Event pattern
https://thepatternsite.com/earnsgood.html
* PSAR shorters tool
https://school.stockcharts.com/doku.php?id=technical_indicators:parabolic_sar
* RSI and Goldilocks
https://investmentu.com/relative-strength-index-rsi-ultimate-overbought-oversold-indicator/
* A brief on chart Indicators
https://investorshub.advfn.com/boards/read_msg.aspx?message_id=146368673
chart & T/A thread post
BULLISH
https://stockcharts.com/h-sc/ui?s=GDVM&p=D&yr=0&mn=10&dy=0&id=p24986097784&listNum=23&a=1113701411

Uroca; one movement (the middle) of your symphony has to reflect the violent and dramatic clash of manipulative Speculators and calm Investors. Wind instrument's and percussion should bring out the proper mood but closing out with strings as the Longs emerge victorious.
AccumDist is on this live chart showing a healthy positive diversion...... we have one in the INFO Box too if anyone ever looks there.
This ballad fits GDVM as its discovery by.investors. We are in an OTC Turf War. Right now we are going through manipulation because we are sucking OTC money from the other Speculative Traders turf.
Back to pink current, updated INFO Box under "Share Structure" header.
Annotated the the dates with the whole merry chase from shell, limited and reinstatement.
your P/E 4 is more accurate..... I was using profits as a divisor. 
I gotta see if you guy are awake...
Agree. GDVM 17 P/E ratio looks about right. 10-Q's are better than any PR in my book.
GDVM monthly chart~~~ Oh, bring back the heady days of November -December lows! The December retracement was the blow-back from October 90% share reduction.
The six months difference now is we have merged, a CISCO Partner, a second A/S reduction and have revenues with real profits. Now we are waiting for the CUSIP change followed by Attorney Letter to OTC Markets.
Now we can project without any uncertainty and risk where we will be in twelve months....Oh, don't forget the Price-To-Earnings Ratio to factor into your projections (a rare animal not seen in the OTC).
chart &TA post thread
BULLISH

https://stockcharts.com/c-sc/sc?s=GDVM&p=M&yr=1&mn=0&dy=0&i=p04068199646&a=548294540&r=1537108215884

Re. the yield sign: OTC Markets has a habit of "Mickey Mouse nickel and dime you to death".
My suggestion to Melvin is to kick ass and wait for the FINRA CUSIP change and leave the onus for the OTC Markets to drop the yield sign free of charge.
Page F-14
As of March 31, 2023, the Company has recorded $27,269 in related party notes payable, which relates to transfer agent fees, accounting services, state franchise taxes, and OTC Markets fees.
@HoldEm: Good call!!! The last week did start with the Bearish Tri-star so lets wait for the breakout up in five more days into the ten day count.
https://thepatternsite.com/TriStarBear.html
chart & TA post thread
 BULLISH
https://stockcharts.com/h-sc/ui?s=GDVM&p=D&yr=0&mn=3&dy=0&id=p29397895492&listNum=23&a=1093863074

GDVM weekly.charts~~~ Post 10-q continuation now waiting Veemost CUSIP.
* May 23 catalyst: Quarterly Report for Quarter Ended March 31, 2023
https://www.otcmarkets.com/otcapi/company/financial-report/371847/content
* May 15 catalyst : Notification of Late Filing - Yield designation added
https://www.otcmarkets.com/otcapi/company/financial-report/370382/content
* An April 20 catalyst: Veemost retains an industry specific Washington DC based PR firm.
https://www.globenewswire.com/news-release/2023/04/20/2651297/0/en/VeeMost-Technologies-Retains-Amsterdam-Group-Public-Relations.html
* Another A/S reduction & 10-K Friday, March 31
https://t.me/otcupdates/45101
https://www.otcmarkets.com/otcapi/company/financial-report/363732/content
https://www.otcmarkets.com/otcapi/company/financial-report/363750/content
* Supplemental Information Information; Change in Shell Status March 9
https://investorshub.advfn.com/boards/read_msg.aspx?message_id=171399022
* FINRA countdown begins February 14
https://www.globenewswire.com/en/news-release/2023/02/14/2607911/0/en/Global-Developments-Holdings-Inc-Executes-Merger-with-VeeMost-Technologies-LTD-A-Cloud-and-Cybersecurity-Company.html
* Melvin's & VeeMost listed progress Tweets
https://twitter.com/MelvinEjiogu
https://twitter.com/veemost?s=21
* January 5 name change
https://investorshub.advfn.com/uimage/uploads/2023/1/20/ugundFmr31f4XwAE3jRT.png
~~~ I have bundled the TA with the individual charts to match the timelines.
* Cover volume increase to 23mil.
https://marketwirenews.com/stock/gdvm/short/
* Fee rate ~~~ Now increased to 11.6%
https://iborrowdesk.com/report/GDVM
* Four stages of the market
https://www.swing-trade-stocks.com/stock-market-stages.html
* Float Lock Down. Tight float is indicated by positive diversion of OBV on daily chart.
https://investorshub.advfn.com/boards/read_msg.aspx?message_id=170582707
* A brief on chart Indicators
https://investorshub.advfn.com/boards/read_msg.aspx?message_id=146368673
chart & T/A thread post
    Authorized Shares         850,000,000  03/31/2023
                              1,500,000,000 11/03/2022
                              6,000,000,000 10/24/2022
    Outstanding Shares          368,333,637 10/27/2022
                              3,518,333,637 10/24/2022
            Restricted           43,588,669 10/27/2022
                              3,193,588,669 10/24/2022
          Unrestricted          324,744,968 10/24/2022
           Held at DTC          324,149,280 10/24/2022
                 Float          Not Available
   Shareholders of Record:    1,000 as of date: March 31, 2023
    https://www.otcmarkets.com/stock/GDVM/security


I noticed that too last week, I was waiting for others to comment on it.
OTC Markets is a profit center "exchange" ... the late 10Q last week popped up the yield sign.
Now Melvin has to pay a fee to have it dropped just like the Shell to Shell Risk change..


