 News
News  Market Data
  Discover
Support: 888-992-3836
Copyright © 2023 InvestorsHub Inc.


DOW 18,000 ?
nowwhat2
![]()
DOW 18,000 ?
Register for free to join our community of investors and share your ideas. You will also get access to streaming quotes, interactive charts, trades, portfolio, live options flow and more tools.
Register for free to join our community of investors and share your ideas. You will also get access to streaming quotes, interactive charts, trades, portfolio, live options flow and more tools.
DOW 18,000 ?
Hey - Sounds like a great idea (NOT) !.....I'll call it :

Or,
The Basics of Technical Analysis

Screw that. If people are too disinterested or even lazy to delve into the very basics of "Technical Analysis", then I sure ain't gonna teach 'em...ha
Every method I deploy I learned from about a six page brochure back in around 1995 (which, admittedly I wish I still possessed). It was titled "The Basics of Technical Analysis", or something to that effect.
It covered - Support / Resistance / Trend lines / Breakouts / Price Gaps / Volume / Moving Averages, period.
You figure I should recollect and re-author that brochure when nowadays we have something known as the internet ?
Well, you're probably right - I probably should, but it'd probably take at least 20 hours of work
Besides, much of my stuff's made to be self-explanatory, for example :

Sorry (to all) but my writing a paragraph to explain something like that is just not gonna happen :
Especially during trading hours !
PS : This post here just took me about an hour and a half to write.....
For ME writing doesn't come EASY
Y'know, it doesn't take a genius to figure this out and yet....
I'm the only one here to have ever mentioned this line :
And all I get is disrespect (he-he)
Just Google the term "backtest" and you'll probably find more or less that what I mean...

SPY fighting back here somewhat - WEEDs' line (here : https://investorshub.advfn.com/boards/read_msg.aspx?message_id=144786409 ) still trying to hold.

Fairly stiff premium for those calls :
Stock would hafta be above 57.50 by Dec 21st (last date shown on chart)
Actually looks like it could wind up range-bound - within the 2 lines drawn
And that would "fit in" with The (perceived) Broad Markets' Outlook
Update : Next test : (just passed thru this line).....Next stop : $50 bucks.....nw 2018


.
Well...Might as well bid around $50-ish here....(for those who're thinking of adding - or trading options)
Well, it's taking its' time but it seems to be happening....
Ain't it amazing what straight lines can DO ! ? !
Currently trading at 51.81 (not shown in chart below)

.
So the "inferior" companies will be reporting first ?....
That might not bode well for WEED's (near-term) share price !
True or False - Agree ?
Yes, indeed - nice call....Nice "scouting report"
You like the Hugh Hewitt Show ?
LoL - Agreed. Thanks
Still had hair then man (perhaps in the 30's).....Not any more though man !....
Plus, wasn't even INTO stock charts then !....

Sure am NOW tho eh ?....This from (I think) Monday this week.....Already was seeking this here Pullback

Would LIKE to see (youthful?) photos of OTHER WEED Members !
C'mon eh guys - Cheers !
PS : You can tell I was fairly depressed back then (or high)
Beloved Mother to the right - NOW we look alike !
Well THAT'S certainly good to know....Holy smokes. Thanks....
ALL of 'em before the bell ?....LoL : Who knows ! ?
But thanks
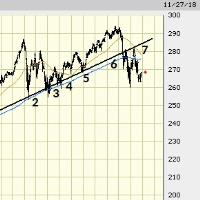
0,1,2,3,4,5,6


Meant to post these yesterday :

From a few days earlier : Climbed all the way up to (the above charts') Resistance....and last night came back to the line.

It's just hard to get long in THIS historical context


SPY (see top chart)

Also consider overseas indices
https://investorshub.advfn.com/boards/read_msg.aspx?message_id=144771047
Well looky thar.....Ain't THAT some decent "Pull-back" there....

I wonder if this all could be ascribing to my (Tuesdays' original) Clonk ! Theory....

Since things always tend to overshoot by a tad, this one overshot by a considerable lot (by spiking all the way up to 62)
Before the Clonk ! set in.
Current low now = 51.59 so.....
It's NOW overshot the Black Line (to the downside) by a considerable lot
Should probably be getting long right now - instead of composing (and wasting my time on) THIS !
Yeah well, that's about what we figured alright.....Now what ?


.
My oh my....Sorry to have to report my friends but :
Seems things may have just taken quite a turn for.....the worse.....IMHO
The Tokyo 24,000 Level Woes....(and now its' 200 day sma)

This was from......Monday (as can be clearly seen)

And but this is the chart showing.....the 27 years ago : . I've had my eye(s) on this level for....years.

My oh my....Sorry to have to report my friends but :
Seems things may have just taken quite a turn for.....the worse.....IMHO
The Tokyo 24,000 Level Woes....(and now its' 200 day sma)
This was from......Monday (as can be clearly seen)
And but this is the chart showing.....the 27 years ago : . I've had my eye(s) on this level for....years.
If it should continue to drop from where it is now (see top chart), well, that's why I'm using the phrase "My oh my"....
Lithiums Overseas :
Rally appears somewhat short-lived....LAC today down 7.8 %

Lithiums Overseas :
Rally appears somewhat short-lived....LAC today down 7.8 %
What Currency are those Index charts in ?.....
Gosh, Uh I don't know - Those there are INDEX Levels, right ?
Of the Tokyo Nikkei DOW Index....
What currency is the S&P 500 Index ?
I believe it has nothing to do with "dollars"....
It just Is what it is - It's a basket of companies....
You raise some good points indeed - For sure....
But man......I just can't see pot ever being LEGAL in Spain !

Thems Guardia Civil are far too "upright" to allow THAT....IMHO.
.
Well, LoL - I just wouldn't be the same "chick-magnet" now as back then !

.
My oh my....Sorry to have to report my friends but - Things have just taken quite a turn for.....the worst.
This was from......Monday (as can be clearly seen)
And but this is the chart showing.....the 27 years ago : . I've had my eye(s) on this level for....years.
If it should continue to drop from where it is now (see top chart), well, that's why I'm using the phrase "My oh my"....
And if you don't think that this will have an impact upon all markets well....* Just a Heads Up for those who might be caught "unawares'.
Mind you - There's ALWAYS a bull market somewhere's (as they say)......and PERHAPS this time it'll BE in marijuana....
But.....Not without some kind of impact upon The Sector
.
Thanks surf !....How ya' doin' ?...
High today 4.25 Low 3.98 - Last 4.00.....Wild "Backtest" ?....hmmmm, I wonder.....
Or maybe - Just more of the same !.....LoL !

7,8,9,10 ?
.
I'm a landscaper not a computer programmer.
You want me to provide charts which when someone hovers over them they'll display all kinds of extra info ?
Awwww....man....
You guys are killin' me here today...
Maybe because your stock is down 8 percent
Requesting that I include explanations ?....


Not too much of a distraction today that has generated....
You know how much effort it takes to do my posts ?
And how much effort does it take for someone to say November 16 46 puts
Strike and expiry date if you could please ?
Awww crap !....Just lost an accompanying narrative here
So yer gonna hafta figure it on out yerselves....
Compare :


It's handled both the election and feds quite well so onwards to this prev. outlined target :
ie Run up into Earnings ?......Nope - The 10 day (below) has just majorly failed

This 10 day's just majorly failed !....Last seen at 55.35....HAS reacted to the feds ?

Mostly just sarcasm mx rest assured - Takes a lot for me to finger and I certainly didn't sense a need to from your politness.
But - Are you ACTUALLY requesting me to do up TWO charts for each and every time I post ? One CGC plus also one WEED ?
Plus, wrestle with providing verbal explanations ?
Man....Why would I wrestle thru all of that when my efforts garner nothing but flak in the first place ?
Sorry for just assuming that they're often self-explanatory....
![]()
Plus sorry for not drawing up BOTH CGC and WEED stock charts for each and every time I post
0,1,2,3,4,5,6 - Call me Crazy eh ?
.
The Next Black Line.....
nw2018
I also try to find the humour whilst analyzing charts as tho they were crystal balls (for the purpose of assisting retail investors - With the intention of shedding some light)....
For example like here ; Over at Sunniva :
https://investorshub.advfn.com/boards/read_msg.aspx?message_id=144744683
A retail investors' response to that info :
https://investorshub.advfn.com/boards/read_msg.aspx?message_id=144746147
How Traders think :

That's how Traders think.
.
The (Jeff) Sessions news hit HERE :
This morning the price has been "retreated back" (or back-tested) to when it first struck.

Wow - That was decent long entry right there (I think)

Assuming ones' target is higher (like say $ 49 - $ 50 for now) :

Should'a been payin' more attention
Ok so - Learned anything yet ? What did he say ?
Would like to obtain insider info !
Thanks
I may be wrong but I think clearly the story here should be its' chart

Mind you, we have seen their chart do some weird things before :

And I did perform this horrible analysis of it last week :

Given that that was its' VERY low....
It's up 25 % off of that low !
So evidently I'm just not very good at this stuff and should stick with mowing lawns.
I'll NEVER get rich with this type of analysis.....I am such a loser....

