Register for free to join our community of investors and share your ideas. You will also get access to streaming quotes, interactive charts, trades, portfolio, live options flow and more tools.
For what it's worth.....

Actually hit a low of 31.......Last 35
https://bigcharts.marketwatch.com/advchart/frames/frames.asp?show=&insttype=&symb=nik&x=36&y=17&time=8&startdate=1%2F4%2F2020&enddate=12%2F30%2F2024&freq=1&compidx=aaaaa%3A0&comptemptext=&comp=none&ma=1&maval=50+200&uf=0&lf=1&lf2=0&lf3=0&type=2&style=320&size=3&timeFrameToggle=false&compareToToggle=false&indicatorsToggle=false&chartStyleToggle=false&state=11
.
It depend on 18,000 and also on 3000
https://bigcharts.marketwatch.com/advchart/frames/frames.asp?show=&insttype=&symb=hangseng&x=42&y=24&time=7&startdate=1%2F4%2F2014&enddate=7%2F10%2F2024&freq=1&compidx=aaaaa%3A0&comptemptext=&comp=none&ma=1&maval=50+200&uf=0&lf=1&lf2=0&lf3=0&type=2&style=320&size=3&timeFrameToggle=false&compareToToggle=false&indicatorsToggle=false&chartStyleToggle=false&state=11
https://bigcharts.marketwatch.com/advchart/frames/frames.asp?show=&insttype=&symb=cn%3Ashcomp&x=44&y=10&time=7&startdate=1%2F4%2F2014&enddate=7%2F10%2F2024&freq=1&compidx=aaaaa%3A0&comptemptext=&comp=none&ma=1&maval=50+200&uf=0&lf=1&lf2=0&lf3=0&type=2&style=320&size=3&timeFrameToggle=false&compareToToggle=false&indicatorsToggle=false&chartStyleToggle=false&state=11

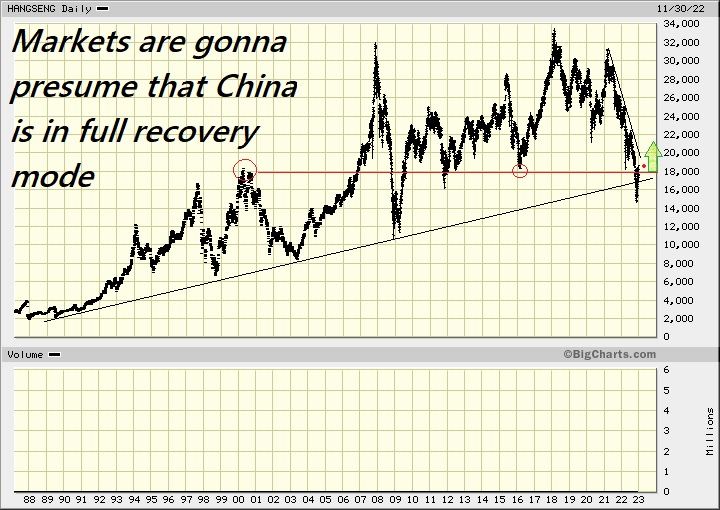
I doubt many folks are aware of this chart and that most are simply "hearing" that
China's re-opening and are presuming that everything's gonna play out hunky-dory......
Whereas personally I wouldn't be that presumptuous, given where the darned this is.
How it performs next week will be of vital importance :
I suspect that things are just that simple.
.
True.....Determining Bitcoins' future must be ;
......based on many factors including how General charts move , volumes, economic conditions , historic trend analysis ... etc....
https://www.investing.com/news/stock-market-news/us-listed-chinese-stocks-tumble-on-concerns-about-xis-third-term-432SI-2919953?dicbo=v2-b2aea8281e2fbe9f59f6fc63a6a04e3f
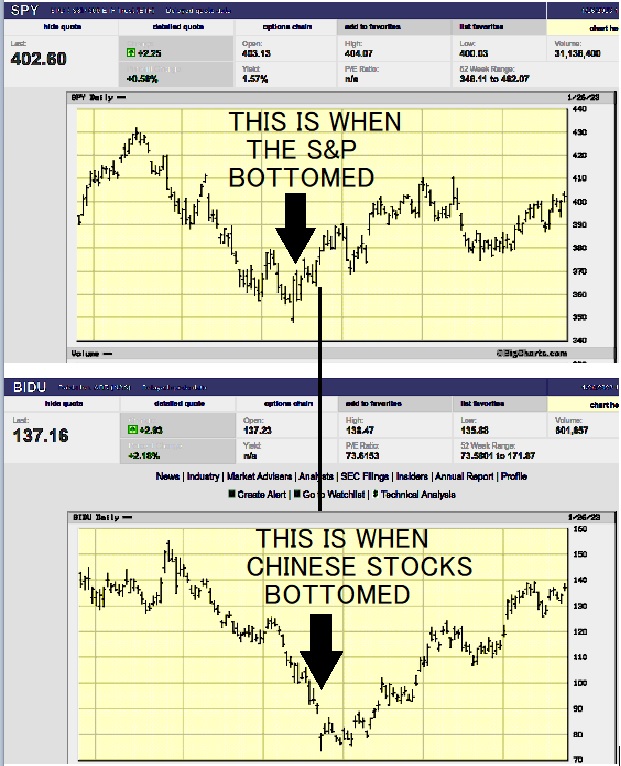
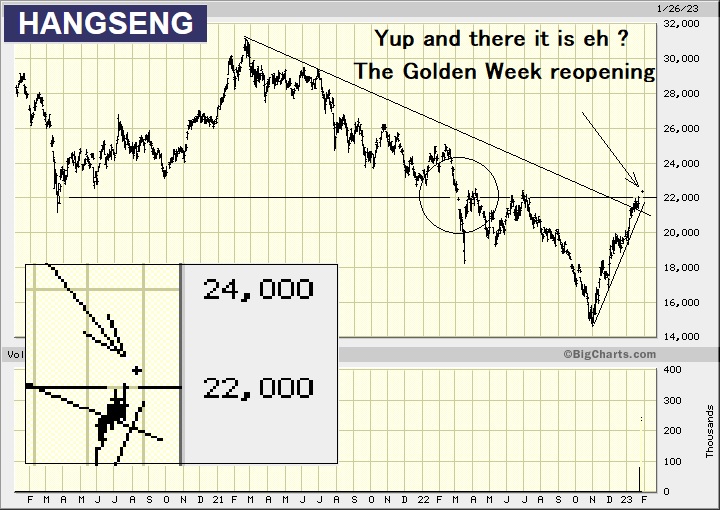
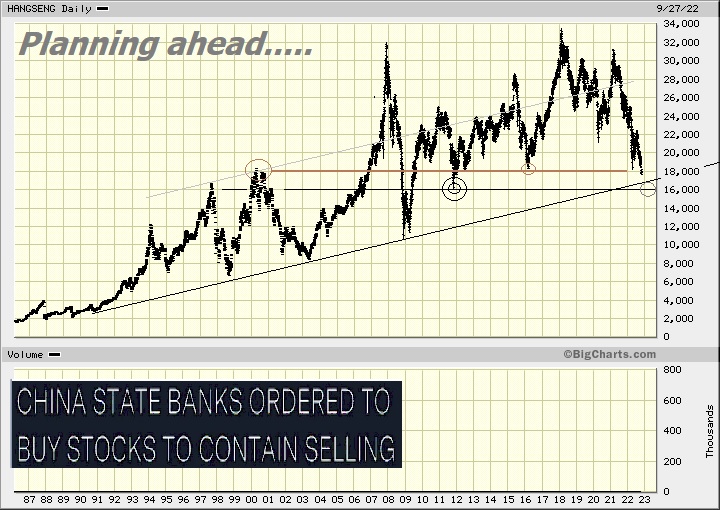
Please provide your insights on that (those) this ;
Was(n't) Chinas' low made because Xi-Ping was reinstated for another 5 years ?
Have markets actually LIKED that news ?......Or, has the ensuing rally been some kind of "deke" ?
5 more years of Xi-Ping :
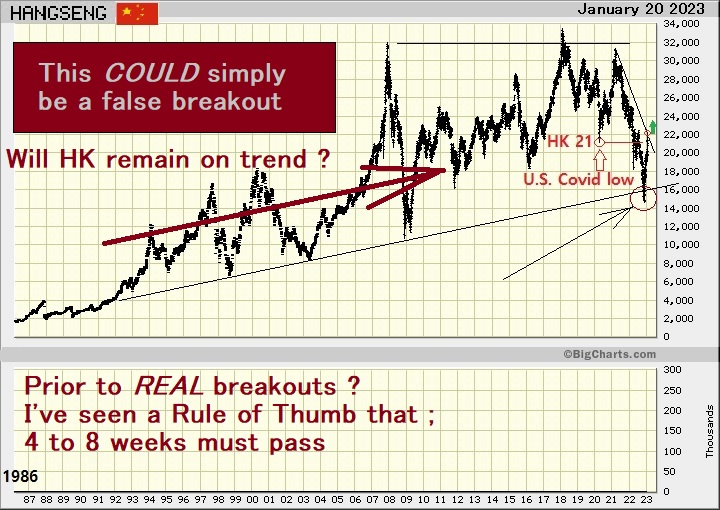
hmmmmmmm...........
.
.
Mission Accomplished :


Friday Jan. the 20th

Tuesday the 17th

AN ENGINEERED MARKET BOOM !..........
I HATE these freaking "Golden Weeks"......... Japan (I think) has two.
I HATE seeing markets get "engineered".......I wish "they'd" just leave them alone.
https://investorshub.advfn.com/boards/read_msg.aspx?message_id=170958427
.
Don't believe me ?.......Check it out :
https://bigcharts.marketwatch.com/advchart/frames/frames.asp?show=&insttype=Index&symb=hangseng&x=47&y=11&time=6&startdate=2%2F4%2F2015&enddate=6%2F19%2F2023&freq=1&compidx=aaaaa%3A0&comptemptext=&comp=none&ma=0&maval=9&uf=0&lf=1&lf2=0&lf3=0&type=2&style=320&size=3&timeFrameToggle=false&compareToToggle=false&indicatorsToggle=false&chartStyleToggle=false&state=9
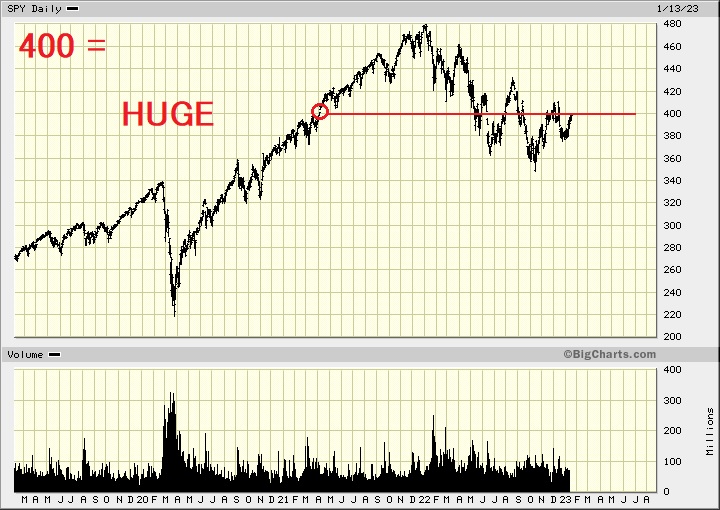
American Professional Bank Fraud Week (last week)............Okay so, who's next (and when)
Might Apple or someone like that be on deck ?
Regardless,
Surely the Nikkeis' 24 must be a Giant Magnet !
https://bigcharts.marketwatch.com/advchart/frames/frames.asp?show=&insttype=&symb=nik&x=43&y=16&time=100&startdate=2%2F4%2F2015&enddate=6%2F19%2F2023&freq=1&compidx=aaaaa%3A0&comptemptext=&comp=none&ma=0&maval=9&uf=0&lf=1&lf2=0&lf3=0&type=2&style=320&size=3&timeFrameToggle=false&compareToToggle=false&indicatorsToggle=false&chartStyleToggle=false&state=9
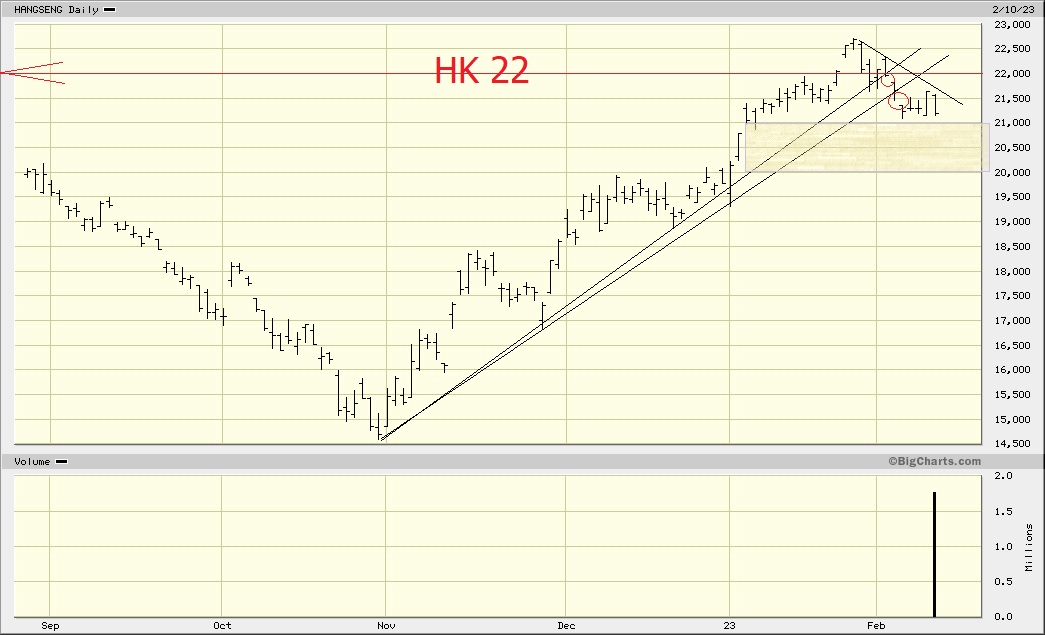
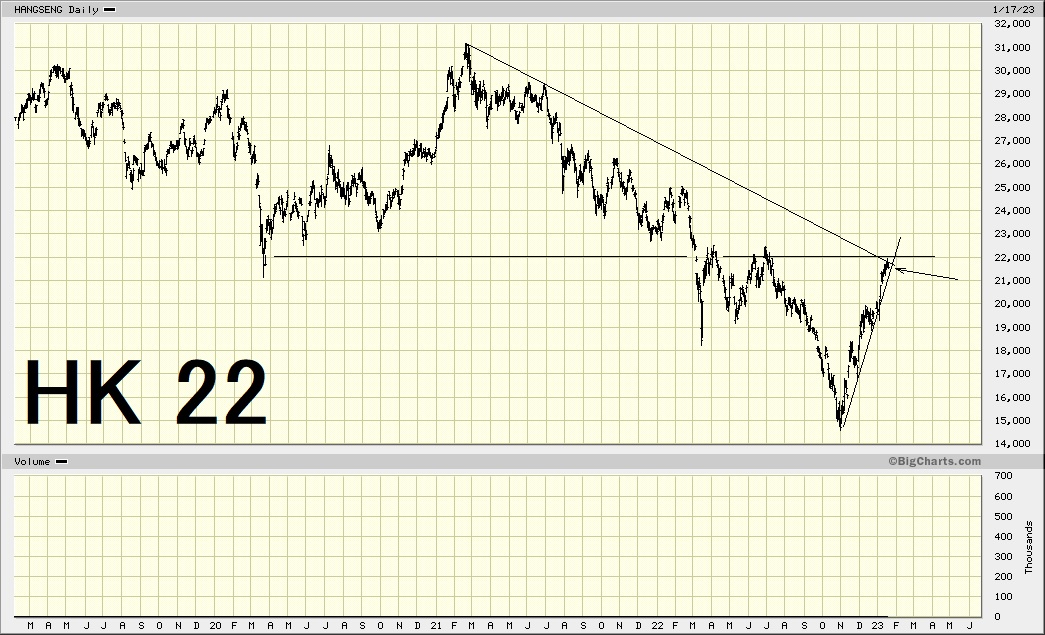
HK 22
https://bigcharts.marketwatch.com/advchart/frames/frames.asp?show=&insttype=Index&symb=hangseng&x=34&y=17&time=100&startdate=2%2F4%2F2015&enddate=6%2F19%2F2023&freq=1&compidx=aaaaa%3A0&comptemptext=&comp=none&ma=0&maval=9&uf=0&lf=1&lf2=0&lf3=0&type=2&style=320&size=3&timeFrameToggle=false&compareToToggle=false&indicatorsToggle=false&chartStyleToggle=false&state=9
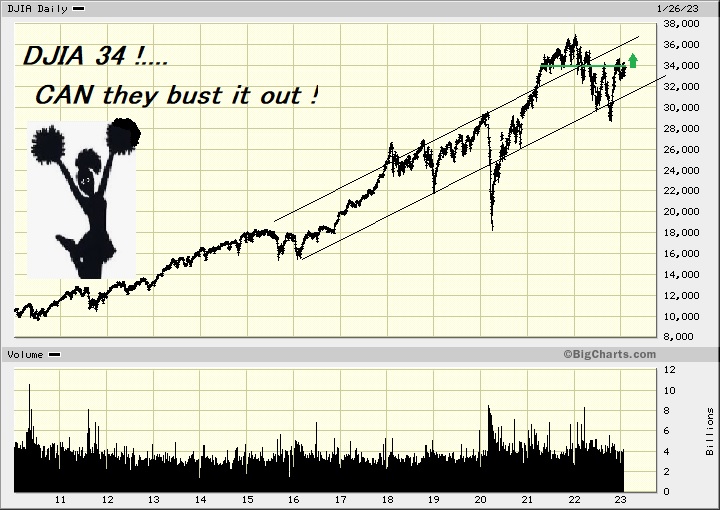
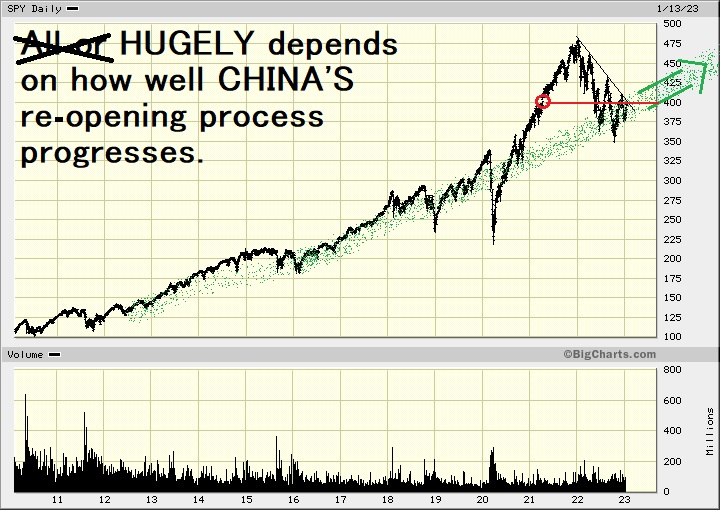
The Green Arrow is what Wall St WOULD love to see
Hong Kong is now at 22
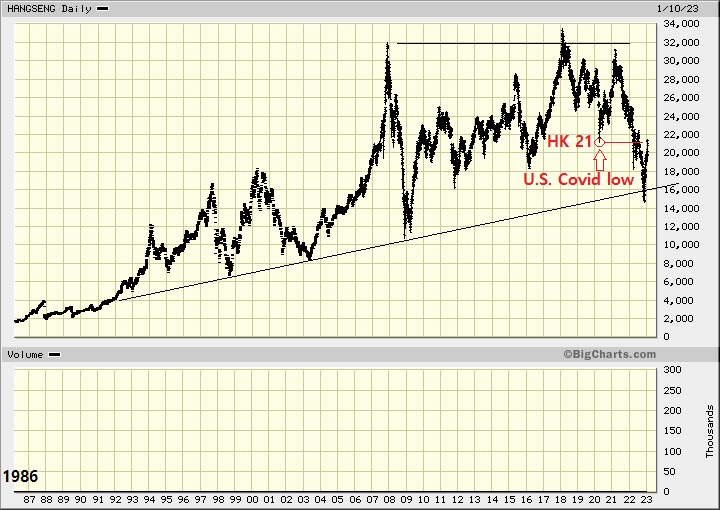
Yes.....Perhaps it is happening.......
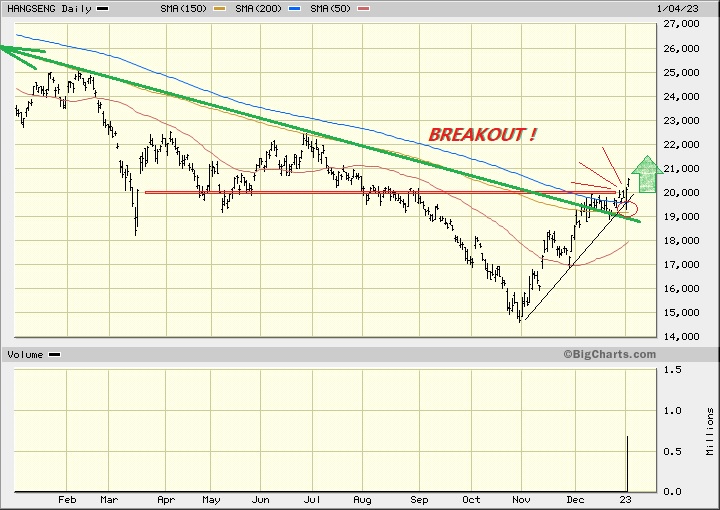
HK 20,000 Baby !
All's they had to do was ease the Covid restrictions in China to embolden just millions of gamblers......
Meanwhile.........
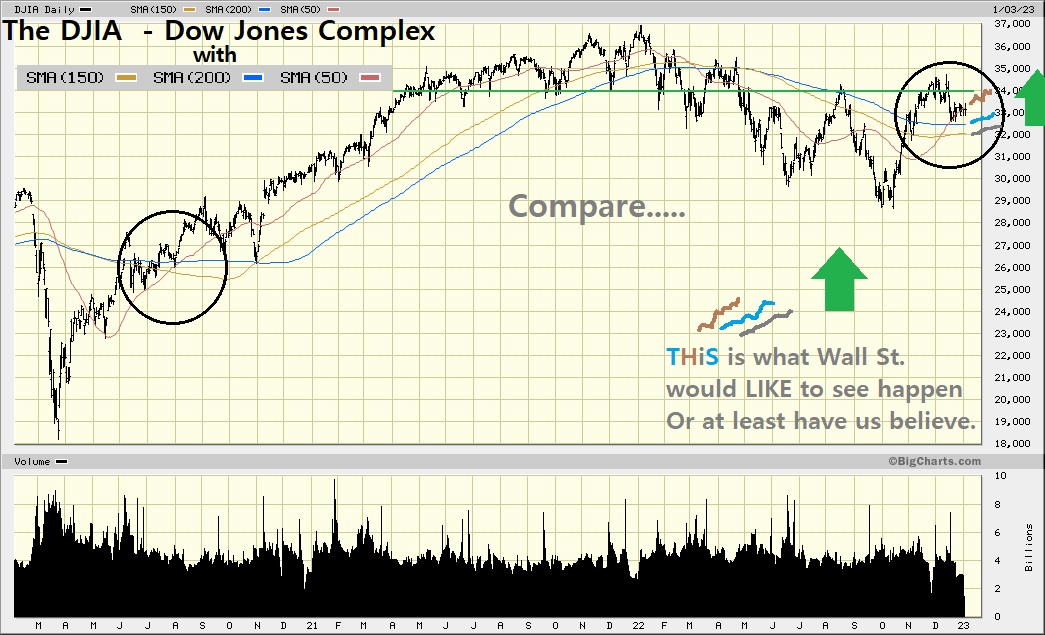
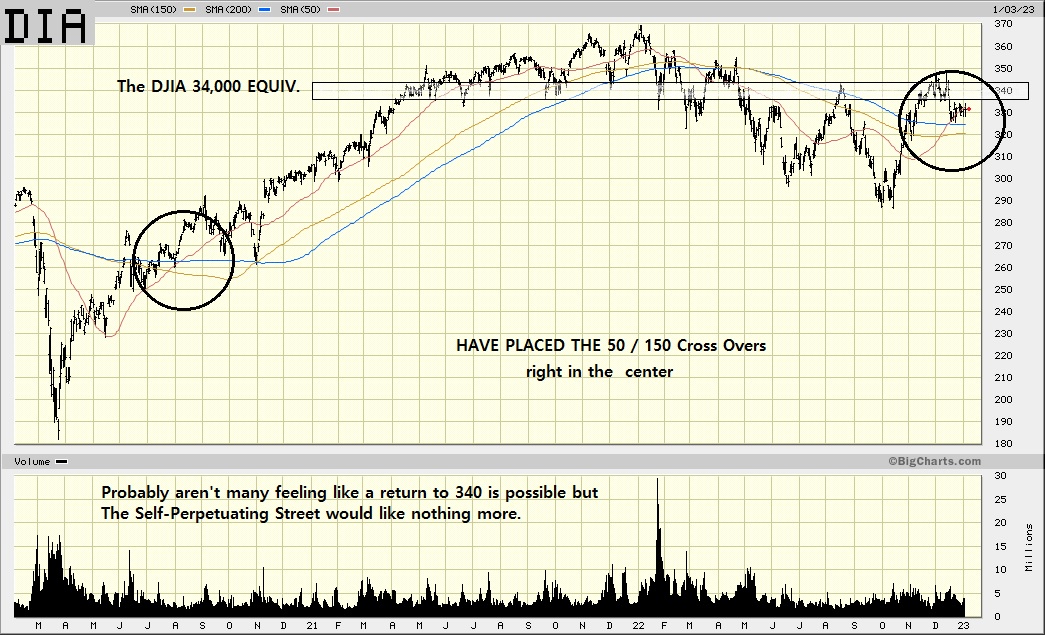
Therefore I'm tempted to ;
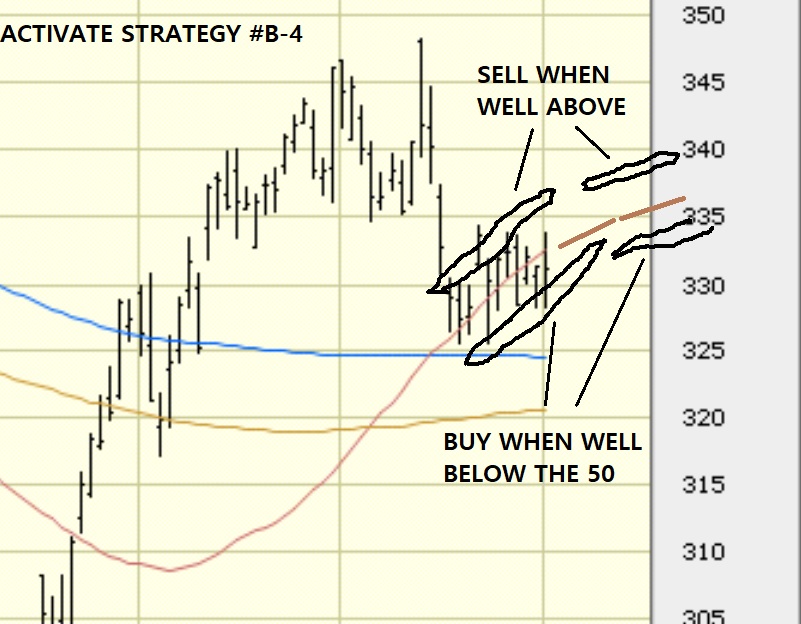
Activate Strategy B-4 many others !
Might need to look deeper though - because that's so.........just scratching the surface.
Could be some kind of Great Headfake as well !
Nah........That's perhaps fairly well thought out enuf.....I dunno.
.
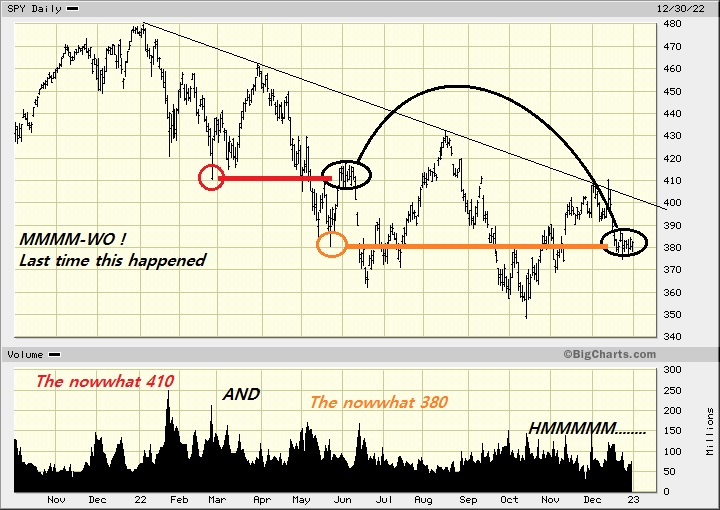
For the S&P it's all-about this 380 Consolidation Zone......
For China it's all-about its' 20,000
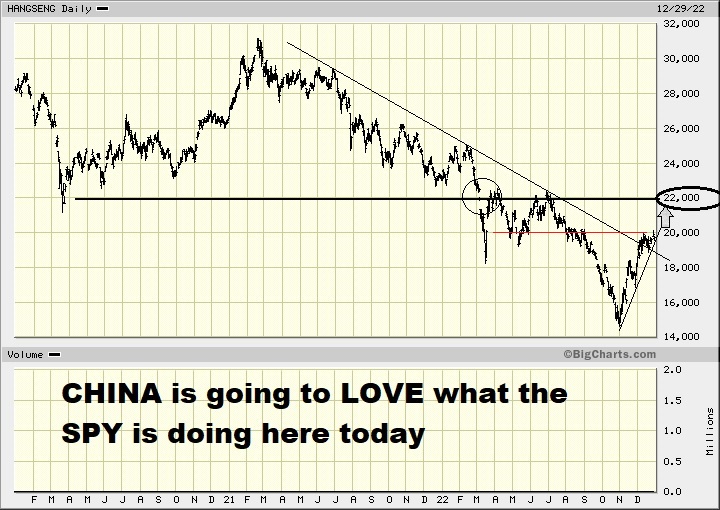
So which one's more important ?......Which one's going to LEAD ?
Is the reason for SPY ascending right now (or IS IT - last 379.89),
attributable to Chinas' strong close last night - above 20,000 to 20,200 ?
I suspect that it IS !
World's not goin' nowhere's without a Chinese recovery.
SPY last 380.13
SPY is holding off to see what China does TONIGHT !
Where Chinas' in a side-channel Breakout Mode :
https://bigcharts.marketwatch.com/advchart/frames/frames.asp?show=&insttype=&symb=hangseng&x=55&y=14&time=6&startdate=2%2F4%2F2020&enddate=2%2F19%2F2023&freq=1&compidx=aaaaa%3A0&comptemptext=&comp=none&ma=0&maval=9&uf=0&lf=1&lf2=0&lf3=0&type=2&style=320&size=3&timeFrameToggle=false&compareToToggle=false&indicatorsToggle=false&chartStyleToggle=false&state=9
.
And just looky thar now will ya' ? !.......wow
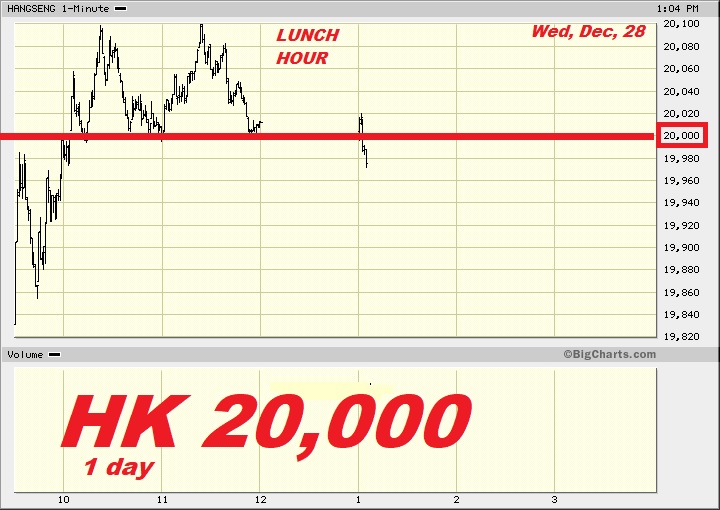
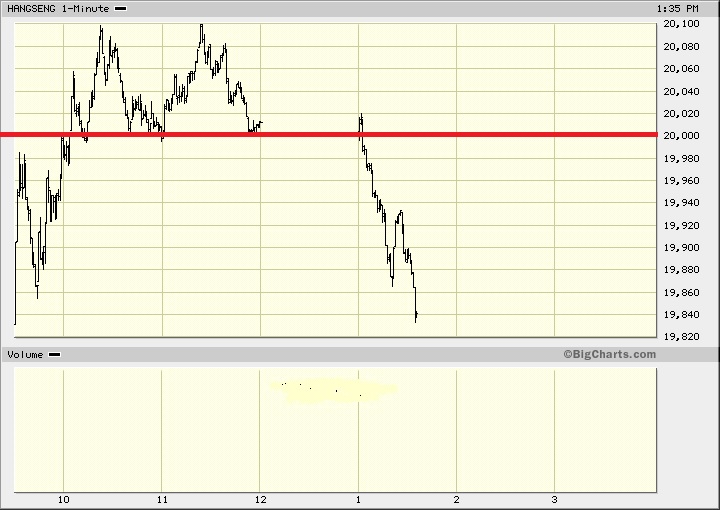
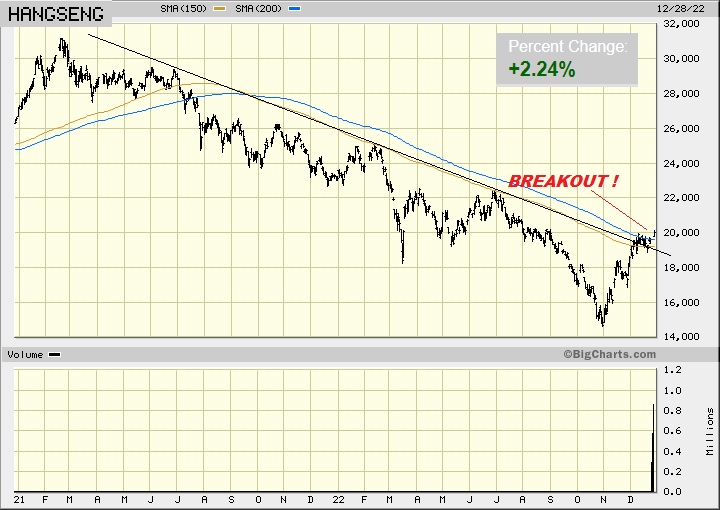
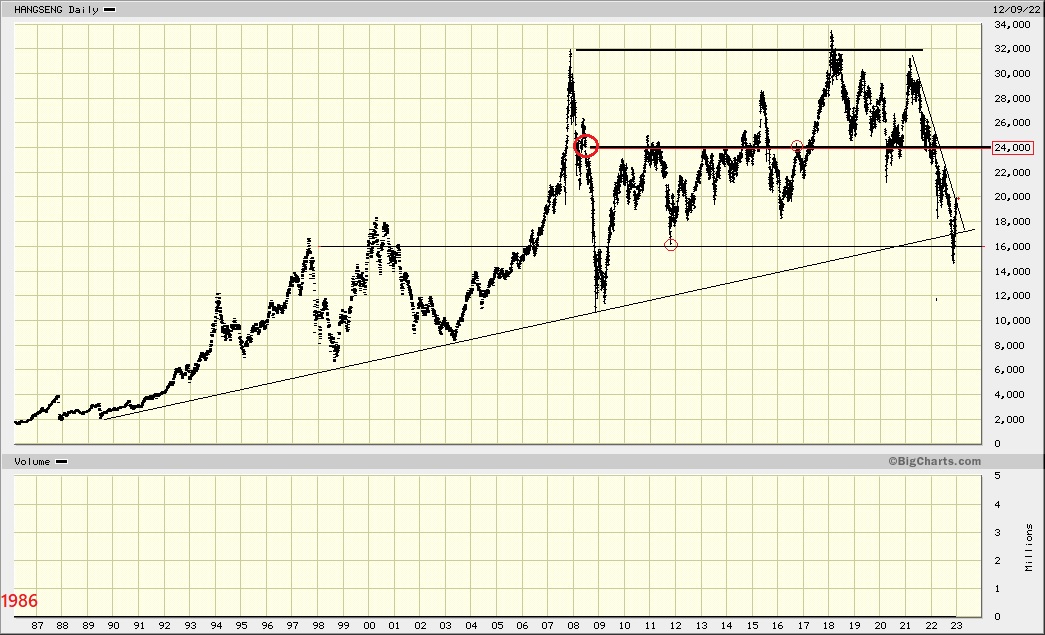
Friday December 9th - 11 sessions ago
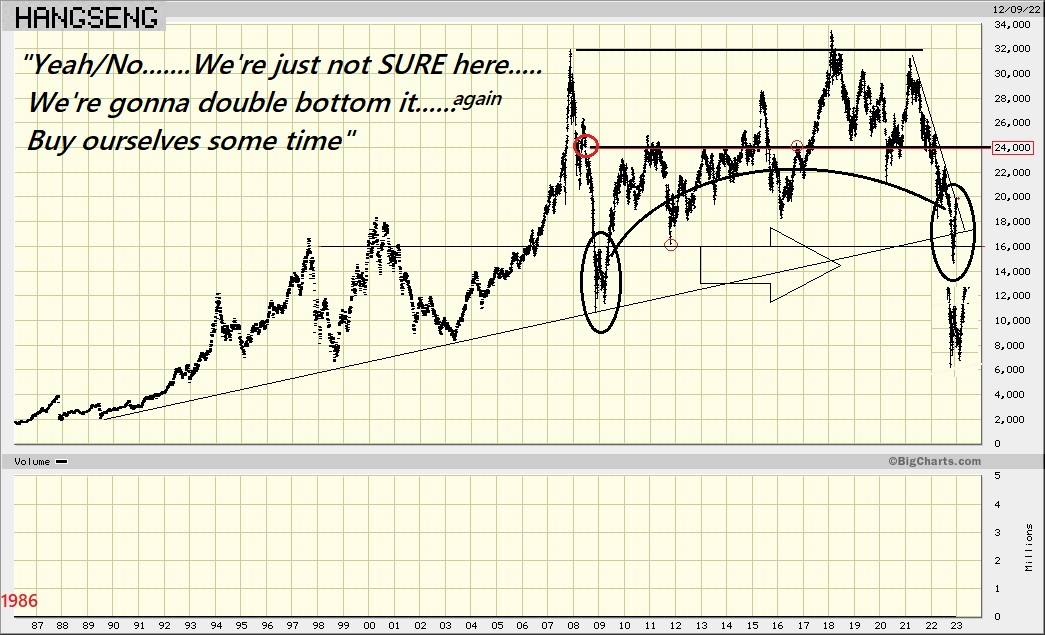
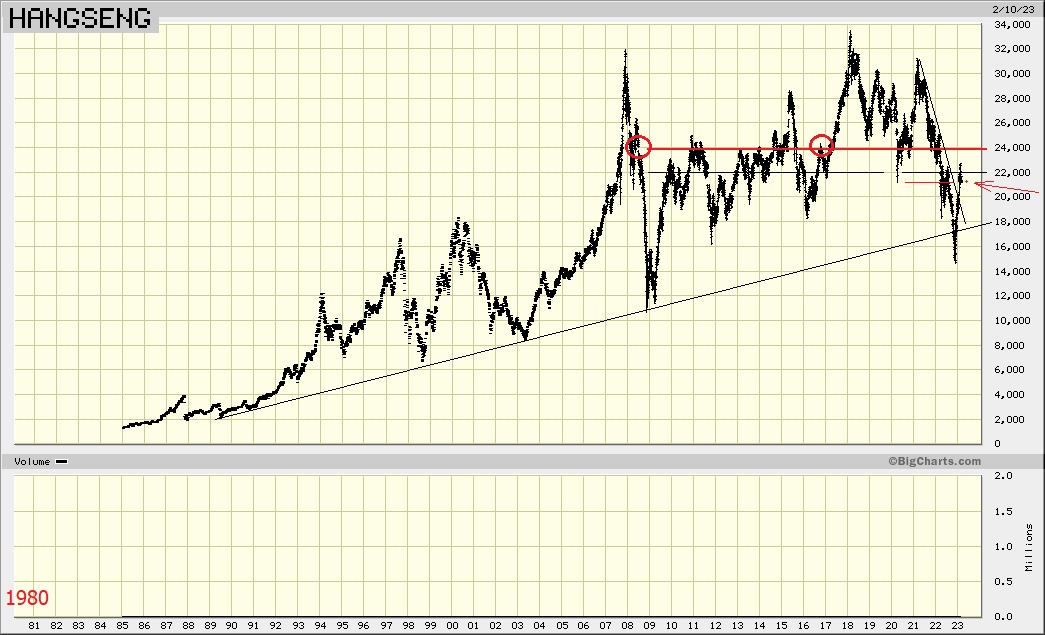
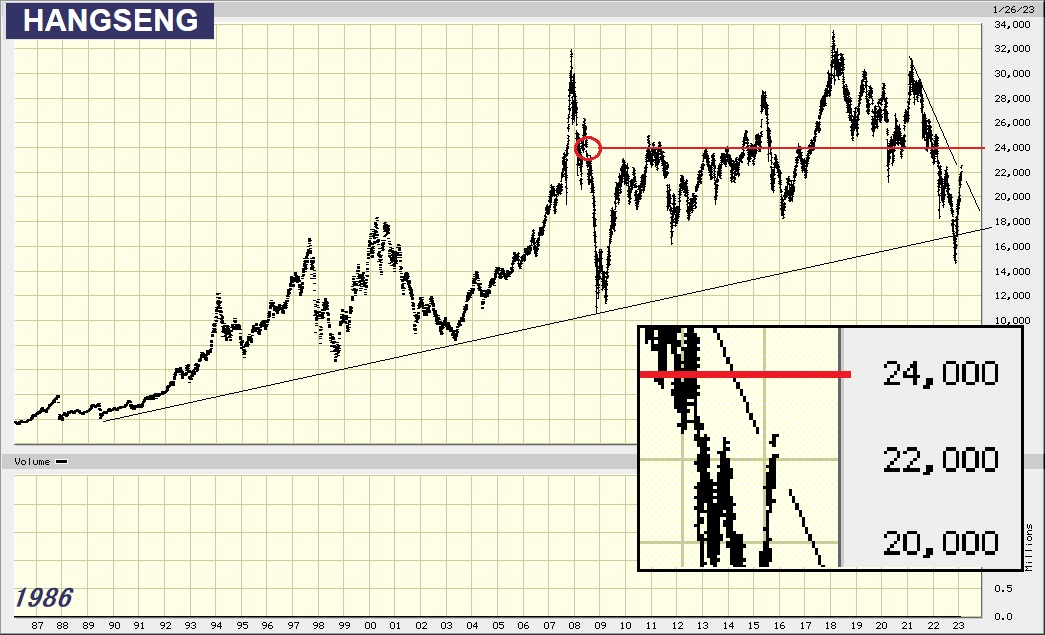
Now, that's freaking China (from 1986)..........and it's currently at 20,000
So do we have any near geniuses on this board (who KNOW what that's going to be doing ?)

Or, just some opinions might not hurt.
3mo
https://bigcharts.marketwatch.com/advchart/frames/frames.asp?show=&insttype=Index&symb=hangseng&x=55&y=17&time=6&startdate=2%2F4%2F2020&enddate=1%2F19%2F2023&freq=1&compidx=aaaaa%3A0&comptemptext=&comp=none&ma=0&maval=150+200&uf=0&lf=1&lf2=0&lf3=0&type=2&style=320&size=3&timeFrameToggle=false&compareToToggle=false&indicatorsToggle=false&chartStyleToggle=false&state=11
6mo
https://bigcharts.marketwatch.com/advchart/frames/frames.asp?show=&insttype=Index&symb=hangseng&x=58&y=18&time=7&startdate=2%2F4%2F2020&enddate=1%2F19%2F2023&freq=1&compidx=aaaaa%3A0&comptemptext=&comp=none&ma=0&maval=150+200&uf=0&lf=1&lf2=0&lf3=0&type=2&style=320&size=3&timeFrameToggle=false&compareToToggle=false&indicatorsToggle=false&chartStyleToggle=false&state=11
Having said that : Got's to watch it ;
Several things could happen.
1 Jo 5:19

HK 20,000 - Several things could happen - It's.....History In The Making - A Historic Event

It ain't no minor matter
It ain't no minor level either........and it ain't no guarantee - That that IS a freaking Breakout ;
For it COULD just be a.........
Hoax.
A Head-fake Up-spike Poke-above........?
This thought's from two weeks ago - TONIGHT IT'S ABOVE 20 ;
I was pretending that I was Big $$$$

.
And just looky thar now will ya' ? !.......wow

.
The whole world is relying upon Chinas' re-opening, which (for some reason) seemingly includes Hong Kong.
Chinas' strength is what triggered this huge Nov. / December rally - and it could continue to do so.
Futures will be up by about 25 trw morn. (IF this strength holds up).......They are CURRENTLY only up 1.5
South Korea and Japan however are in veritable melt-downs........BUT AS LONG AS CHINA CONTINUES TO HOLD UP, everyone else should be fine....
I know : That all sounds pretty goofy........but that's how things APPEAR.

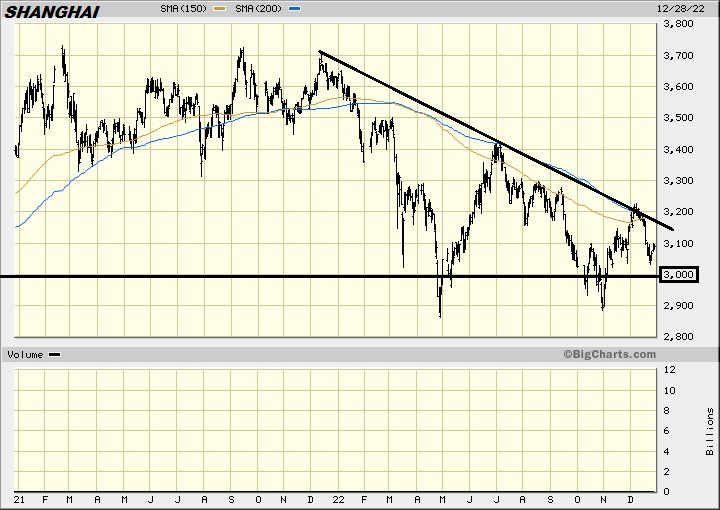
BREAKOUT !.........HONG KONG !..............SPY 380 !............GO THREE EIGHTY GO !
What a frickin' STUPID world !
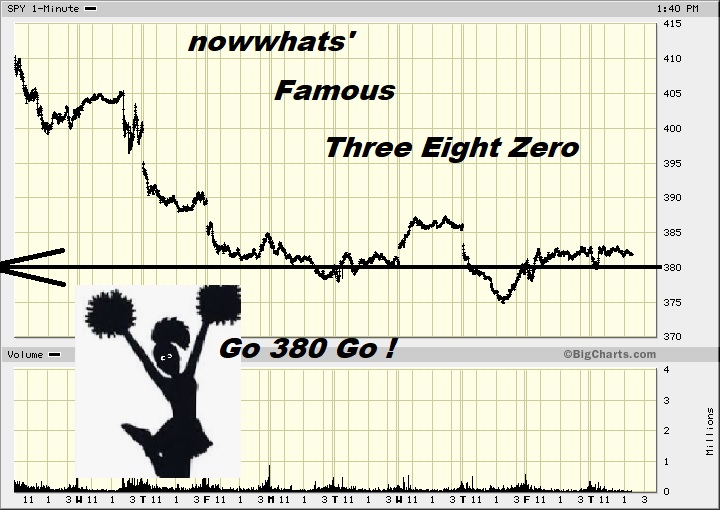
So WAS Chinas' November 1st strength the prime factor which drove these markets higher ?.....Compare SPY to top chart ;
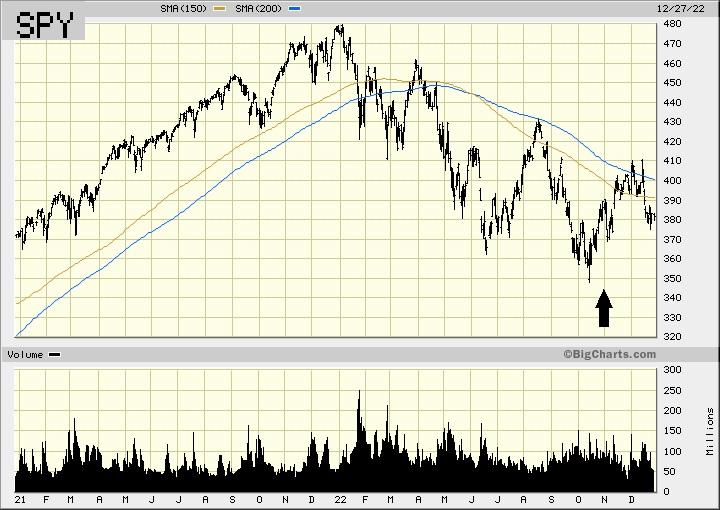
.
Holiday Shennanigans and what shall it be.....
Is there any way to answer that SIMPLY ?
Perhaps.
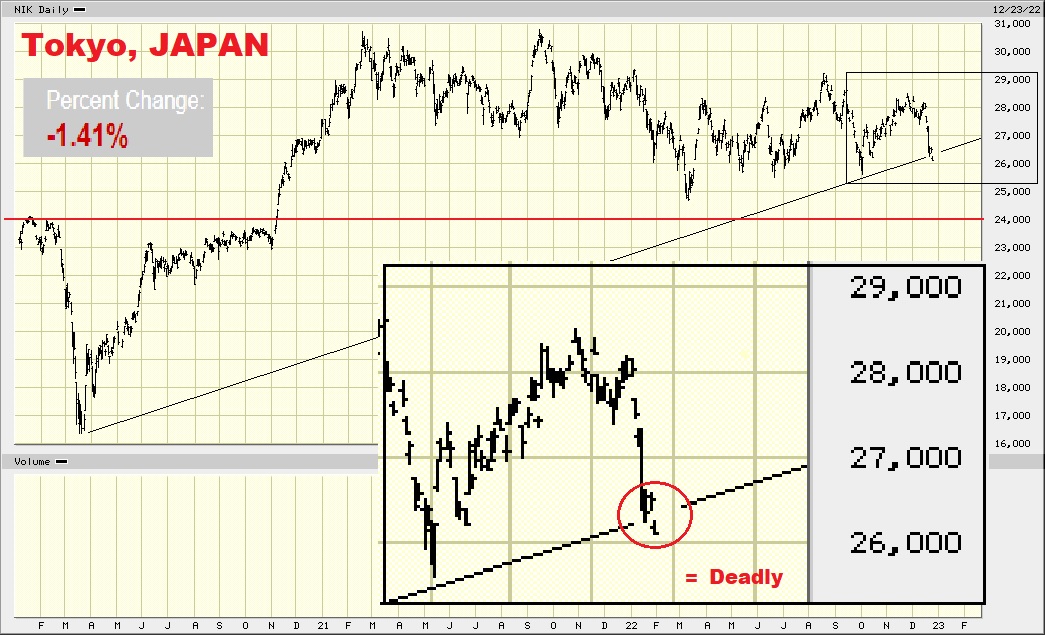
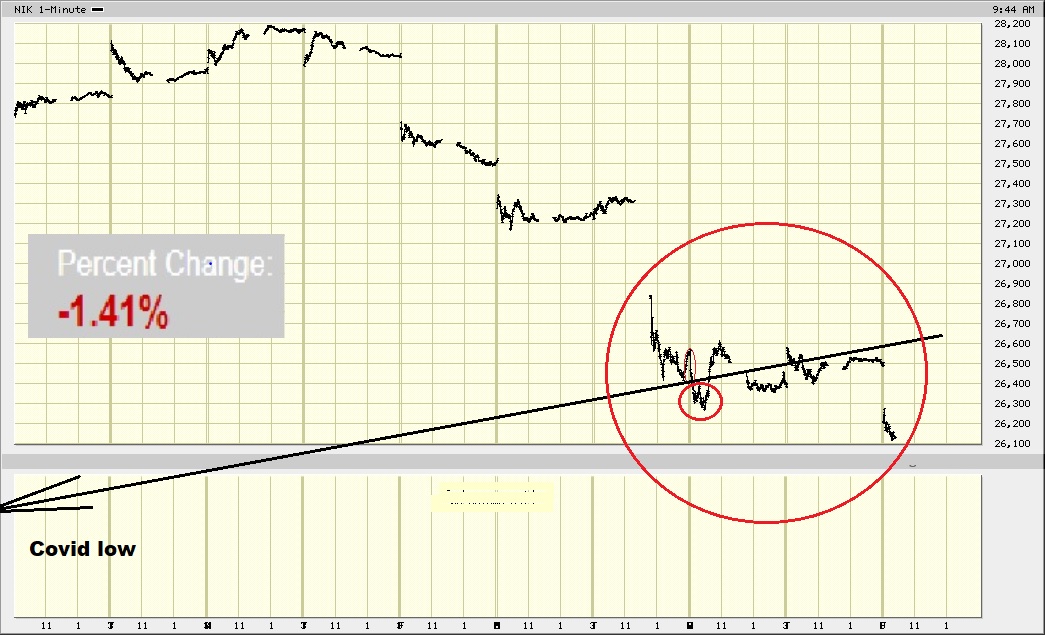
That there might make for a fairly sound START.....
But, we'll just have to keep an eye on some OTHERS.
oooops - In that top chart my line's a bit off but it shouldn't make for too much of a difference......
Y'see, it's all about the (top charts') Red Horizontal (now).......
You're likely going to be hearing (seeing) a LOT about THAT. (now).......* in the weeks & months ahead......
Partially because it foretold of the "pandemic" MONTHS before it struck.
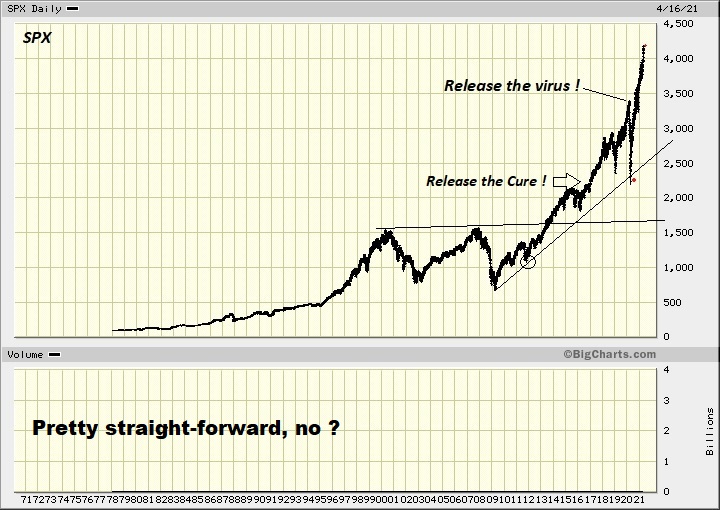
Good for you - Nice ! Yeah I remember you sayin' that (perhaps a little bit after it had come off the bottom).....
But nice nonetheless I guess, okay, so for how long will you ride it ?....Have you found some good council ?......Perhaps on CNBC ?
Myself I missed shorting China / Asia, the whole complex because things never quite got to where I'd determined they ought to :
Which at that time was 31.950
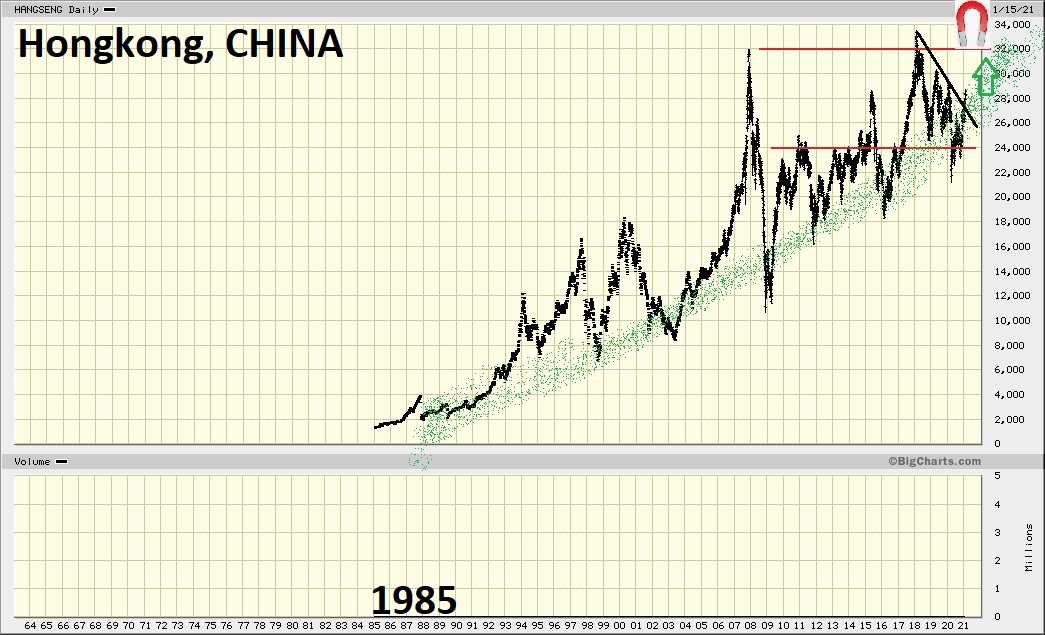
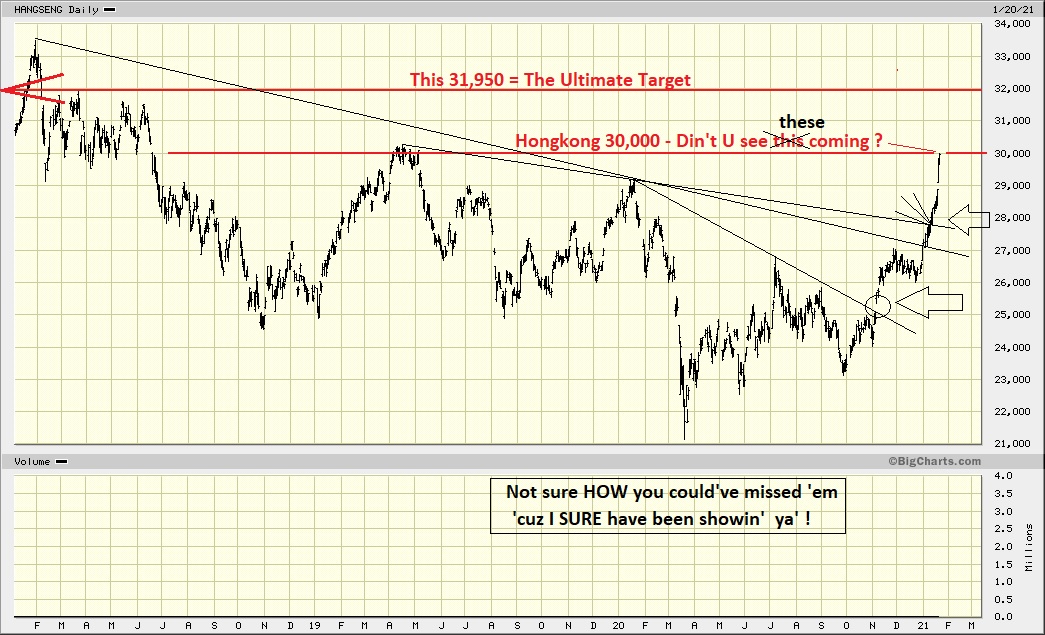
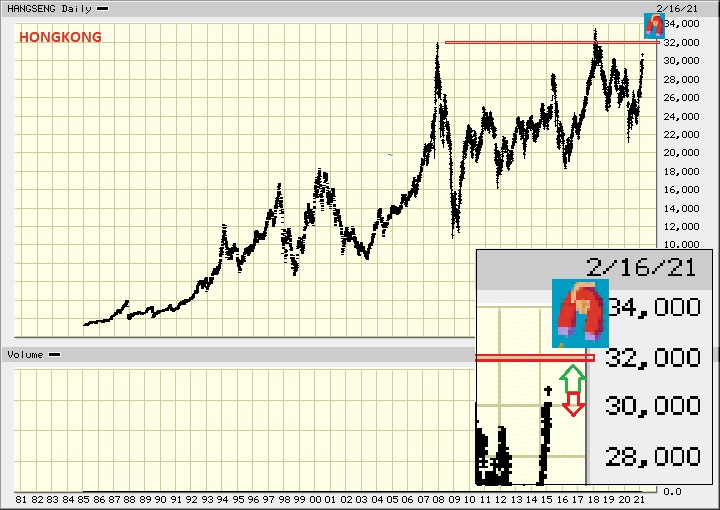
Nov. 1st
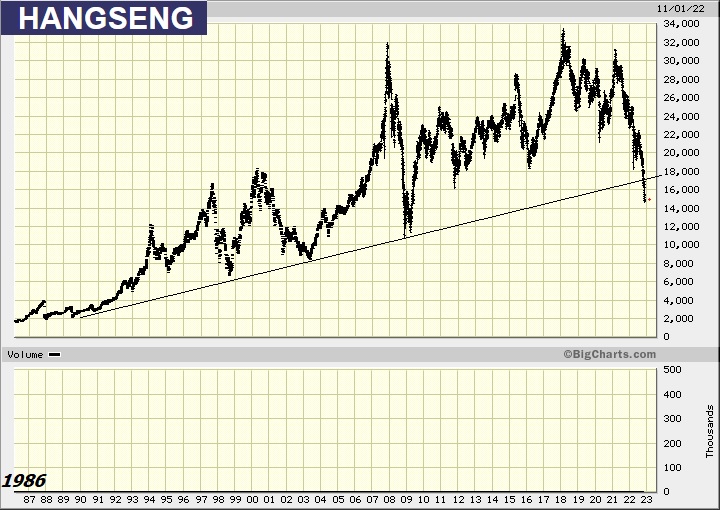
Nov. 15
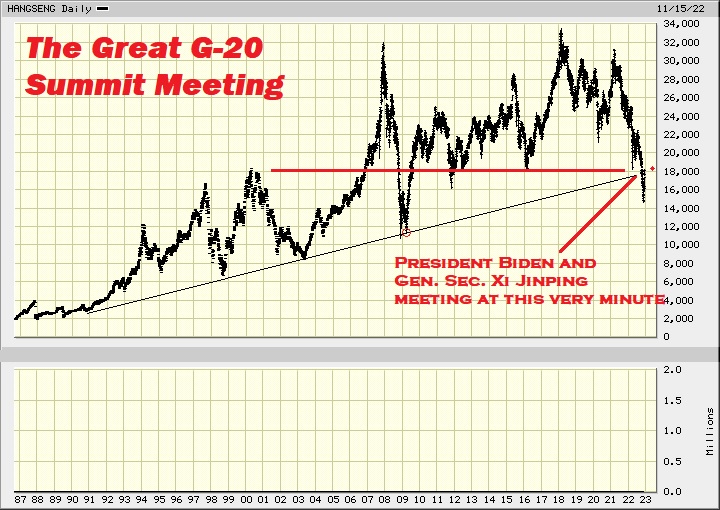
3 weeks later......(from 18,000 to 20,000)
December 9th
October 14th ;
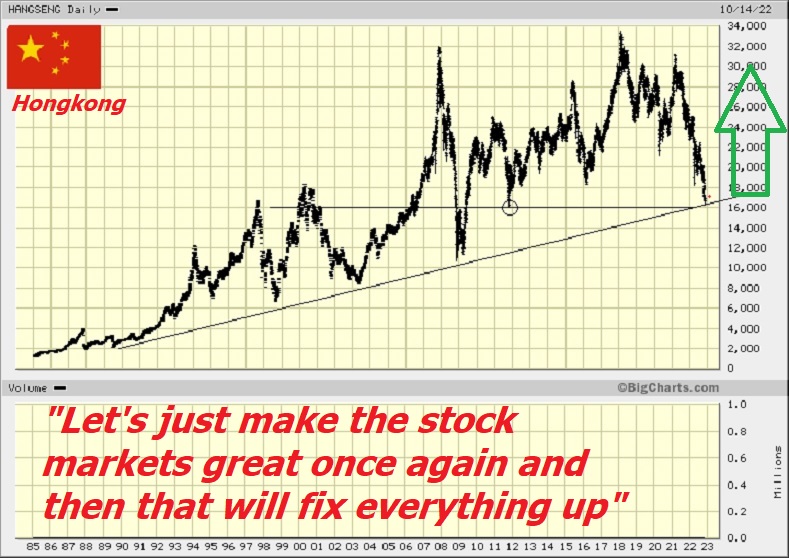
Just HAD TO pound everything into oblivion.......(to give themselves a nice entry point) !.....Thing almost got down to 14
Yes, timing these bass-turds PRECISELY can be hard but......it sure can be worth the effort.
.
Wednesday November 30th ; (China had not yet "arrived")......
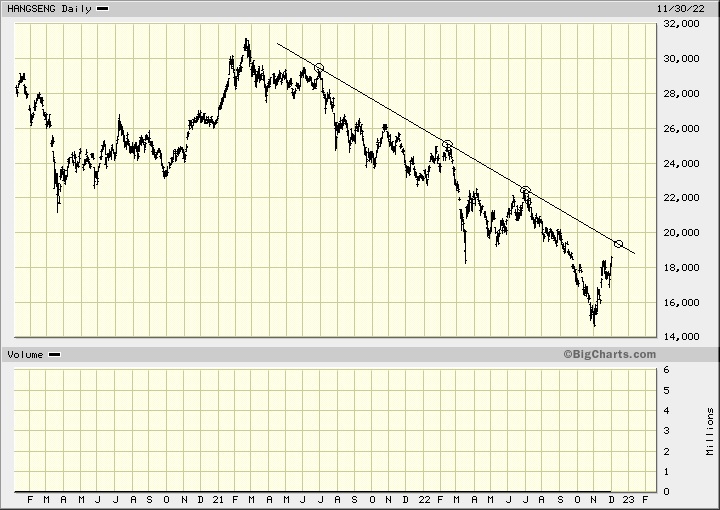
3 Sessions later.......Check !
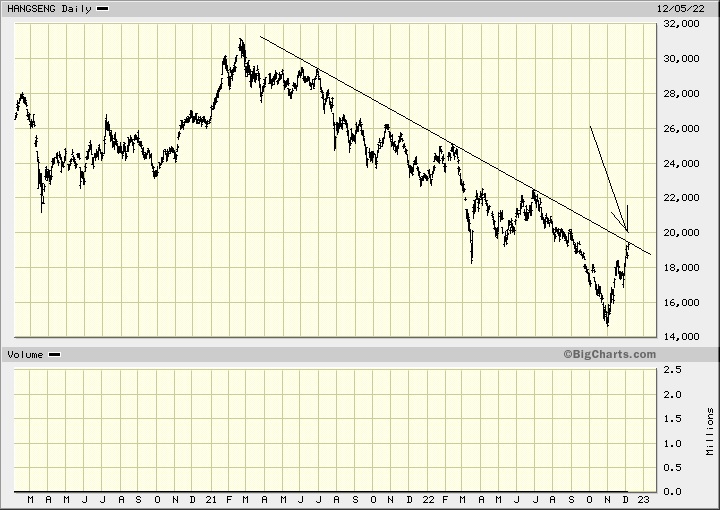
Wednesday Nov. 30th ; 3 sessions ago :
and so there now we have it......... Our / my overhead ruler line expectations have suddenly been fullfilled !.......
yikes..............Why, this might not bode well for bulls !
S&P Futures @ - minus 5
Bit of an Alarm Bells move (that there)..........* Last week WAS Canadian Professional Bank Fraud Week.......
.
You been seein' Dollar / Peso ?......Aye, aye, aye
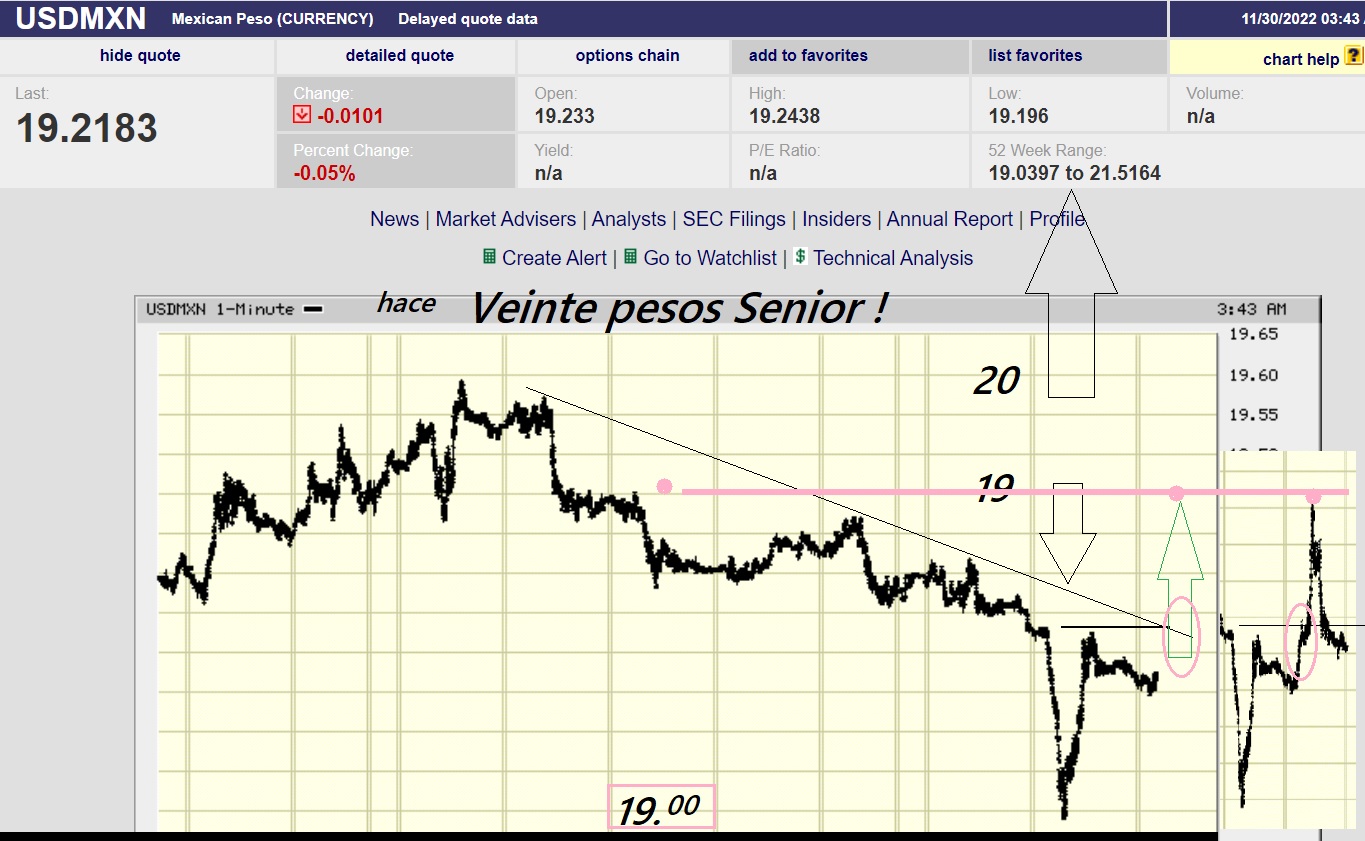
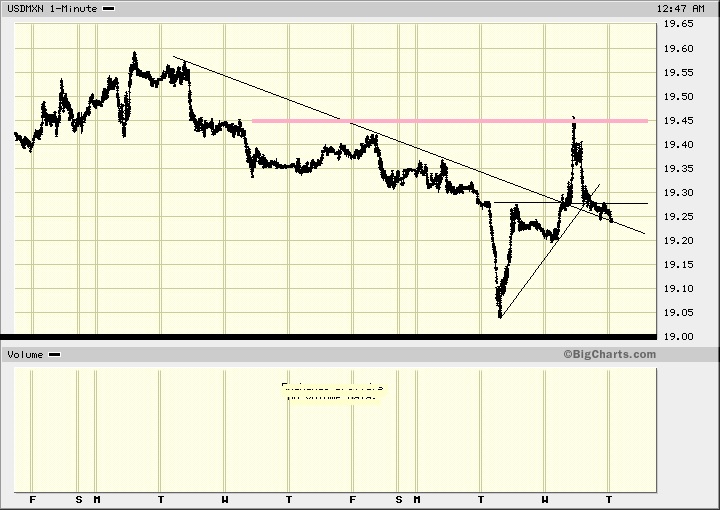
May be.......
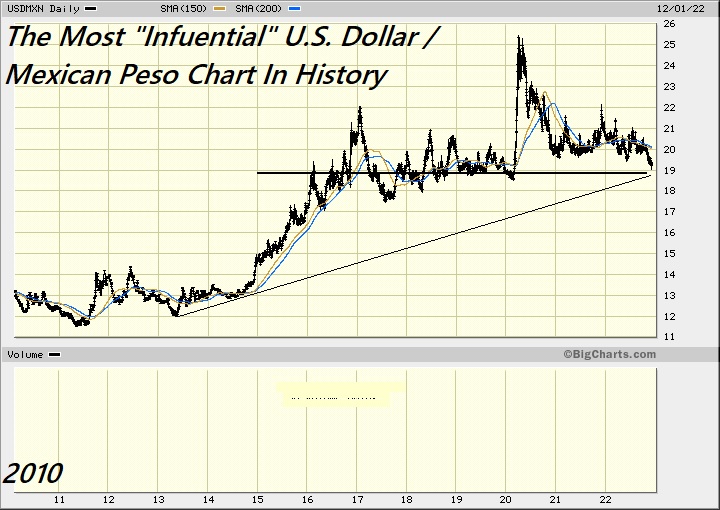
Correction : Maybe this one was.....
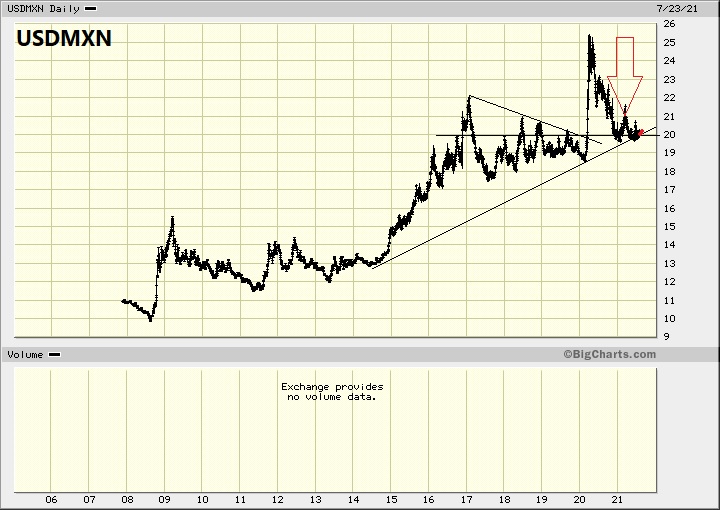
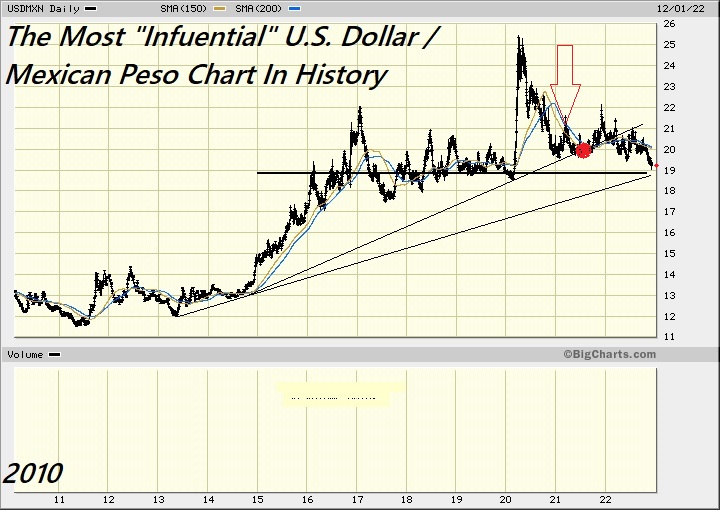
Don't mind me.....Just havin' a look.........Ramifications for SPY ?
Something monumental soon there..........
A CBDC Crypto Dollar ?.............YOU WILL SEE.......
A......'nuther........TOTAL ECONOMIC AND GLOBAL COLLAPSE!!!!!!! ???
.
ONE thesis or strategy which I have been putting forth is this ;
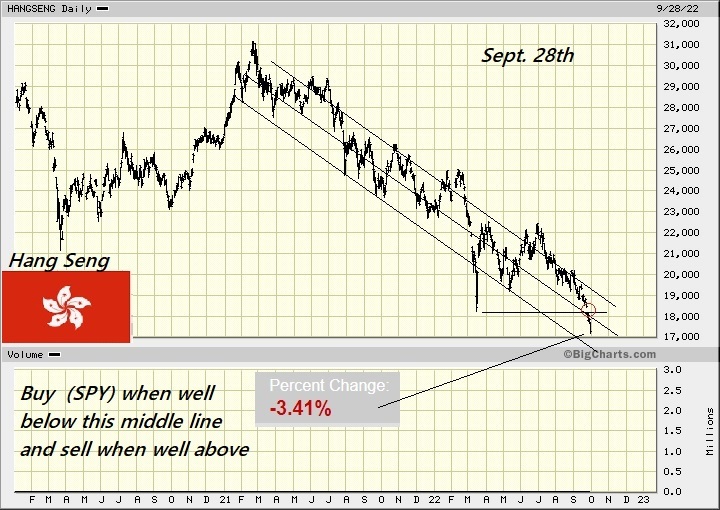
2 months later......
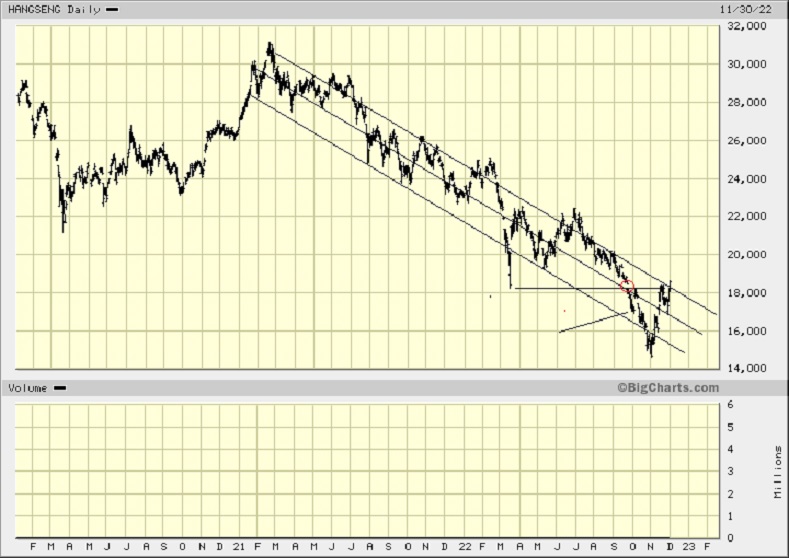
Well ?.......The bleeping thing definitely got "well below", didn't it ?
Something to watch for (now) though however, is.......
That.....
Markets COULD presume.....
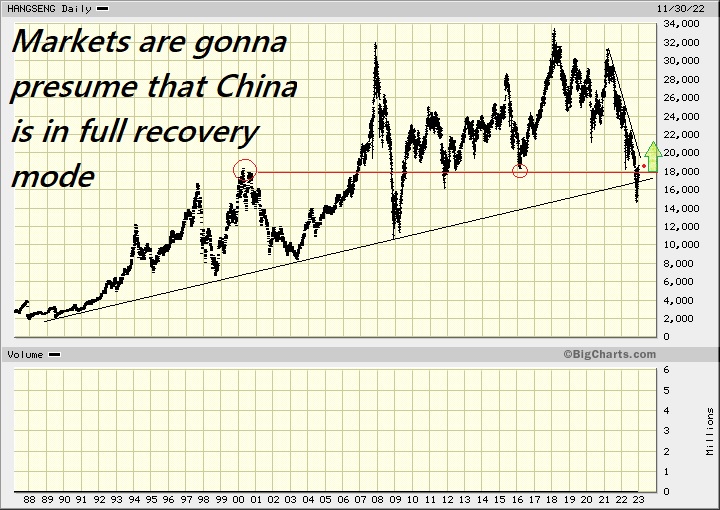
We'll be monitoring that Overhead Downwards Diagonal (among other key "benchmarks") very closely !
* As December comes around
Bitcoin, SPY 410, etc.
.
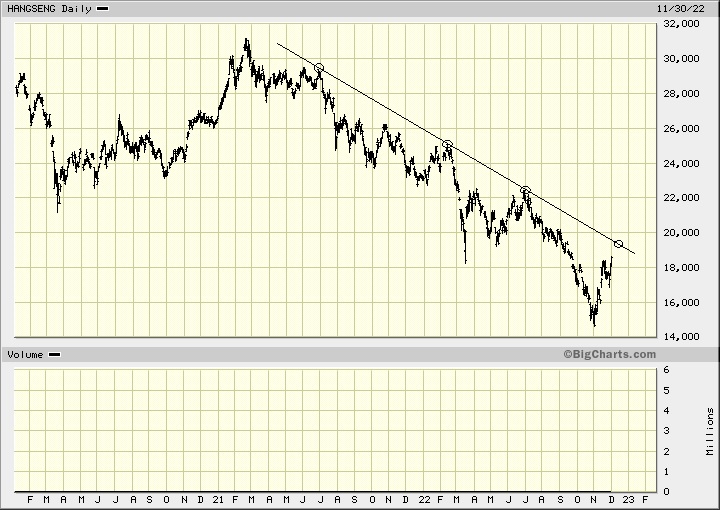
Don't look now but (perhaps, just as I've been documenting)......
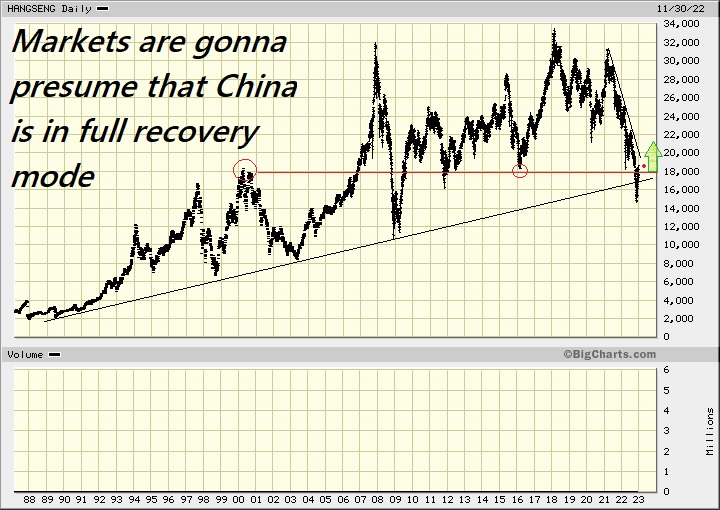
We'll monitor how they cope with that Overhead Diagonal......
S&P Futures up (just) 5.5
China's real estate sector has been recieving multiple bailouts.......
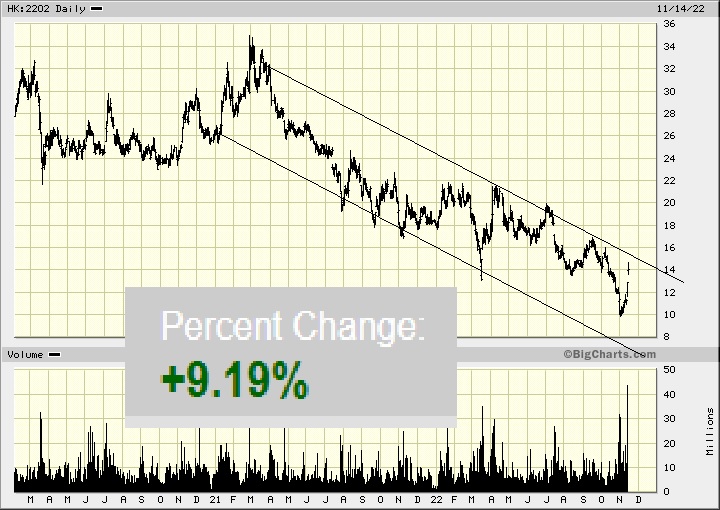
2 weeks later (the gap (shown above) got filled :
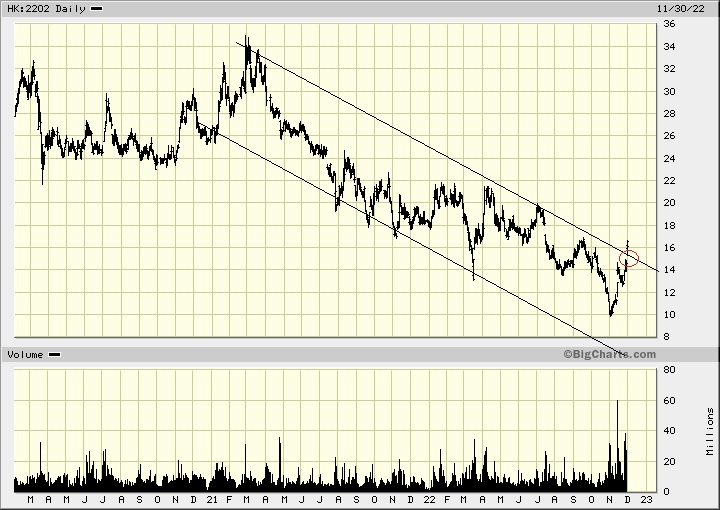
Perhaps now THIS one could get filled......
It might just be neccesary to have CHINA under a microscope........
if one hopes to identify the rest of the worlds' TREND
Altho,
Alternatively, one COULD simply stick their head in the sand ?
Hongkong, CHINA
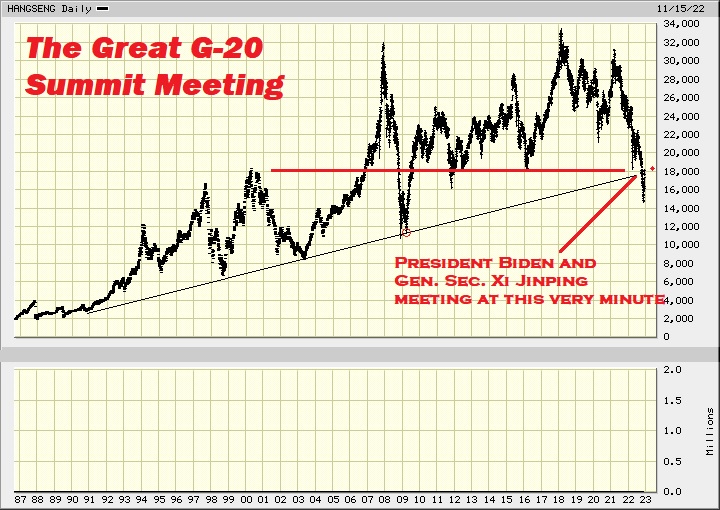
OCTOBER 5th
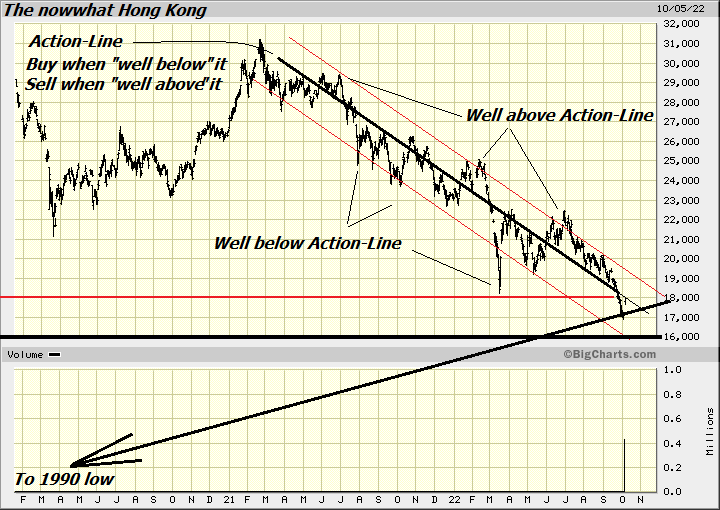
SIX WEEKS LATER ;
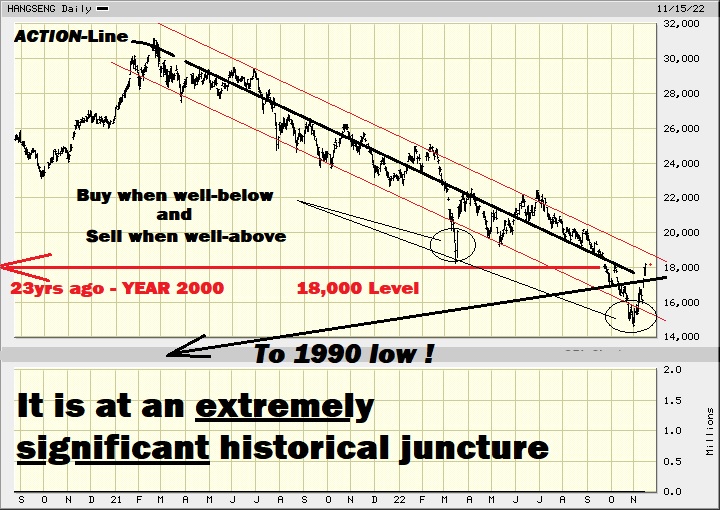

Super-Crucial Junctgure man..........How to trade it ?..........See charts.2 and 3
What could go wrong with doing that ?........China COULD keep on climbing.........Up to its' (notorious) 24,000 Level
6 1/2 months ago : april 4th 2022
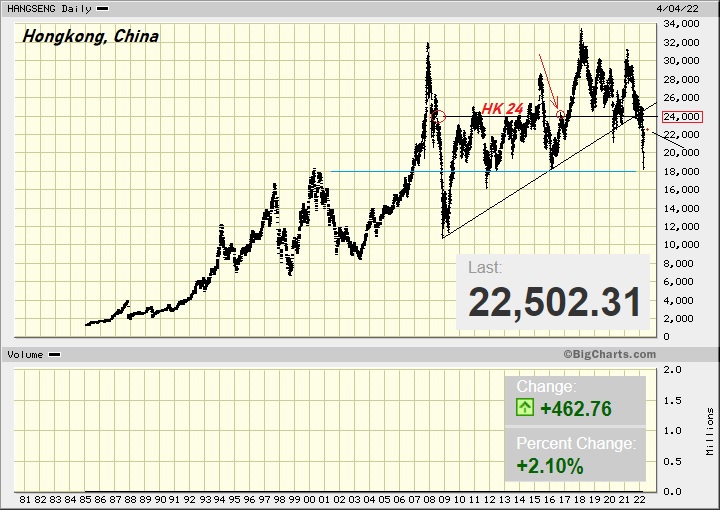
It topped out at 22,000 - Not 24
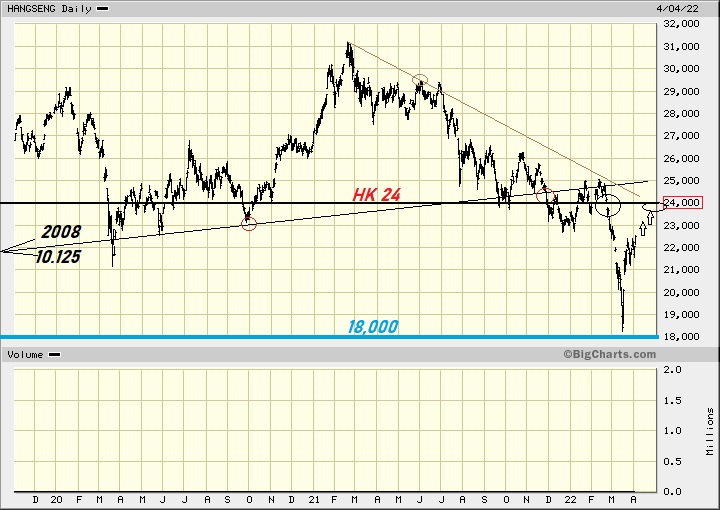
.
The World is ending !!!......The World is ending !!!......
The democrats are destroying the World !
Oh wow, well then, yeah, if that's the case then for sure.....
Everyone should be short......
Note :
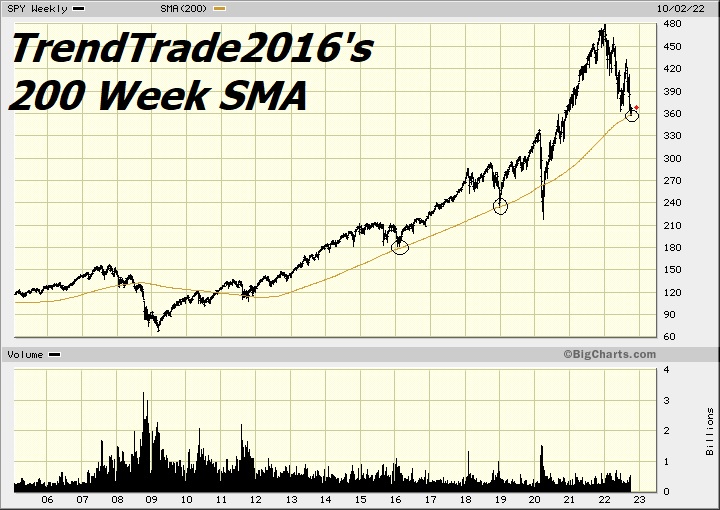
S&P up 3 pct
Hong Kong and Shanghai both closed ?
Yup......In fact, Shanghai has now been closed since Sept 25th
Overnight Futures up 12 to 3690
Shanghai, Chinas' Golden Week !?
Yup.....and
When cats are away there are rats who'll play......Their Get Out Of Jail Free card(s)
Surprise !
OMG
Meanwhile ; (same time Bitcoin;s been breaking out),,,,,,we have ;
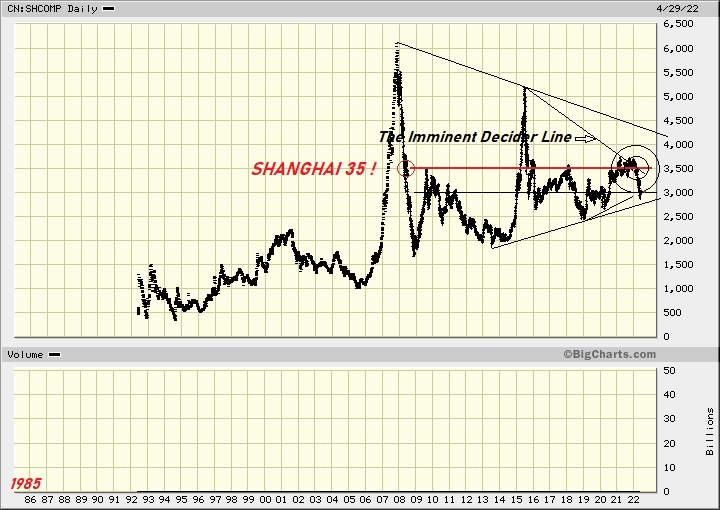
April 29th ;
9 weeks later ;
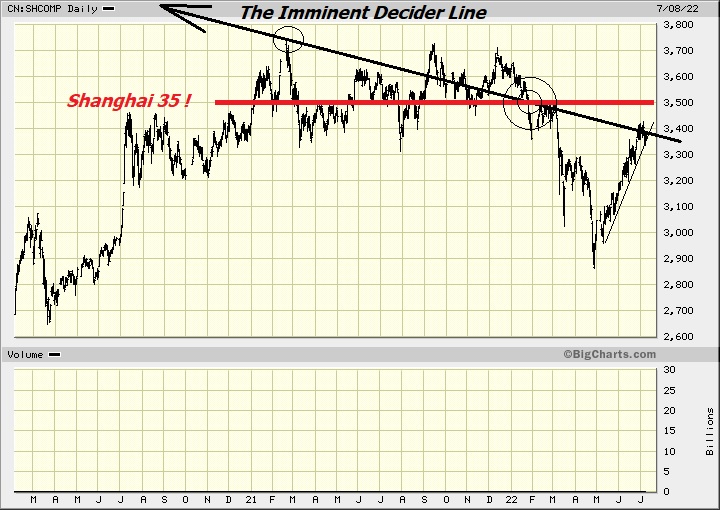
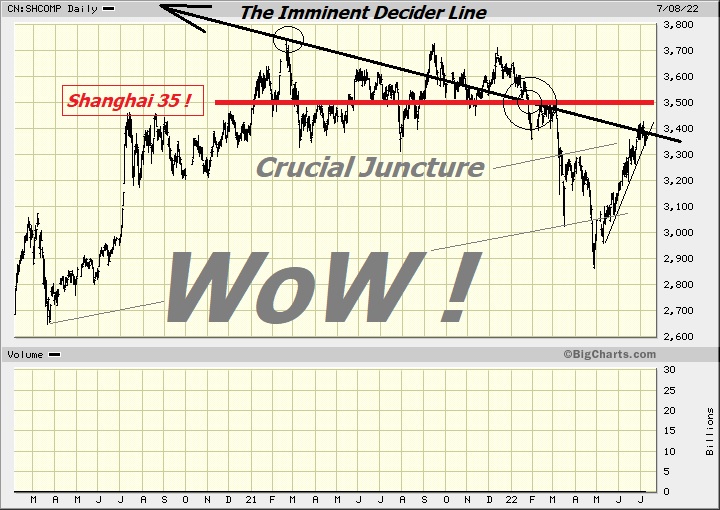
Now return to top chart.and......tell us what U think......
Using top chart, could it break above 3500 ?
Because if it were to do that its' inevitable target becomes 4000 !
So Shanghai is in a showdown of enormous proportions......Isn't that perfectly "fitting".....
And that's a veritable Treasure Map (if you will), and/or if I do say so myself.
Incredible.- Yet only just one small (large) piece of the puzzle.
.
Yes I suspect that you may become somewhat pleased (that you did not enter calls).....although,
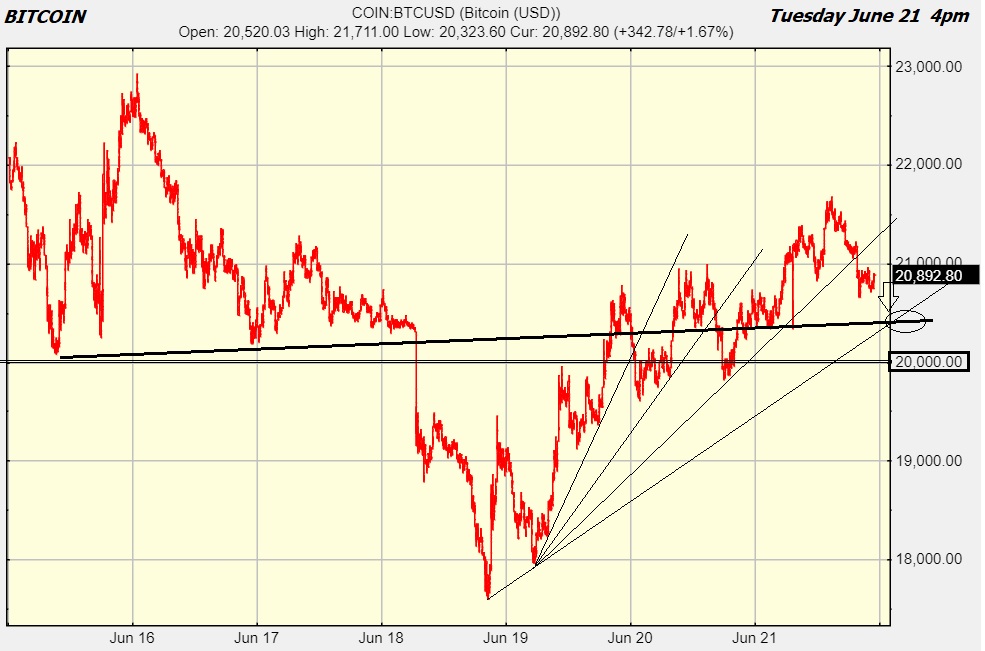
Although, it's actually still quite hard to say.....(how Americas' Bank Earnings Week will play out)
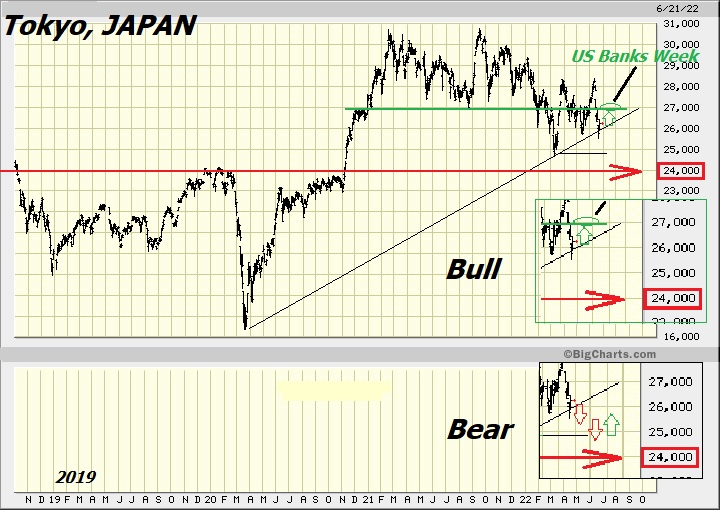
That 24,000 will always be huge....
Plus,
This Grim Reaper "V" .......Remains - One of my Primary Indicators
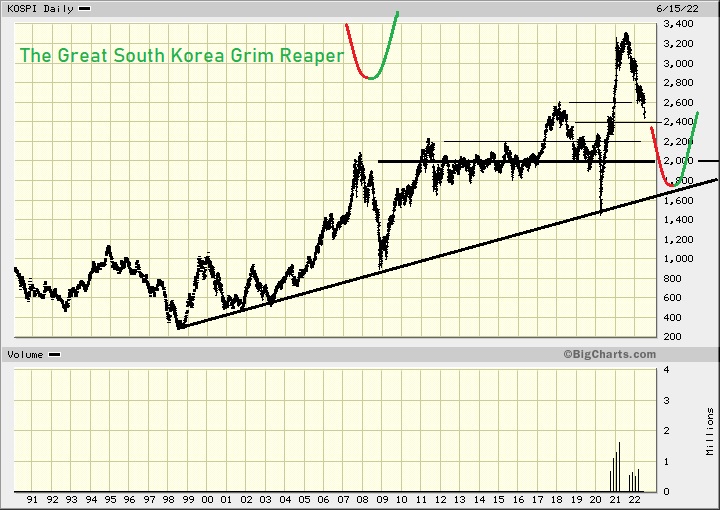
Swing trading I feel is much HARDER than Day-trading
.
The week in re-view ;
SUMMARY / FORECAST :
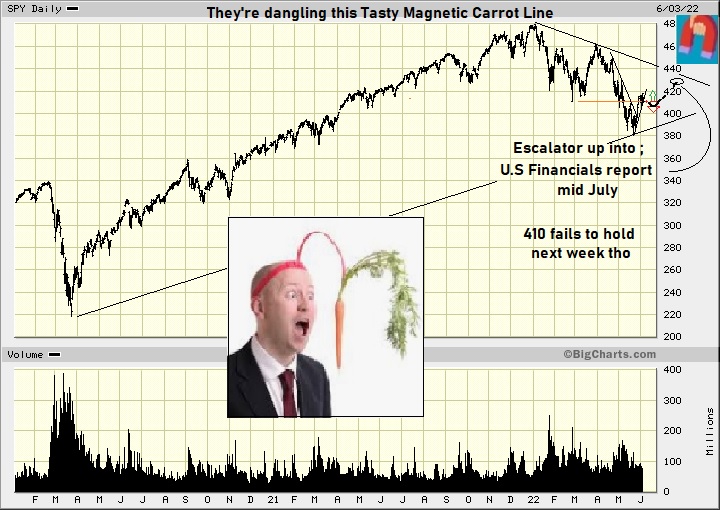
Wednesdays' close ;
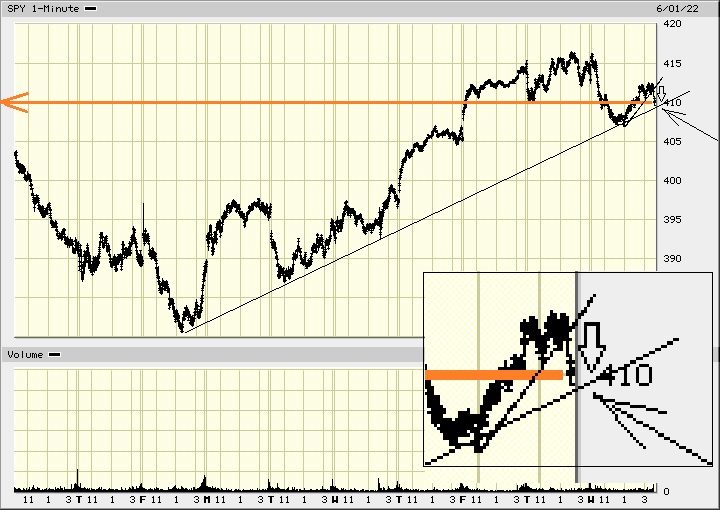
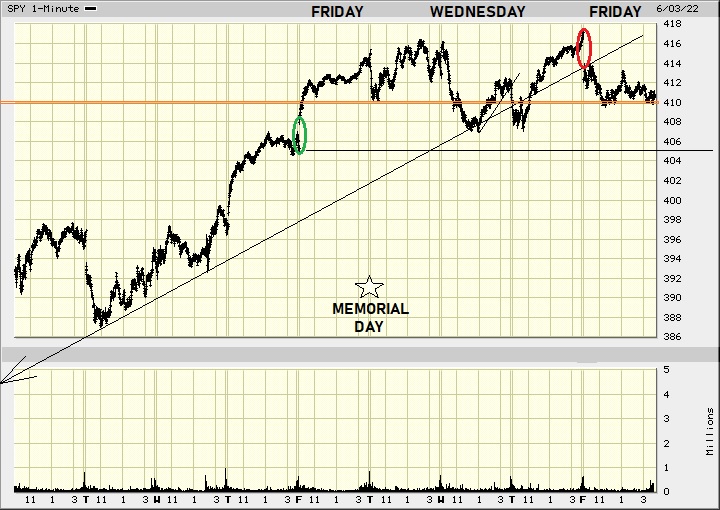
Wed. am & close
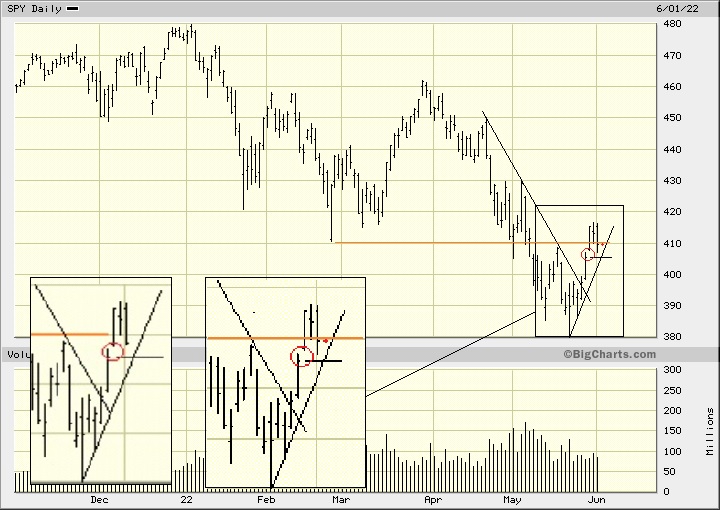
FRIDAYS' CLOSE ;
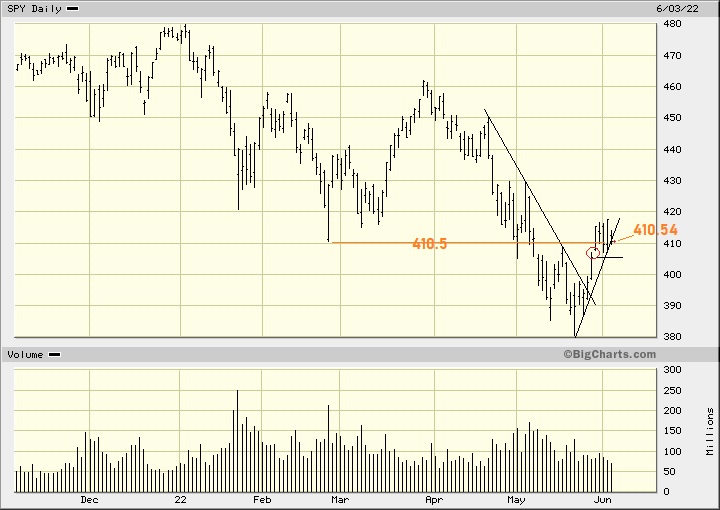
Slight drop next week down to (let's say) 400 (potentially far DEEPER !).....
then ridiculously ramp northwards up into US Fins Week

410 Baby.......That's been KEY........I've been ridiculing it now for close to over a month
Frickin' Wall Street U.S. Shysters......Deserve to be totally tarred/feathered & jailed.
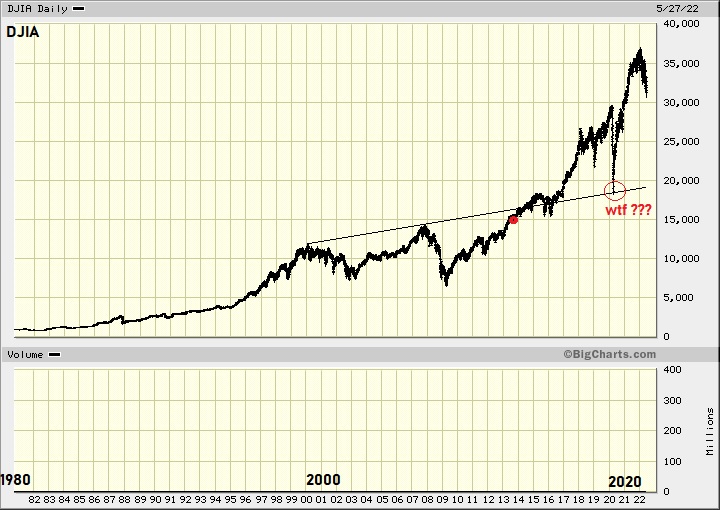
No point in trying to (fundamentally) rationalize it ........
Market is down because........BITCOIN is down.
Last night I tried updating this one month chart
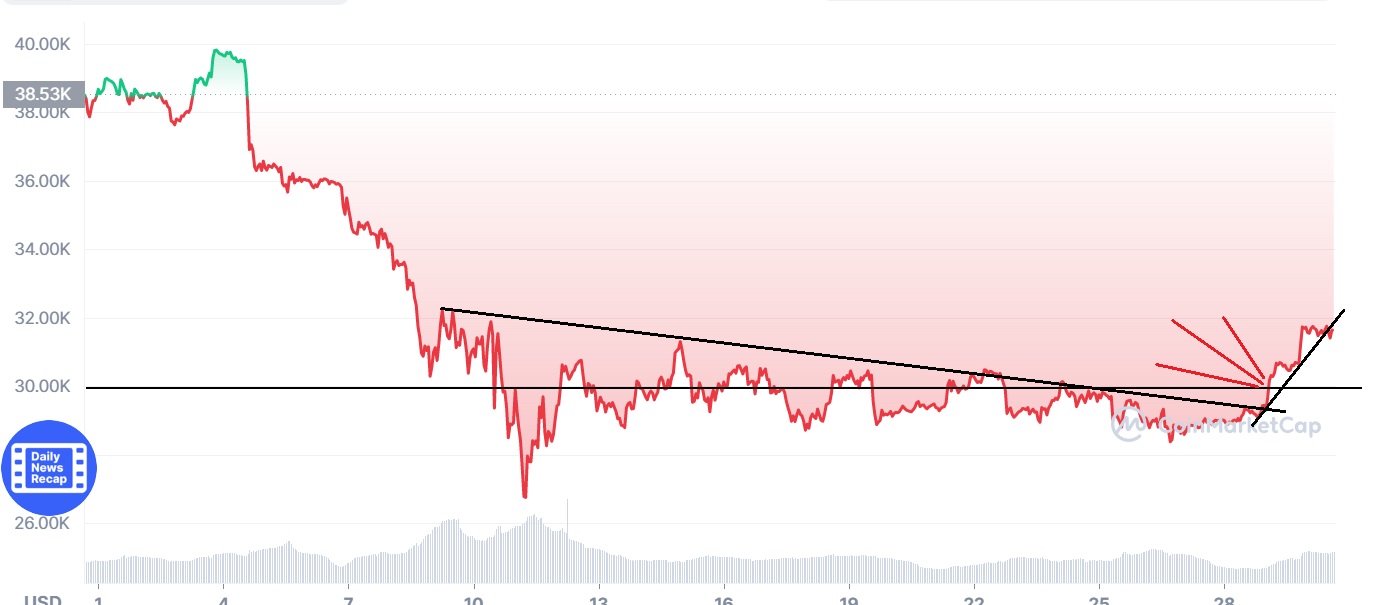
And this was the chart which they handed me ;
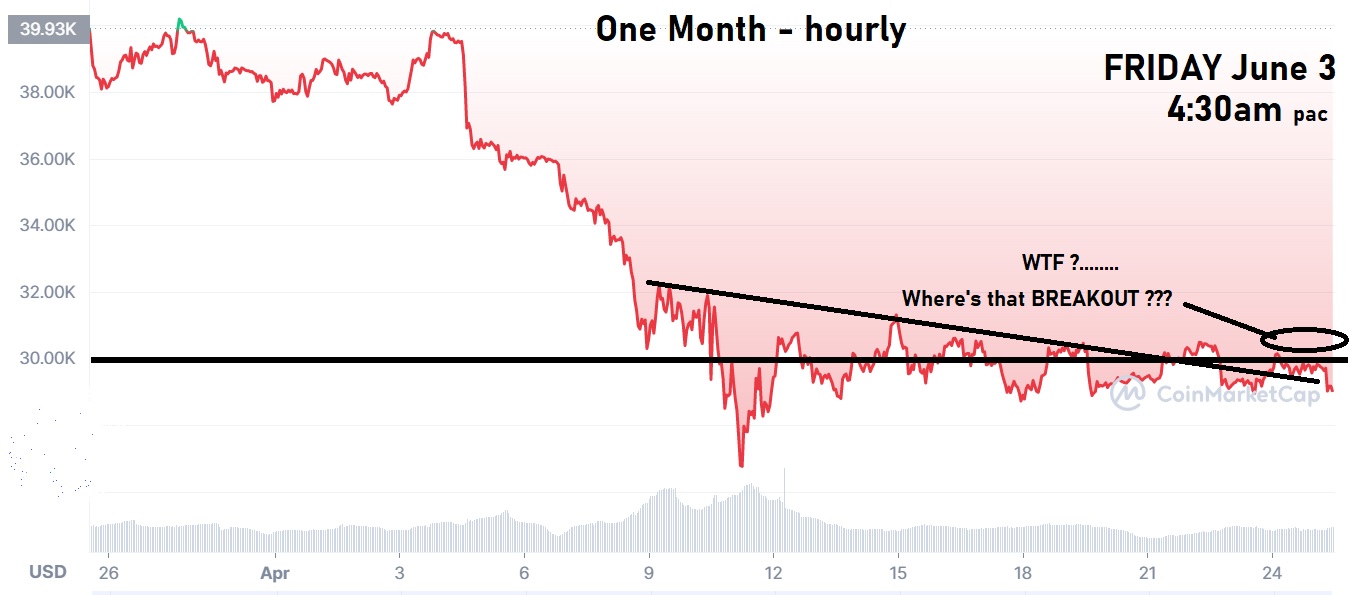
This morning I checked again and look, it's correct !.......It's suddenly, mysteriously, suspiciously "correct" !
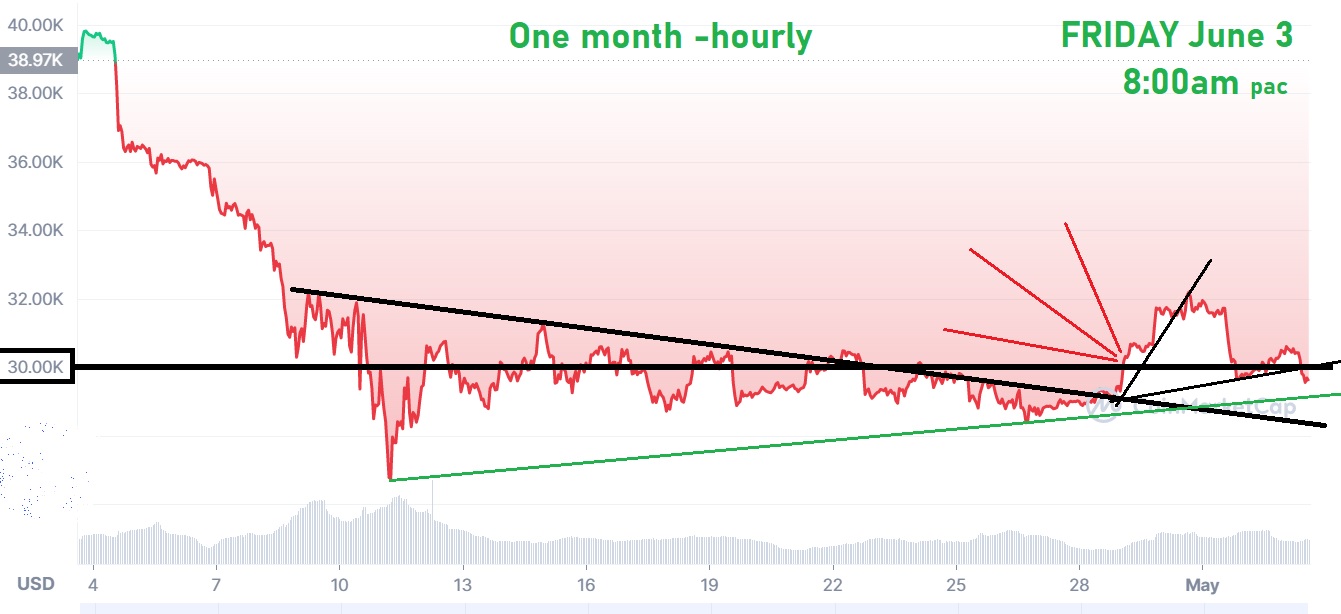
Market is down because Bitcoin is down.....
The Risk-ON / Risk-OFF Indicator turned RED........
Probably sometime (I'm not sure just quite WHEN), The Establishment simply decided to conceal it.
ha-ha
At any rate ;
Well okay, I see that we're now back in business......and I see that the SPY has almost re-visited 410
410 being the/a level I've been RIDICULING ALL MONTH. !......
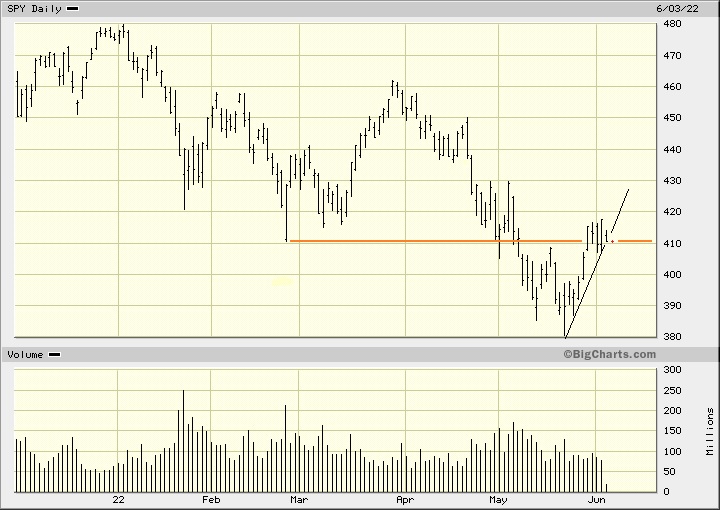
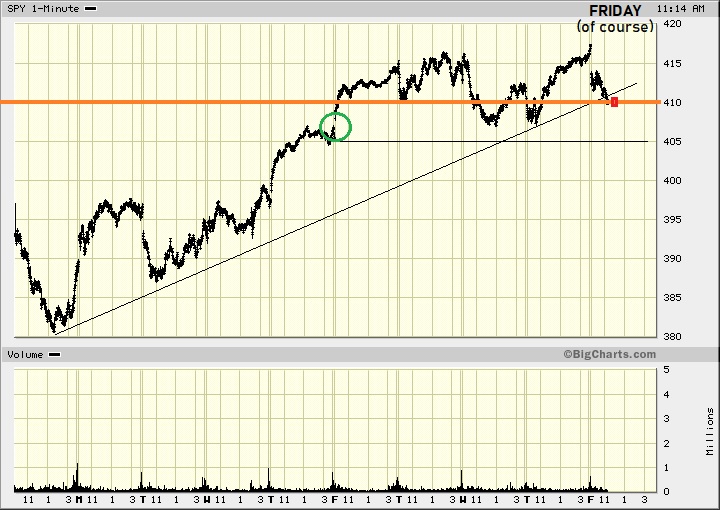
BASIC, Elementary and SIMPLE T.A........
The more simpler ya' can get it, the more better off you will be........IMHO
.
| Volume | |
| Day Range: | |
| Bid Price | |
| Ask Price | |
| Last Trade Time: |
