 News
News  Market Data
  Discover
Support: 888-992-3836
Copyright © 2023 InvestorsHub Inc.


FlyFishingStocks
![]()
Register for free to join our community of investors and share your ideas. You will also get access to streaming quotes, interactive charts, trades, portfolio, live options flow and more tools.
Register for free to join our community of investors and share your ideas. You will also get access to streaming quotes, interactive charts, trades, portfolio, live options flow and more tools.
TA is doing just fine.
Remember, your gains (unverifiable/debatable) are on paper :(
My gains are in the bank :). Thank you TA!
No, it is not impossible. Right now, there is insufficient confidence in AMRN stock to push prices into a higher trading range. We should be seeing a breakout / run up to the 80% look, but it seems as though the AMRN market is indecisive and senses something isn’t adding up to what they’ve been led to expect. So we entertain possibilities as to why that might be.
The lack of 80% news isn’t necessarily bearish or this pattern would bust. I believe if they were to announce a bypass (no pun intended), it would surprise the market in a very bullish way. I don’t think investors ever really embraced the idea of an IIA look anyway. The strategy was engaged to keep them in the game in hopes there ROI could be realized sooner.
From a management perspective, why risk a potentially bearish setback of an “80% continue” announcement (enabling the likes of Pyr to profit from a bear raid) when the trial completion is around the corner in a matter of months? After all, hasn’t trial completion been their intention from the beginning?
Switching to such a strategy gives them the best of all worlds. They save precious cash, the market perceives it favorably – igniting a run up, and they don’t have to face the potential ethical ramifications of continuing a trial that needs more time to bake the SEs while the PE is/was worthy of a stop.
Perhaps, on the heels of the recent CC, the Baker Boys and other moneyed interests decided to put pressure on the board to consider this??
That statement does not make it "impossible"
Management's statement is vey vague. Vague enough to change without ramifications, so I think anything is possible.
Is it possible that they are closer to 100% then they anticipated? Are they delaying an announcement of foregoing the 80% in lieu of a final assessment earlier than anticipated? Benefits: saves expenses, surprises the market, enables expanded indication earlier than planned.
Remember the placebo arm is full of sick subjects getting sicker/older each day . Massive amounts of mineral oil are not helping them with endothelial repair and elevation of mood, energy and overall outlook on life. Perhaps, in response to these efficacious properties, the separation of the two arms has gone exponential?
Caddie, Clearly you've chosen a strategy of holding through thick and thin and when the price moves against you, you double down for more payoff at the end. I respect that. This board is a free board for discussion of anything related to Amarin and or the market forces that might impact prices short and long term.
I have chosen a different strategy so why does it bother you so much?
Don't confuse me with fishyfingers. His supply, demand, 'smart money' arguments don't always fit depending on changing conditions, consolidation periods/patterns, etc. Sorry, sorry,.. I know you don't want to hear this TA circus trash.
BTW, I thought you said you wouldn't respond to my posts anymore?? Why is it you break your promise on down days?
Cheers,
FFS
So as usual FFS you ignore your obviously documented fallible predictive capability.
"displayed temperament? Haha. Dude,.. you're upset about this:
And OMG,.. it is happening:


Why poke the bear?
Seriously, you spent a few days digging for a casual response I made to a smart-A poster who does nothing but harass? Your life has been reduced to " going postal?"
I will pray for you....
AMRN trades to date:

You're right, the underlying rules do change based on volatility induced market conditions. Precisely my point. So many fail to realize when the switch gets tripped and selling at resistance trumps buying at support, leading to a lower market. I have specific monitors that identify those changing conditions and specific checklists for each trade condition. The colors on the spreadsheet represent those respective periods.
No, this is an IRA account that auto-trades a set amount each trade based on this new model I developed. It does not include other stocks (AMRN, etc.) or ETFs that I trade in my margin account. It operates based on backtested rules for each Market season/pattern signal, with specific rules for varying exit modes, all automatic which removes emotion. It is a beautiful system, but very boring!
No, this is not my total trade history.
This is a new model called TreasureMap that I implemented at the first of 2014. It is a pure timing based system using 3xEtf of the indexes
Yep:

each time you foretold doom and gloom for AMRN.
Please provide quote of me foretelling doom and gloom for AMRN.
Let me quote what I said, "What will happen to AMRN? Good news, bad news. Good news is the 6 month long Ascending triangle pattern is still in play (marked by higher lows). The bad news is it looks like we will test the demand trendline near $3 before we see a substantial bounce."
I can understand why some can lose so much money in the markets when they explain away all warning signs.
TA is about reading the people behind the number
The people behind the number don't contribute to your account balance. Numbers do; price x shares. Don't make it rocket science
dm, 2 things.
1. I think it's safe to say quite a lot of forthcoming economic positives are priced in as represented in this chart:

2. 298k vs 188k is NOT bullish for prices at this stage. If there was any doubt what the feds next mover will be, this number has virtually erased it.
haha,.. what the heck is that supposed to mean? If you understood just a little about TA, you would realize that sometimes "good news" is "bad news," especially when the rumor has been so far overbought that we have smashed all records - including those just prior to the crash of 1987. Now we sell the news because this short term trend is no longer sustainable
Not true. Blow off the top action kills markets
LOL. Priced in. What it unfortunately means is that the fed will most certainly raise rates again.
That's all you have to say regarding my analysis? This quote has already been shared. IMO, the statement is no security blanky or excuse to cling to longs as the bottom falls out.
Look,.. I'm long AMRN, believe in the science and fully expect this beautiful pattern to resolve up in a big way. I hold a substantial position and trade a percentage of it. I am a trader thru and thru and if trendline support breaks, I will not hesitate to sell AMRN, despite what JL or his alias HDG says and has been saying since $19.00 a share. It's all great science but most of you are under the ice line, sitting on enormous losses because you've refused to embrace the technical message.
Right now that message for the general market is saying we have bumped our head on the ceiling and it is awakening the bears. When/ if the general indexes evaporate, nearly all stocks get hammered regardless (especially bios). So if you are holding a 'diversified' portfolio of small microcap bios, you might be wise to at least appreciate the warning rather than dogmatically throw out a broad Peter Lynch quote in response or some story about how easy it is to make a fortune buying bottoms like 1987 LOL.
Nope, holding 120k shrs. unless and until the trend is broken.
Just trying to be objective. Numbers don't lie.
I totally agree with his statement, especially since he has an eye for minivans and is probably not as astute with TA. There is a saying in TA: bottoms are clean, tops are dirty. The key is to recognize the big wave change and ignore the ripples.
There's always early symptoms and leading indicators of a sea change when investors switch to a preference of selling at resistance versus buying at support. If you can be unbiased and heed those warnings, I believe it can protect against 6 months of pain. Besides, I make the most with least shorting the market because stocks 'climb up stairs and fall out of windows.' To each his own
But hey, thanks for your concern.
What the charts are telling us:
First the general market. The selloff is beginning. Small caps are first to be taken out back and shot. I posted this chart of the Russel 2000 small cap index on 3/2/2017:

Here's what that index looks like now:

How much lower will it go? The contra-ETF for the index (TZA) gives a clue as it broke out of an ascending triangle late in the session today, suggesting more broad market selling to come:

What will happen to AMRN? Good news, bad news. Good news is the 6 month long Ascending triangle pattern is still in play (marked by higher lows).

The bad news is it looks like we will test the demand trendline near $3 before we see a substantial bounce.
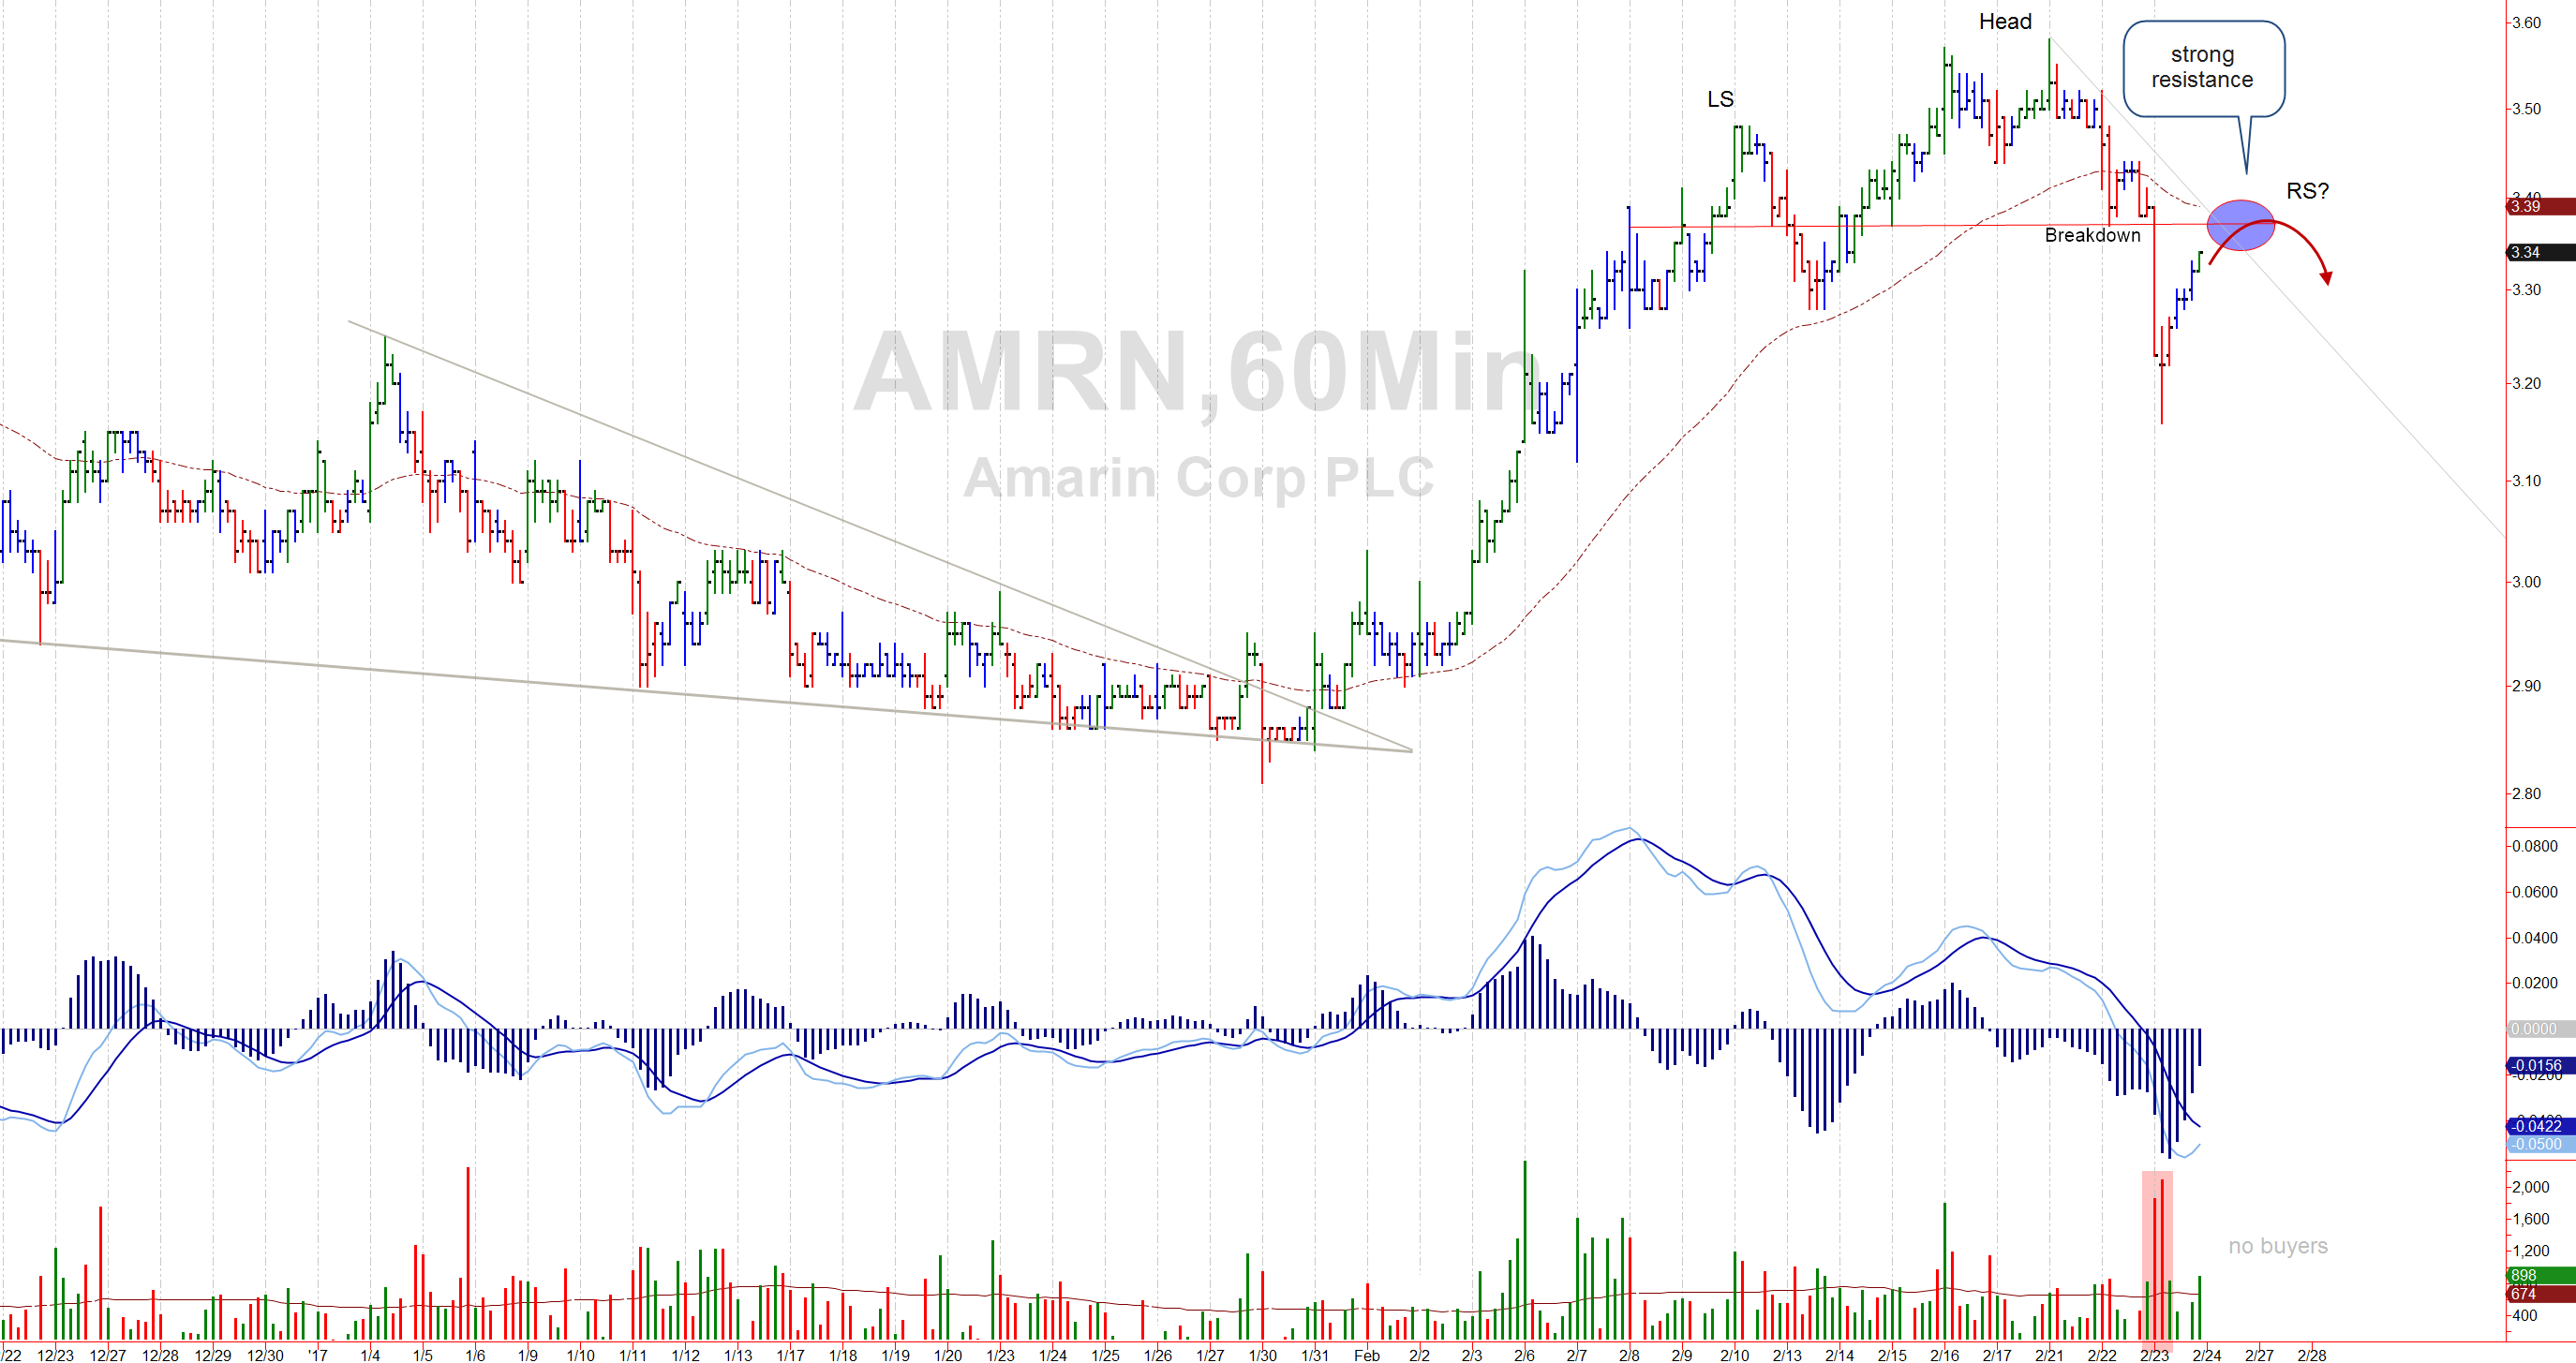
Many on this board disagreed with me when I posted the following chart on 2/24/2017:
The current version of this chart shows a failed attempt at the previous high which traced a lower high; the right shoulder of a head and shoulders top pattern.
Finally a look at what/when to expect another leg higher. I posted this daily chart on a few weeks ago showing the timing of reversals associated with MACD bullish crossovers:

Based on where we are today (depending on what the broad market does), we have more sideways to down consolidation before we can be hopeful again:

Waiting patiently......
AMRN will be fighting a nasty headwind:
"Citi's Matt King has issued a new, long-awaited note in which he asks rhetorically "what’s a manager supposed to do when by early March your asset class has already exceeded your expectation for full-year returns? Take profit and take the rest of the year off, of course! And if it carries on rallying, go outright short!" And yet, he adds, "somehow nobody seems to want to." The reason for that, according to King is that as we showed demonstrated last week using JPM and BofA data, "the rally owes more to inflows and short covering than to institutional investor exuberance.
Nonetheless, King's assessment of the current environment is downbeat and to the point: 'sell we think you should, not only in € credit (as we advised a couple of weeks ago) but also more broadly.'"
He then lays out seven reasons "not to trust your inner Trump"
Small caps (IWM/TZA) are leading the markets lower.
This is poor timing for a sharp sell off while we wait for R-It results.
share one article please. You can't say hundreds without citing one and still portray validity
Fact is, there are bulls and there are bears. Both have their respective opinions. Don't you think it's dangerous to ignore technical signs of a an extreme blow off? Maybe not.
Kiwi, Starting in Sept ...anyone following the indicators you use FFS ,could see that the RSI and Slow Stochastic indicators were flashing extremely over brought. Early sept the market was hit with huge volatlity ...80 pt moves ( large in those days ) both up and down ...finally the market cracked , orders weren't executed , brokers
stopped answering phones and the market crashed.
What's the difference now? Did you bother reading the comments by Alex? In case you didn't, I resubmitted. You might find it useful if you can park your bias for a moment, especially if you are still holding the micro-crap bio startups you listed several months ago (what were those? And are you long AMRN?).
P.S. What's wrong with Tyler Durden/Zero Hedge. He calls it like it is. No coolaid.
JL, in 1987 (I doubt you were in the market) immediately after the crash the market was down about 40%. In a month or so it recovered close to its pre-crash levels. For people who had cash and balls this was a great buying opportunity and people who did made fortunes...
Trouble is, they won’t have the cash because they are leveraged on margin (remember the record margin debt?). Furthermore, they won’t know when to buy sell or hold as it is easy to become frozen in a prison cell of fear once this plummets in a flash. Consider these comments yesterday by Alex Merk,
Everyone is happy, including the investor. Except when the lead market maker has a glitch. Suddenly, just about everyone withdraws liquidity because something appears wrong. In addition, Dodd Frank discourages traditional market makers to provide liquidity. Flash crashes can then occur when investors place market orders in the wrong belief that the system will take care of them. As a result, in our opinion, the current design of the system makes the periodic flash crash a near certainty.
Risk is merely masked
In the past, I have compared central bank efforts to suppress risk akin to putting a lid on a pressure cooker. It should come as no surprise that taking the lid off might cause a spike a volatility, e.g., a taper tantrum. In the meantime, while the European Central Bank (ECB) and Bank of Japan (BoJ) are still ‘printing money’, the Fed is trying to raise rates.
Market crash?
The logical next question is whether investors are being fooled. If higher asset prices are more due to a short-squeeze than fundamentals, and if on top of that, the Fed is more aggressive, are we setting ourselves up for trouble? The stock market crash of 1987 comes to mind.
Buying the dips can be irresponsible
When markets are in a panic, the pundits tell us to buy the dips. As proof, they show the recovery we had from the market bottom in the financial crisis; or any other dip we have had since. With due respect, that too is the wrong way to look at the issue. Investors ought to invest according to how much risk they can stomach. If they had properly rebalanced, they would have taken chips off the table ahead of the financial crisis and then had the resources to deploy cash at the bottom. Yes, in that case, absolutely, buy when prices are cheap.
But that’s not how many portfolios look. Many investors go along for the ride during the good times, and are over-exposed to risk assets. They chase returns because they don’t have enough money to retire. Then, when the market plunges, they lose a great deal of their net worth. Are you telling me that the appropriate way to react in that situation is to double down and put a now disproportionally larger portion of your net worth at risk? If you cannot stomach the risk of an investment, stay away from it. When you lose money, you can afford to take less risk, not more risk. Any pundit suggesting otherwise is, in my opinion, irresponsible.
More dogma. Please explain why you thing it is FUD. This news could potentially be golden, depending on what you do with it.
Now, what is your opinion regarding how such a sell off would affect AMRN stock price:
1. Before 80% announcement
2. Post 80%, if continue
Are you capable of playing the Devil's advocate?
What would happen to AMRN stock if the market crashed?
Some of the headlines are ominous:

say what you want, you always do but this is hard to beat:

(thru 2016)
Good luck to you all. I've taken about as much dogma as I can stand.
VuBru, will all respect, this statement was in reference to market selloffs, not R-IT results. You and others on this board are so locked into your own feel good bias. You've talked yourselves into seeing things one way: "black is always white." When conditions begin to change, calling for protective strategies, you make statements like "1987 was one of the greatest buying opportunities of all time." LOL, that's absurd. Do you have any idea what a sharp, sustained decline will do to most - especially when we are at record margin levels? It will wipe them out in short order! But the real damage occurs to their psychological view on the market. Do you think they'll want to jump back in in 6 months when it begins to climb-fall-climb-fall-climb? The bottom of 2009 gave 4 fake outs. First the crisis slammed people's accounts FWIW - I was reading some results of quantitative modeling of what would happen if you bought and hold major indices, versus various combinations of selling/buying based on the Fear/Greed index (e.g., sell when overconfidence appears as indicated by a very high greed threshold and vice versa). It was instructive. Returns over time were dramatically lower using any method of trying to time sells/buys because one never knew accurately in advance when to repurchase, so tended to miss out on large gains. This seems to be a consistent message I have seen many places - timing does not work over the long-term despite our illusions that we have a perfect system or are smarter than everyone else (Nate Silver's The Signal and the Noise has a good chapter in this).
till they couldn't stand it any more and they capitulated. Then they swore they were done with stocks until recently when they finally realized it is a bull market again - back in at the top - ready once again to blindly charge in to a slaughter.
I disagree with your statement,
That is your perspective - which confirms my quote above. Fact is, when you embrace this, "it always comes back" mindset and that, "no one can time the market," you ignore any short or long term warnings, stall like a deer in headlights and get swept down with the markets. That's all well and good IF you have the resolve to ride it out (and you are not on margin...), but that's not human nature. In actuality, most sell at the bottom and buy at the top. They capitulate as a result of emotional distress.
Beware of the common message in the following charts.
Kerry Lovoorn, Spike trade posted these charts showing comparisons of the crash of 87, Russian crisis and the current market. He compares market new highs/new lows and their negative divergences with overbought levels (as measured by weekly ATR = average true range levels) to draw striking comparisons to market TA conditions leading up to these sharp market selloffs.
First the current market:

Next the market surrounding the 1987 crash:

Then the 1998 Russian Crisis:

Finally the 2007 Top:

"A stock market crash is a rapid and often unanticipated drop in stockprices.
A stock market crash can be the result of major catastrophic events, economic crisis or the collapse of a long-term speculative bubble.
However, public panic is a major contributor."
So you think any sharp drop in stock prices after such a recent run would be "unanticipated " !
or ...we are facing a " major catastrophic event / economic crisis "
or a ... "public panic "...such as the run on banks during the housing meltdown .
LOL! Now you are being unreasonable and raf-like by distorting what was said/quoted and by whom.
These are not my words. It is a quote by INVESTORPEDIA:
Here is investorpedia's def of a crash:
"A stock market crash is a rapid and often unanticipated drop in stockprices. A stock market crash can be the result of major catastrophic events, economic crisis or the collapse of a long-term speculative bubble. However, public panic is a major contributor."
Stock Market Crash Definition | Investopedia
So you think any sharp drop in stock prices after such a recent run would be "unanticipated " !
or ...we are facing a " major catastrophic event / economic crisis "
or a ... "public panic "...such as the run on banks during the housing meltdown .
I’m not saying we’ll crash like 1987, but markets that refuse to drop are subject to the eventuality of violent corrections laced with volatility. What I said in my earlier post was, "This current setup has the unique signature makings of a potential crash, Ala 1987."
All combined, we are currently aligning with the events represented by these examples IMO.
Not much difference. Crappy watered down regulation that does little to restrict banks from abuse.
You seem confused about the definition of a crash and seem to think a sharp 10% sell off/ correction is nothing more than a buying opportunity.
Here is investorpedia's def of a crash:
"A stock market crash is a rapid and often unanticipated drop in stockprices. A stock market crash can be the result of major catastrophic events, economic crisis or the collapse of a long-term speculative bubble. However, public panic is a major contributor."
Stock Market Crash Definition | Investopedia
Proven fact, that fear and panic forces capitulation at the bottom rather than buying at value - proven fact.
What Warren doesn't tell you is the reason behind those fed induced lower rates designed to boost mortgage lending, increase stock market values and generate a 'wealth effect' in order to stimulate the economy via spending. The side effect? A bubble.
JF, And if it happens tommorow, FFS will be right, but it'll be serendipity and the roots won't be discovered in a chart.
You can miss the forest for the trees when you're hyper focused on eloquence. The chart is like an electrocardiogram representing distinct signatures of (as you say) roots that grow an excess of cardio maladies IF you know what you're looking for. Charts provide an effective diagnostic determinant to the combined elements that wipe people out by surprise in the markets.
Kiwi, thanks for responding and sharing that important information. Where do I begin. First of all, I read a lot and am aware of the blogs/experts you cited. Personally, I look at things that have patterned synchronicity whether fundamental or technical or (hopefully) both. Setups, if you will, that echo the same warning or message.
3 things that point to trouble:
1. Margin. I agree with the article somewhat. We have had record margin levels since 2012 thanks to a fed that has backstopped the market with QE I, II, and III. That has led to off the charts complacency. Also, I agree, margin debt is not a leading indicator, rather one of many that support the same message.
2.Banks. Simple fact remains: they have yet to fix the misguided banking regulation that marched us into the 2008 crisis. Banks can do anything they want - steal, cheat, trade against clients, or lever up on the weapons of mass destruction = derivatives. I won't even get into the fact that they are like dominoes on a worldwide scale or the effect of trillions of central bank bailouts.
3.Stock values. You say that 1987 like wild speculation does not exist today, what? Here's is where TA comes in. We have recently seen 11 straight record highs (something that has never occurred in history) on nothing more than the hope of greater earnings. This has been primarily based on a worldwide flood of speculation on Trump's friendly business policies - many of which are rhetoric without detail or back-tested merit.
Look at the following charts a friend of mine (Kerry Lovvorn, Spike Trade) posted showing comparisons of the current market, crash of 87, Russian crisis, and the 2007 top. He compares market new highs/new lows and their negative divergences with overbought levels (as measured by weekly ATR = average true range levels) to draw striking comparisons to market conditions leading up to these sharp market selloffs.
First the current market:
Next the market surrounding the 1987 crash
Then the 1998 Russian Crisis
Finally the 2007 Top
I’m not saying we’ll crash like 1987, but markets that refuse to drop are subject to the eventuality of violent corrections laced with volatility. What I said in my earlier post was, "This current setup has the unique signature makings of a potential crash, ala 1987."
All combined, we are currently aligning with the events represented by these examples IMO.
Kiwi, please explain your position as to why conditions now vs 1987 are different. I can draw several parallels. Do you not think it is a "rare event" to rally for a record straight 11 days (Dow) on top of extreme overbought levels? That is the best streak since,.. you guessed it, 1987.
You should know that this board does don't tolerate "just because" or "so and so said so"
P.S. It's FFS. FF is fishyfingers, the other guy who defines bars as bullish or bearish, grades them as high volume, very high volume and is always late with his analysis (but that's OK, because he's in it 'long term')
Brace for a gap down on the Dow, Nasdaq, S&P500, leaving behind a "Trump island" reversal. This current setup has the unique makings of a crash, ala 1987.
I hope AMRN can maintain its long term uptrend if such a selloff were to occur.
Added some:

what went wrong with you falsely thinking that S&P and Nasdaq
would collapse?
I was a day too early. We'll see. I'm putting my money where my mouth is (bought UVXY near the close):

The VIX is not buying today's climax move and is suggesting stormy weather on the horizon. Buckle up folks
Whaat? Dude, do you grow shrooms or something? Don't understand a word you said.

