 News
News  Market Data
  Discover
Support: 888-992-3836
Copyright © 2023 InvestorsHub Inc.


SilentOne
![]()
Register for free to join our community of investors and share your ideas. You will also get access to streaming quotes, interactive charts, trades, portfolio, live options flow and more tools.
Register for free to join our community of investors and share your ideas. You will also get access to streaming quotes, interactive charts, trades, portfolio, live options flow and more tools.
Silver/gold ...
Cover silver shorts and look for a long by tomorrow's close IMO. We could see another good rally after the FED conference tomorrow. Only for those willing to trade the swings. This is based on hourly cycles for PMs.
There is a 14 week cycle low due for PMs here this week and if it works, then another rally is due into a high by early June. This would likely be driven by gold and the miners if it works. It becomes an increasingly risky trade going forward as an important US Dollar low is due in the coming weeks (and corresponding intermediate top is due for gold/silver and PMs in general.
cheers,
john
Silver cycle peaks analysis
http://investorshub.advfn.com/boards/read_msg.aspx?message_id=62410302
cheers,
john
Silver ...
For the brave. Sentient is not too optimistic on higher prices. Based on the spike to $50 overnight, I think that level will be resistance for now. But price action may involve a double peak here and into May.
The chart below is based on a peaks analysis. An intermediate peak came in Nov./Dec. (48 weeks), and a 25 week peak is due now into May.
If you go with this peaks analysis, another rally is due for silver late this year or into March 2012 (based on a 23 month cycle).
Been daytrading silver shorts (HZD.TO) today.
cheers,
john

There is an astro important turn for PMs here today into Monday. With silver so stretched out, it would not surprise me if we see a top. But predicting this has been a mugs game.
cheers,
john
$SPX Hurst Cycles
http://investorshub.advfn.com/boards/read_msg.aspx?message_id=62309703
cheers,
john
hi slinky,
The $SPX has made its 40 week low, although Sentient is hedging its bets. I think the reason is that we had a bit of a bifurcated market off the 2010 summer lows. Some stocks bottomed in July into the nominal 40 week, and others came late in the first week of September. This could give us some volatility in the coming days, but generally the pressure should be to the upside in this 10 week cycle. I'm still looking for a top by early June.
cheers,
john
http://www.sentienttrader.com/
Sentient view on Monday:

After yesterday's close:


$SPX Gann
hi Doc,
Been away cruising the last week - much needed R&R. Got back late yesterday. I'll need more time before commenting on Hurst thoughts. But here's some other things I look at.
Merriman has a turn for late April (ie. 22/25) for many markets eg. stocks, PMs, currencies etc. This is both in the 2011 annual forecast book and in recent musings. The April 1-4 turn was of course a high to this 5 week cycle off the March lows.
The Gann chart below also has a possible turn for the weekend of April 23rd. So ideally a low there would be a swing long buy. If it is somehow a top, then bulls have a problem IMO.
You can see how the larger Gann diagonal is presenting resistance. I saw this possibility back in late Feb., and the $SPX is still dealing with it. The 2x1 fan (red line up from the July low) should be support on any pullback from here. Again if Easter weekend presents a high for some reason, this is going to be a difficult market. I'm still looking for a rally into a June high.
cheers,
john
Gold and HUI Hurst Cycles ...
http://investorshub.advfn.com/boards/read_msg.aspx?message_id=61763274
Gold and HUI Hurst Cycles ...
In my experience, gold and the HUI do not follow the Hurst nominal model. Hurst even talked about this in his course material.
A 14 month cycle is very important for gold and the HUI, one I have tracked for some time. It distorted a bit with the Nov. 2008 low into the Dec. 2009 peak (very right translated). But it looks like it has come in here. I can't believe my eyes if this is true given where gold and silver are trading. If you are thinking short here, be careful. HUI 611 is a major Gann fib and price is not far away.
Hope you are well bubbleboy.
cheers,
john

http://www.sentienttrader.com/
$SPX is on the verge of a breakout to new highs ...
cheers,
john
$SPX Hurst 40 week low is in (March 16th), and March 29th was very likely a 2.5 week low. So it is basically buy the dips look for long entries in stocks this week and next.
Long play from Friday was TCK/B.TO, HBM.TO, and S.TO. Copper bottom and 40 week low for these stocks.
cheers,
john
Uranium stocks seen playing catch-up to spot price
http://www.theglobeandmail.com/globe-investor/investment-ideas/features/eye-on-equities/uranium-equities-seen-playing-catch-up-to-spot-price/article1967119/
Uranium equities and the spot price of the commodity bottomed out in mid-March as the magnitude of the nuclear crisis in Japan was broadcast to the world.
But since then, there’s been an interesting divergence between the spot price and uranium equities as a group, with stocks underperforming in the recovery. (See chart below). The uranium spot price rebounded from a low of $49.25 (U.S.) per pound on March 16 to $61.13 on March 24, a gain of 24 per cent. Over roughly the same time frame, a market capitalization-weighted index of equities rose by only 15 per cent - and came under renewed selling pressure in the last week of March.
So what's going on? RBC Dominion Securities Inc. analysts Adam Schatzker and Fraser Phillips believe it’s because spot uranium buyers and sellers are different than equity traders - with a much more intimate familiarity with the nuclear industry. “The spot buyers and sellers appear to be much less prone to the emotional swings that affect the general public, including those trading uranium equities,” the RBC analysts said.
While the commodity traders remain focused on a physical market with tight supplies, equity players are reacting more to the daily news flow of events out of Japan, which lately has shifted to concerns about the spread of radioactive contamination. “We think that the uranium equities have, in many ways, become a barometer for sentiment of the major news outlets of the world,” Mr. Schatzker and Mr. Phillips said.
The takeaway: equities should catch up once events in Japan become more of a distant memory. “We continue to believe that the uranium industry will again find its legs and that the public perception of nuclear power will shift positively,” the analysts wrote in a report.
“We think that the uranium equities will perform better toward the end of 2011 into early 2012 as the full scope of the Japanese crisis is better identified and attention is again focused on clean, economic electricity generation.”
Upside: Noting that uranium equities are now trading below their estimated net asset value estimates, RBC expects higher prices over the next 12 months for all uranium companies it covers.
Among its favourites are Cameco Corp. (CCO-T29.440.280.96%), with a price target of $38 (Canadian); Ur-Energy (URE-T1.710.116.88%), with a target of $2.75; and Uranium One (UUU-T3.910.112.89%), with a target of $6.25. All three have “outperform” ratings.
CCJ
Levels are:
33.86 (50% retrace of 07-09 bear leg)
28.34 (50% retrace of 09-11 bull leg)
Not sure what the catalyst would be for a big bounce, but a retest of the 34 level is likely.
So who's who here? I know who gray18 is.
Here's a great uranium blog.
http://techuranium.blogspot.com/
cheers,
john
P.S. I don't have PM privileges here.

OT - Until now a high dose, multiweek course of prednisone always did the trick. But not last weekend. I ended up having an IVIG this week. No option really. I did have my spleen removed years ago so that got me off taking prednisone long term.
For me there are triggers. Stress, (taxes arghh, international moves, and the markets on occasion) and some environmental (chemicals like chlorine) I'm aware of. I like good wine so I have to be a moderate drinker.
What worries me longer term is that this autoimmune condition morphs into something else. It does keep me focused on what's important. :)
P.S. Thanks YM for the PM. I don't have email privileges here.
OT - Autoimmune diseases ...
are tricky.
I've got a 25 year history with something known as ITP:
http://en.wikipedia.org/wiki/Idiopathic_thrombocytopenic_purpura
Platelets crashed to nothing last weekend and I ended up in hospital needing an IV blood product.
You hit 50 and sh__ happens!
cheers,
john
hi BT,
Yes I think that is very possible. We'll probably know for sure after mid-week next week. I've been away from the markets this week due to health reasons.
cheers,
john
Gold Market - HGNSI
Seeing this today confirms to me that the bigger cycle low for PMs that I am looking for is still in front of us. A 14 month cycle low will be marked by very low HGNSI levels. Now's the time to be careful.
http://www.marketwatch.com/story/gold-market-optimism-at-worrisome-levels-2011-03-29?link=home_carousel
By Mark Hulbert, MarketWatch
CHAPEL HILL, N.C. (MarketWatch) — As expected, gold quickly recovered from the $50 plunge it suffered over a two-day period immediately following the Japanese earthquake.
Unfortunately, because of abnormally high levels of bullish sentiment, gold’s near-term direction is now more likely than not to be down rather than up.
Consider the average recommended gold market exposure among a subset of short-term gold market timers tracked by the Hulbert Financial Digest (as measured by the Hulbert Gold Newsletter Sentiment Index, or HGNSI). It currently stands at 67%, which means that the average gold timer is allocating two thirds of his gold portfolio to gold and gold-related investments, keeping only one third in cash.
To appreciate just how much bullishness this represents, consider that the highest the HGNSI has risen to over the last two years is 71.9%, only slightly higher than today’s reading. Over the last five years, furthermore, the HGNSI has never gotten higher than 75.2%.
In other words, the current HGNSI reading is within close shouting distance to what in recent years has been the highest level to which bullish sentiment has risen in the gold market.
According to contrarian analysis, of course, the odds are against the majority point of view — especially a majority as big and strong as the one that exists currently in the gold market.
If you find this conclusion to be upsetting, I have a couple of things to say. First, you evidently are part of this strong bullish majority that is, from a contrarian point of view, part of the problem.
Secondly, and perhaps more importantly, bear in mind that contrarian analysis is a very short-term trading tool. To the extent it works, it anticipates market moves of just a couple weeks’ duration.
So you can still harbor longer-term hope.
For example, it may very well be that gold will rise to the $2,000 level by year end, as fellow columnist Peter Brimelow earlier this week quoted Jesse’s Cafe Americain website as saying.( Read Brimelow’s Mar. 28 column.)
But if contrarian analysis is correct, gold’s path to that year-end level involves at least a short-term detour first.
RCKS,
The nominal $SPX low may be in for the 40 week low, but I am waiting till April 1-4 before taking new longs again. I did take longs in $TSX ETF plays etc as well as $SPX, and will hold TSX longs as it's likely stronger than the $SPX.
The low on March 16th was likely a 2.5 week low, and until we get to the next 2.5 week cycle low, I can't be sure.
http://investorshub.advfn.com/boards/read_msg.aspx?message_id=61026786
cheers,
john
skidstreet,
I'm thinking short term high here (into Monday?) for precious metals and a 14 week cycle low is due in April which would be another long entry. I would only look for swing longs in the sector until it doesn't work anymore (ie cycles turn bearish). BTW, the last 14 week low was in Jan.
cheers,
john
Take some profits on longs here ...
BTW, I was in the windy City weekend before last. Its been a long while since I visited. Great city.
GLGT.
cheers,
john
Go Hawks go!
Toronto (TSX) has likely made its 40 week cycle low this week. It typically bottoms earlier than the SPX. There should still be a test at month end (by April 1).
$SPX Hurst Update
Decline into a Hurst 40 week low is in progress. The crisis in Japan finally got the downside momentum going. Now we look for a cycle low to arrive. Nominally it is due late March (by April 1). A 2.5 week low is due at anytime which should lead to a bounce. The 20 week FLD was crossed to the downside yesterday and projects a target of ~1220 for the 40 week low. The 40 week FLD will drop below the 1200 level into the end of March and should provide support for the coming cycle low. I am waiting for the buy.

http://www.sentienttrader.com/
Finally got the 1286 - 1288 gap fill. A 2.5 week cycle low is imminent and can come here at anytime (today/tomorrow?). This should lead to a FED bounce IMO.
The larger 40 week cycle low is due by late March.
BT,
If we are seeing some kind of intermediate commodity top, silver won't look good for long ...
I have a major peak due for silver at anytime going forward. Today, next week ...
Copper
http://stockcharts.com/h-sc/ui?s=JJC&p=D&b=5&g=0&id=p74350570167
BT,
HUI bellweather NEM is looking pretty ugly. Which chart looks better right now? The USD or NEM?
http://img703.imageshack.us/img703/5961/nemmonthly.png
cheers,
john
hi BT,
Commodity stocks are signalling a problem. Looks like a USD rally is possible here ...
Doesn't look like it wants it this week. That's pretty much why I was not keen on shorts late yesterday. The nominal 40 week low is due late March. Major chop until then? I still think we fill the gap at 1286-1288 some time this month. Doesn't seem like much reward for bears.
A 2.5 week low is due Friday or Monday, so we should see market pressure come back here before the end of the week.
Then of course we will have the FED to deal with next week.
cheers,
john
For a bearish decline, we have to see S&P 1294 taken out. That is the last 5 week low and so far its held.
I'm looking to buy this 40 week low. I'm not that keen on shorts.
cheers,
john
hi Bert,
Thanks for that article and the Hurst link. I do have a nested 40 and 80 week Hurst cycle low due late this year. So a 40 week is due in March, which should yield another rally of unknown quality. I expect a top for this 80 week cycle (started July 2010) in the June timeframe, which can be a double top or new highs.
cheers,
john
den,
My pleasure. Go Hawks go. I have them again in my hockey pool.
cheers,
john
bubbleboy,
Regarding the USD, gold, bonds:
Metals and currencies - gold/silver are in blowoff mode. No way to predict price action near term. A near term USD bounce would do some damage. Larger bounce may not come until May/June.
http://www.ireallytrade.com/TVStation/LarryTV.html
Bonds. I added again to a small position late last week to the Canadian bond side.
cheers,
john
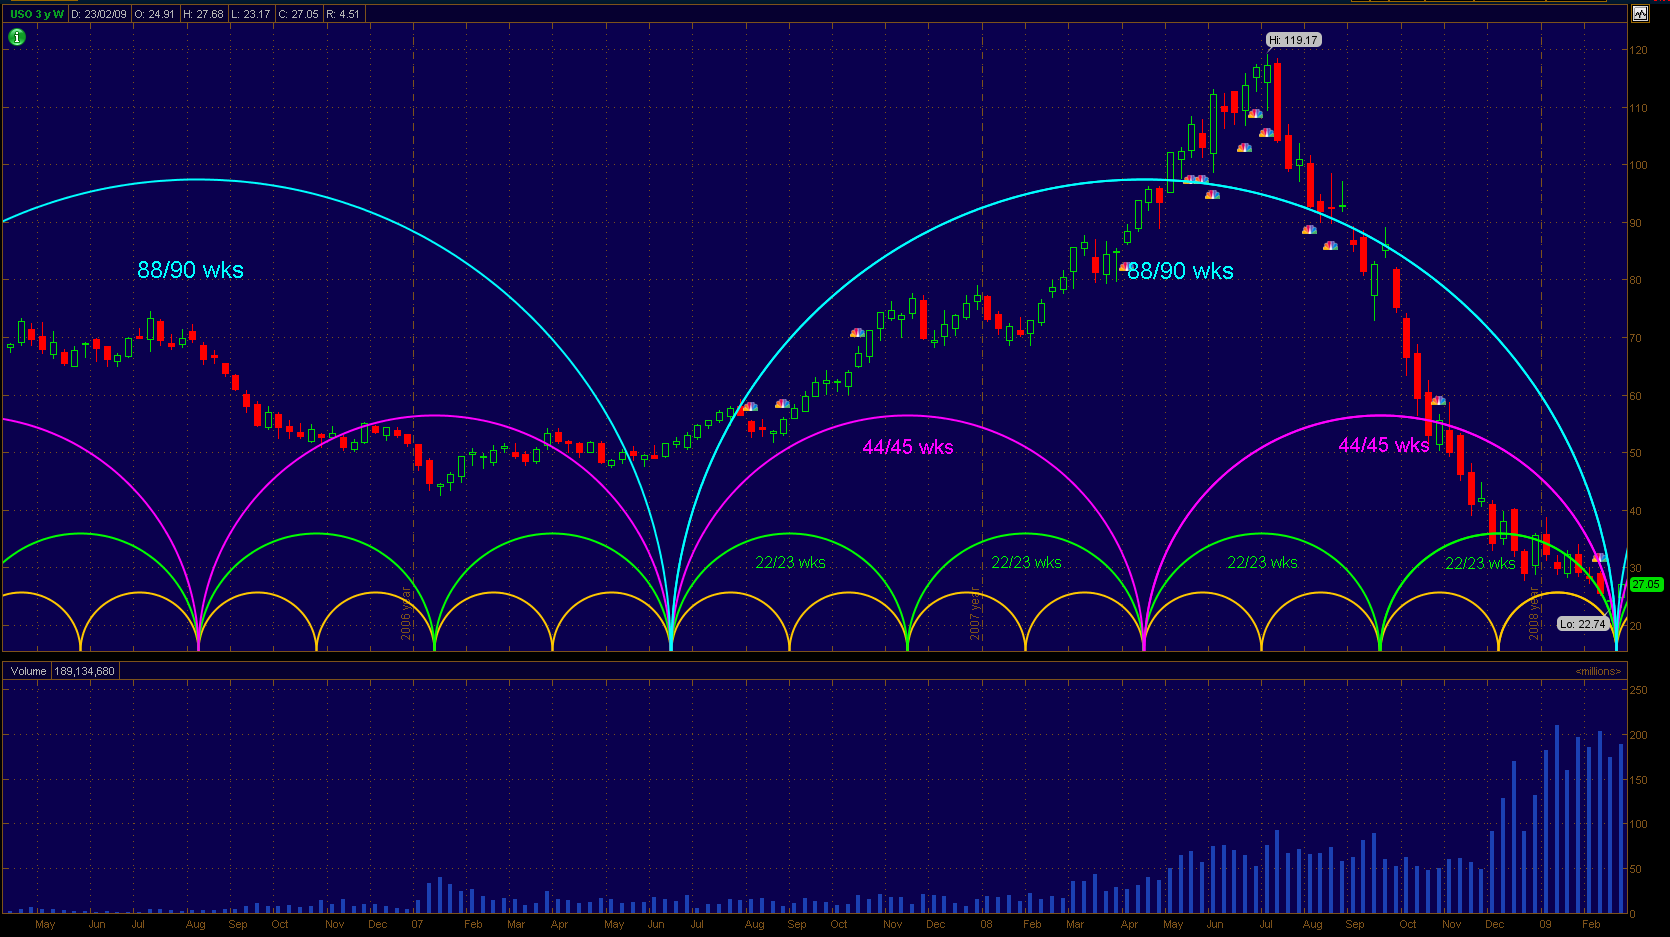
re: Oil Hurst cycles
should read ...
9/25/2009 40 week cycle low
5/25/2010 40 , 80 week cycle low
2/15/2011 40 week cycle low
hi bubbleboy,

If I use Sentient Trader on a Nominal Hurst (NM) setting, here's what I get:
15/1/2007 40 , 80 week cycle low
1/28/2008 40 week cycle low (seems long)
2/23/2009 40, 80, week and 4.5 year low
25/9/2009 40 week cycle low
2/15/2010 40 , 80 week cycle low
I don't particularly like using ST with the NM setting for oil. I think the cycles are longer periods. (eg. 44/45 vs 40 wks).
Yes, 2008 was a pseudotrend on the way up and on the way down as I see it. But the most important thing is what to call the Feb 2009 low. I see it as 4.5 year low for oil (actually runs more like 60 months IMO). If true and we have right translated highs, then oil is in a bullish cycle. Next major low is due early 2012 as you say. I have no idea how and where crude tops out this year.
cheers,
john
P.S. I always thought that this original work made more sense for phasing oil (the low in 2007 being some sort of straddle).
NAS,
Nominally, if Feb. 24th was a 5 week low, then the coming 2.5 week low is due about Friday this week +/-1 day. You'd think that with the SPX heading into a 40 week cycle low we'd see that gap fill this week, even if it is the nominal low for the 40 week.
But the next 2.5 week cycle low due by the end of March could be the actual 40 week low (will be nest of lows for 2.5, 5, 10 20, and 40 week cycles). We may trade sideways through March with a shallow correction or not. Nothing so far seems to take this market down very far. I do want to be fully long after the coming 40 week cycle low.
I expect the FED to have an impact with its meeting on the 15th. If a low forms prior to that meeting, it might be the best long entry for March.
Have to take it day be day here.
cheers,
john
There's a gap down near 1286-88. That will be filled next week.
cheers,
john
BT,
I'm waiting for the 2.5 week low buy next week. It could be the nominal low for the 40 week. But we won't know that until later in March. We'll see.
cheers,
john
BT, astro is bad for next week ...
http://investorshub.advfn.com/boards/read_msg.aspx?message_id=60534849
BT,
I did this chart a couple of days ago when I looked at my Hurst bond cycles. I'd say a top in interest rates could be close at hand. But if the 30 yr rate takes out that last Gann line I've drawn, that could be a game changer.
Let me know when you see a 5th complete on the 10 year.
BTW, the way I read this chart is as follows. If rates hold here in the coming weeks/months and then decline again, that would imply a retest of the 2008 lows. If and when rates break above that Gann line and take out the 5.5% level (last 9 and 18 year low for bonds), it's well and truely over for US bonds.
cheers,
john

BT,
Next week is going to be interesting. I have something for March 9th. A panic low (and a low for your triangle would be better).

But a 40 week Hurst low is not due until month's end. How we trade through March is going to interesting and likely very volatile.
Nice charts.
cheers,
john

