 News
News  Market Data
  Discover
Support: 888-992-3836
Copyright © 2023 InvestorsHub Inc.


Bob-C
![]()
Register for free to join our community of investors and share your ideas. You will also get access to streaming quotes, interactive charts, trades, portfolio, live options flow and more tools.
Register for free to join our community of investors and share your ideas. You will also get access to streaming quotes, interactive charts, trades, portfolio, live options flow and more tools.
You're very welcome Wisdom, it's a pleasure. :)
The AAPT OBV, CMF, and Accum/Dist are doing great.
Have a great day.
Best,
Bob
Hi highstakes, when the SAR (Stop And Reverse, originally called PSAR (Parabolic Stop And Reverse) price dot is above the stock price then it is a sell signal. When the computed price for the SAR is below the stock price, i.e., the SAR "dot," is below the AAPT price or stock price, then it is a buy signal. In this case the SAR signal dot is above the AAPT price and AAPT is now on a SAR sell signal. I just corrected my AAPT chart comments-go back and you'll see I made the correction for AAPT to a SAR sell signal. It will stay a sell signal until the SAR dot is once again above the AAPT price.
Best,
Bob-C
Hi everyone, here is the MDHI daily Renko chart depicting a SAR buy signal:

Cheers, :)
Bob-C
Hi everyone, here is the AAPT daily Renko chart depicting a SAR sell signal:

Cheers, :)
Bob-C
Hi everyone, here is the AAPT daily Renko chart depicting a SAR Sell signal:
Cheers, :)
Bob-C
Hi everyone, here is the AAPT daily chart:

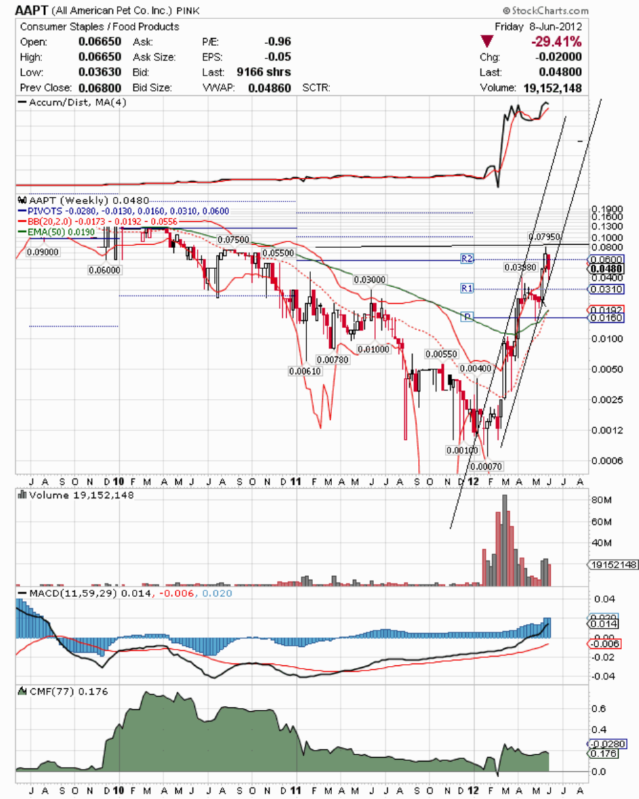
Here is the AAPT weekly chart:

Here is the AAPT daily Ichimoku chart:

Here is the AAPT weekly Ichimoku chart:

Cheers, :)
Bob-C
Hi everyone, here is the AAPT daily chart:
Here is the AAPT weekly chart:
Here is the AAPT daily Ichimoku chart:
Here is the AAPT weekly Ichimoku chart:
Cheers, :)
Bob-C
Hi everyone, is BMSN headed to re-tag .062?
Here is the BMSN daily chart:
Here is the BMSN weekly chart:
Note, please wait for the charts to load-thanks.
GLTA.
Bob-C
Hi everyone, is ENTB headed to its 200 DMA at .1346 or its 40 WMA at .1157? Here is the ENTB daily chart:
Here is the ENTB weekly chart:
Note, please wait for the charts to load-thanks.
GLTA.
Bob-C
Hi smbpainting et al., here is the RTGV 3-year-weekly chart:
The RTGV weekly RTGV CMF, OBV, and Accum/Dist look excellent.
Here is the RTGV daily chart:
The RTGV daily RTGV CMF, OBV, and Accum/Dist look excellent.
Cheers,
Bob-C
Hi MMStockPlay and Wisdom et al., see my posts here.
Regards,
Bob-C
Hi MMStockPlay et al., here is the MDHI 3-year-weekly chart:
Here is the MDHI daily chart:
Cheers,
Bob-C
Hi MMStockPlay et al., here is the AAPT 3-year-weekly chart:
The AAPT weekly RTGV CMF, OBV, and Accum/Dist look excellent.
Here is the AAPT daily chart:
The AAPT daily RTGV CMF, OBV, and Accum/Dist look excellent.
Here is the AAPT 3-year-weekly 75-degree upward channel:
Cheers,
Bob-C
Hi MMStockPlay et al., here is the RTGV 3-year-weekly chart:
The RTGV weeklyRTGV CMF, OBV, and Accum/Dist look excellent.
Here is the RTGV daily chart:
The RTGV daily RTGV CMF, OBV, and Accum/Dist look excellent.
Cheers,
Bob-C
Hi MMStockPlay et al., congratulations and good luck on your new site. I look forward to your stock picks and those of your colleagues.
Keep up your good work.
Best,
Bob-C
Hi TRADER34, thanks very much for your comments, analysis, and insights.
Good luck on your trades.
Have a great weekend.
Best,
Bob-C
You're very welcome Wisdom, good to hear from you.
Good luck on your trades.
Have a great weekend.
Best,
Bob-C
Thanks for your PM highstakes. Yes, my AAPT weekly chart does show that AAPT can fall more however, if AAPT maintains its weekly upward channel then the implications for AAPT's PPS are lookng very good. The daily and weekly AAPT Chaikin Money Flow (CMF), Accumulation/Distribution, On Balance Volume (OBV), and MACD are excellent and have continued to get better and stronger since March 2012. The charts tell the facts. Despite a 50% drop from the .079 high to under .04 on an intraday basis AAPT's CMF, OBV, Accum/Dist, and MACD have remained strong and growing indicating a powerful positive divergence in contrast to the lower AAPT price. :)
Regards,
Bob-C
Hi highstakes et al.,did you have the opportunity to see my AAPT chart here?
Best,
Bob-C
Hi everyone, the AAPT weekly chart looks great. Here is the AAPT weekly chart depicting a rising 75-degree channel:
Note, the Accum/Dist, MACD, and CMF are positive and increasing.
Good luck to all. Go AAPT Go!
Cheers,
Bob-C
You're very welcome 7kidsmom, thanks for sharing your insights and analysis. :)
Good luck on all of your investments.
Best,
Bob
Hi highstakes, thanks for all your excellent contributions and insights. :)
Here is the AAPT daily chart:
The 50 DMA has offered support since the rise started in the beginning of March.
Keep up your good work. GLTU.
Best,
Bob-C
You're very welcome Serael, good to hear from you. The charts are in addition to all the excellent AAPT fundamentals. :)
Here is the AAPT 4-year-weekly volume-by-price chart:
http://bigcharts.marketwatch.com/advchart/frames/frames.asp?show=&insttype=Stock&symb=AAPT&time=11&startdate=1%2F4%2F1999&enddate=5%2F23%2F2012&freq=2&compidx=aaaaa%3A0&comptemptext=&comp=none&ma=1&maval=10%2C20%2C50&uf=32&lf=8&lf2=512&lf3=4&type=4&style=330&size=4&timeFrameToggle=false&compareToToggle=false&indicatorsToggle=false&chartStyleToggle=false&state=11&x=68&y=17
Good luck on all of your trades.
Best,
Bob-C
Thanks very much suebh, good to hear from you. :)
Here is the MDHI volume-by-price chart which confirms your on-target insights and analysis. :
http://bigcharts.marketwatch.com/advchart/frames/frames.asp?show=&insttype=Stock&symb=mdhi&time=7&startdate=1%2F4%2F1999&enddate=5%2F23%2F2012&freq=1&compidx=aaaaa%3A0&comptemptext=&comp=none&ma=1&maval=10%2C20%2C50&uf=32&lf=32&lf2=16&lf3=268435456&type=4&style=330&size=4&timeFrameToggle=false&compareToToggle=false&indicatorsToggle=false&chartStyleToggle=false&state=11&x=41&y=16
Good luck on all of your trades.
Best,
Bob
Hi lucassharp2008, here are the daily and weekly AAPT Gallery Charts: (Please wait for the charts to load-thanks)
AAPT appears to be forming another bull-flag formation on its daily chart.
Here is the AAPT daily Ichimoku chart:
Here is the AAPT weekly ichimoku chart:
Cheers,
Bob-C
You're very welcome kat40zun, good to hear from you. :)
Good luck on all of your trades.
Best,
Bob-C
You're very welcome kat40zun, good to heara from you. :)
Good luck on all of your trades.
Best,
Bob-C
Hi lucassharp2008, good to hear from you, and a very happy and prosperous MHDI too you. Good luck on all of your trades. :)
Here are the daily and weekly MHDI Gallery Charts: (Please wait for the charts to load-thanks)
Here is the MDHI daily Ichimoku chart:
MHDI is on a daily SAR buy signal and has closed above its red Kumo (cloud.
Best,
Bob-C
Hi lucassharp2008, good to hear from you, and a very happy and prosperous M,H,D, and I too you. Good luck on all of your trades. :)
Best,
Bob-C
Thanks TRADER34 for yuor validation numbers DD and analysis. Keep up your good work.
Have a great weekend.
Best,
Bob-C
Hi MMStockPlay, see my chart here
Cheers,
Bob-C
You're very welcome TRADER34. Good luck on all of your trades.
Have a great day.
Bob-C
Hi TRADER34, here is the AAPT weekly chart with the 60-degree uptrend channel:

The chart is as of yesterday and doesn't update since it's in an onlne repository.
Best,
Bob-C
Thanks very much MMStockPlay. Keep up your superb analysis and excellent insights. Thanks again for all your hard work and DD.
All the best,
Bob-C
Hi MMStockPlay, the AAPT weekly chart continues to look very good and is rising in a 65-degree oblique channel via a series of bull-flag formations.
Cheers,
Bob-C
Sounds great highstakes. I hope everything is ok with your trading account. Good luck on your trades.
Here is the AAPT daly pivot-point and SAR chart:
Here is the AAPT weekly chart:
The AAPT daily and weekly CMF (Chaikin Money Flow), Accum/Dist, and OBV (On Balance volume)are strong, positive, and increasing. The daily and weekly SAR indicators are on buy signals.The AAPT charts look great!
I look forward with you and our colleagues to hear more good things from AAPT. :)
Regards,
Bob-C
Thanks a lot portermac. Have a great and happy tradng day.
Best,
Bob-C
Hi highstakes, what is the significance of AAPT's name change? Is AAPT still a pinksheet stock or on a higher level?
Cheers,
Bob-C
Thank you investor_dude. Good luck on all of your trades.
Best,
Bob-C
Hi everyone, look at the ask price, what do you see? Thanks in advance. :) Do you see above $1.00 on the ask price? Did the MMs take the price down because they knew something big is coming? IMHO, yes. :)
Cheers, :)
Bob-C

