 News
News  Market Data
  Discover
Support: 888-992-3836
Copyright © 2023 InvestorsHub Inc.


Programming
macprogrammer
![]()
Programming
Register for free to join our community of investors and share your ideas. You will also get access to streaming quotes, interactive charts, trades, portfolio, live options flow and more tools.
Register for free to join our community of investors and share your ideas. You will also get access to streaming quotes, interactive charts, trades, portfolio, live options flow and more tools.
Programming
>Well, that's because we use the Las Vegas model......
>Only discuss our winners!!!!
ROFL, I've been there (to the model not Las Vegas).
>I'm running Vista 64bit.
>Packing 6 GB RAM
>Powered by Intel Pentium Dual-Core E5200 @ 2.5Ghz each
That's tons of horse power.
Just curious, what monitor size are you running (in pixel resolution)?
The biggest resource hog of AIM II is not the power it needs but in the monitor size that it requires. Too much to display.
What about everyone else? What monitor size are you running in terms of pixel resolution.
I believe mine is 1920 x 1280 which is not the largest you can get but it seems to be a popular standard now days.
Ryan
>Re: Volatile Stocks...
Thank you, thank you, thank you. I'm a volatile stock junky so I appreciate this. Anyone else, I'm all ears.
Ryan
> My birthday
When is your birthday?
Ryan
>will I have the new software toy to play with soon?
Ooh, thanks for reminding me. I was going to mention that the core programming for AIM II is now done. I finished it yesterday. Woohoo, praise God.
I still need to do a hand full of bug fixes next week. There are still too many in there, even for a beta. Plus a manual and a small book to write. Both around 8 to 10 pages so not much. I have no idea how long those will take but even if I only have a few pages written I'm still launching the beta.
So I expect a week for fixes and a week for the writing. So 2 weeks from now.
BTW Firebird, are you on Mac or PC? There are some stubborn glitches in the PC version and I have to send out for advice to my developers group before I can fix them. So the PC version might have some unexpected flashing, jittering, wizzing, popping, kind of things in it. Just ignore them for now.
Ryan
>these videos [Dent and Schiff] are more truth than fiction right now.
Just a personal note. I have a relative, a baby boomer, that is cashing in all her retirement money this summer. She is 67 and is ready to begin enjoying her money.
The annuity salesman that handles her money stated what a bad day he was having because so many retirees are cashing out right now.
So when you have a lot more sellers than buyers of stock and other investments it creates a big wave. And when there is a momentary break in the selling (like say 6 months worth) the market recovers and everyone in the media is commenting, 'The market is going up right now and we can't figure out why'.
If you combine this wave with earnings, GDP, interest rates, etc. then you get the composite picture. But demographic selling and buying is the biggest component.
Ryan
Well done.
CREE is an awesome stock. I added it to my watch list.
I'm curious. What other volatile stocks do you guys watch and or invest? You all seem to be really good at picking the right stocks.
Ryan
>how to get perfect reception
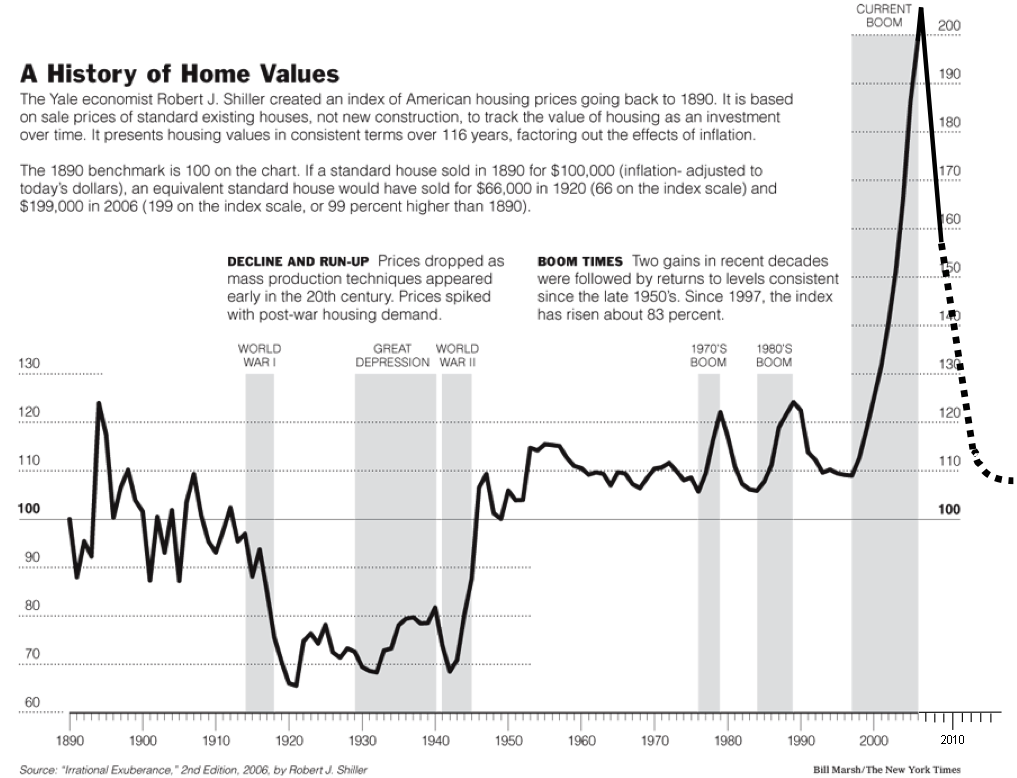
Seems like the mega trend sector that brings a bull market up is the first to crash (see housing chart).
I think the same was true for the auto industry in 1929.
I wonder if software could be developed to quantify this
and give a 6 month advance notice of the next major bear market.
Ryan
> not a very pretty picture is it?
I've heard several other forecasters, in addition to Dent and Schiff, say similar things. The market is headed down further later on this year.
Fortunately I have a system that takes advantage of that. As soon as I can put it into words I'll share it with everyone.
Ryan
>Dent on Cavuto yesterday,
Here are the updates from his website. He doesn't say much other than what you see on the fox video.
http://www.hsdent.com/bookupdates/
Ryan
>The concept involves splitting the Portfolio Control into three entities: 1) the Core Portfolio Control, 2) the Buy Portfolio Control, and 3) the Sell Portfolio Control.
I makes me think there should be one master algorithm tuned to very large market moves, like those on a 3 to 5 year basis which then sends a co-efficient to the regular AIM algorithm.
How to do this is a much more difficult question to answer. Because you'll always run into the same problem. When the bear market kicks in, how will either algorithm know in order to keep AIM from buying what it thinks are cheap shares, only to discover the market is headed much lower.
Ryan
>run off a cliff.
I find too that the higher frequency trading generates more cash so you have a fatter cushion when falling off that cliff.
But then if you fall off the cliff right away it doesn't matter in either scenario. So might as well increase the number of trades (to a point).
Ryan
Re: Zig Zag
Wow, I never even thought about using Zig Zag with AIM. DOH!!
That works awesome. Who came up with that one?
Ryan
You're welcome. I find it strange that this URL works on some computers and not others.
Oh well, can't beat the price.
Ryan
Darn it, I missed my software deadline. Well at least I'm getting close.
Ryan
>Link
Just curious, copy and paste (and save) this link in your browser. It should give you a GIANT 5 year graph. I find it useful for AIM trading. Just replace the word '$DJUSFI' with your favorite ticker symbol. Let me know if it works. If it doesn't then I know the URL has some kind of tag related to my computer (a cookie perhaps).
http://www.stockcharts.com/def/servlet/SharpChartv05.ServletDriver?chart=$DJUSFI,wahayiay[df][pc30!f][ib14!la12,26,9]&r=6133
Ryan
>Have you ever thought about AIM'ing your AIM IRA Steve? :)
HAHAHAHA, that's funny. I know exactly what you are talking about. It's a concept a hope to experiment with some day.
Ryan
Yep, that's correct. Sorry for the definition mixup. I use the word margin and leverage interchangeably sometimes when I shouldn't. Your definition is technically correct.
I wish I had time to play with this concept but I'm too busy right now.
I hope to have time this summer though.
Ryan
Is that the same company as this,
http://www.stockcharts.com/def/servlet/SharpChartv05.ServletDriver?chart=VALU,wahayiay[df][pc30!f][ib14!la12,26,9]&r=6133
If so, I can make use of that. It has stable volatility (how's that for an oxymoron?)
Thanks for the tip.
Ryan
I think OANDA provides forex to anyone with no margin required and you can trade as little as $1 dollar. The trade off is that you can only go as high as 50 to 1 margin which is a little small for forex.
Ryan
I am intrigued by that as well.
A forum link to read,
http://www.forexfactory.com/showthread.php?t=2429
Ryan
I agree with this. Dent covers this in his book.
Housing prices nation wide are set to fall another fifty percent.
Combined with another demographic down turn in the market in 2010, this little government propped bear market rally were in right now won't last.
Take a look at the free Google Groups service. It has a file upload area plus other services like email listserve. It's pretty nice.
They also offer a free generic web page hosting service with file space and other tools. I think it's called Google Sites. Works really well.
Ryan
>Dent could not have predicted this potential factor as well
I don't think Dent can predict the smaller market shifts but he has predicted the large ones.
Here's his track record:
In 1989, when Japan was enjoying their largest bull market in history, Dent predicted a long massive bear market for Japan, which did indeed happen from 1990 to 2002. (Our Power to Predict - 1989).
In 1993, Dent predicted the US market would enter a period of an almost decade long bull market that would rival 1929 and lead the Dow to reach 10,000. We all the know the outcome of that one. (The Great Boom Ahead - 1993).
In 1998, he stated, 'I recommend investing heavily on any substantial corrections in 1998.' People were frantic in the 1998 down market and thought the bull was over. (The Roaring 2000s - 1998).
In 2001, he didn't say much about the crash of 2000 - 2002, so I do fault him for that. But that market was not a part of the larger tide. It occurred because of overvaluation and administration change. Which is why the market came back so strongly in 2003. We were still in a larger bull market.
In 2002, his newsletter stated that late 2002 was the bottom and the next major move up was about to happen. I profited greatly in 2003 and 2004 because of this.
In 2004, he stated that 2002 - 2009 would be a major long term bull market but he got the magnitude wrong. (The Next Great Bubble Boom - 2004).
In 2004, he also stated that real estate would see a 'minor' decline in 2005 signaling a slow down. He got magnitude wrong on that one as well. But it was enough to convince me that I needed to get my house fixed up and ready to sell. (The Next Great Bubble Boom - 2004).
In 2009, he stated in his newest book that 2009 would see a bear market rally which will end in the beginning of 2010 when another drop will occur bringing the Dow even lower. And indeed that is happening right now. (The Great Depression Ahead - January 2009).
You'll notice that some of his predictions are a year off. But he is making these predictions based on demographic data that is projected 52 years into the future. So it's bound to be off by a little.
Ryan
>beyond just demographics
I look at demographics as the large tide and things like subprime, GDP, price of oil, interest rates and other fed actions, laws, etc. as being the wave that tries to pull down the tide. Government can only reduce prosperity, it can not create it.
>I don't see a lot of policies that lead to any economic growth
Well said, although I would have said 'allow economic growth' but I know what you mean.
>Does this mean your software will be limited to Mac's
It'll be available for Windows and Linux as well.
I have a compiler for all three platforms. I occasionally check the executables and they look almost identical on all three.
So Windows and Linux users should have parity with the Mac version.
I am hoping this is the last week for internal updates. Then next week I write the manual and a small book that I plan to include titled, 'How to Make $1 Billion in the Stock Market Automatically'.
My goal was to have it all ready by May 1 but I think I'll miss that deadline by a week. So hopefully you'll have access to the beta version by May 18.
Ryan
I think I get the gist of your question but I'm not sure.
>Lichello series
If by Lichello series you mean the model he uses where stock prices go 10,8,5,4,5,8,10, then the answer is yes. I optimized using the Lichello Series. But the amazing thing is that the new algorithm is safer.
>model that works well with all indexes and/or stocks?
Actually the AIM II model by itself works amazingly well with any stock. I wouldn't use it with indexes. I'll be offering two other pieces of software for that, which will come bundled with the AIM II program. As for how well it works, it depends on the stock. With a mild stock you'll get at least twice the profit of AIM or any AIM variations. In some cases with a volatile stock you get 20 times the profit. Also, with AIM II, volatile stocks cause the portfolio to compound geometrically.
The software will have the ability to choose what I call Lichello Mode which mimics AIM. And it'll have an AIM II mode and a 'User Defined' mode which will allow you to test an infinite number of models if you wish. Also I just recently added a finer level of control. I did that because I think both the power user/tinkerer and the beginner will have different goals in mind. Not to mention I will be using the software myself and I'm the world's biggest tinkerer.
Demographic projections of magnitude are never accurate as I stated in an earlier post.
But the market turning points have been 100 percent accurate.
It's was a very satisfying feeling in late 2007 when I cashed out of the stock market because I had read about the coming collapse 5 years prior to that date. In addition, I also sold my house near the peak of the real estate boom.
One other thing I should mention. Since these projections are made many years, sometimes decades in advance, it's advantageous to visit his web site every few months to download free update reports. They sort of fine tune the pivot date.
Ryan
It uses a combination of things. I tested it for safety and it's even safer than Lichello's formula by a wide margin.
So you are on the right track.
Also, it's now $2,175,584.00 after 4 cycles.
Ryan
Actually he predicted that the Dow was going to hit 40,000.
That is why I stated, in an earlier post, that demographic projections of market turns have been 100 percent correct but magnitude has not.
The reason the market turning dates are always correct because demographics are the very thing the moves the market. So they have to be.
Magnitude is never correct because there are too many variables that change the picture. In the case of the 40,000 Dow prediction, the price of oil rose so high that it killed the market. If you look at the earnings projections, they were astronomical in 2003 - 2007. If not for oil, the Dow would have easily hit 40,000 and then some.
So whenever I read Dent books, I pay close attention to whatever time period he states as a market turning or pivot point. But I disregard any comments about how high or low the market is going to go.
Ryan
>hold a index short position
I agree. When you have a straight down crash like 2008, holding a short position as a hedge certainly wouldn't hurt.
Ryan
Well done!!
Ryan
>but gee the tone has gotten decidedly darker of late around here!
Ooops, sorry, I don't want to be negative. Just trying to portray the market as accurately as possible. It's good to have an understanding of the demographics that drive markets. It allows us to test scenarios against the AIM method.
I do believe that AIM users are going to come out a lot better in this kind of market than those who use traditional buy and hold techniques. Because we take profits along the way.
Not to mention that Lichello designed AIM for this kind of market.
Ryan
Imagine everyone's shock when the market drops even further in 2010.
An excerpt from the book, 'The Great Depression Ahead' by Harry Dent.
The worst decline will come from late 2009 or 2010 onward, when the longer-term baby-boom spending cycle finally collapses. (page 13)
The main course will be ushered in by an equally brutal crash that is most likely to occur between mid- to late 2009 and late 2010 and take the Dow to as low as 3,800, the 1994 low where the stock bubble first began. (page 18)
I was thinking more like just a simple area graph. Each week or month I would run the program and it would draw in the latest symbols and data. The sum value of all stocks would be divided by the total number of symbols. Any IPOs would be added as usual. But any delisted symbols would actually be kept and their price set to zero. Delisted symbols would be kept for ever and ever thereby continually diluting the value. That way we can see over time whether the new IPOs are able to bring up the market more than the bankruptcies bring it down. It would be an excellent indicator of the health of the economy as well.
Ryan
One of the things I've always wanted to do is create a chart of what the stock market actually looks like so the public can see it.
I've got a copy of Amibroker which has a nice custom index creation feature. But it would mean I would have to pull a copy of the symbol list from BATS or EOD Data once a month and be very diligent about it (for the rest of my life).
If I can automate the process to some extent I think I'll try it and post it to a web site.
Ryan
>I never thought of it that way. Another reason to AIM indexes rather than individual stocks.
Very wise. I also have a way to actually capitalize on this phenomenon which I'll introduce in a few weeks (when I'm not so exhausted from programming).
>I look forward to your merger = bankruptcy explanation...
Although there are some exceptions like founders wanting to retire, etc., most companies seek a suitor when they are faced with an absolute crisis with their balance sheet. There are two popular routes for dealing with a downward spiral. A company will try to auction convertible debentures or some other kind of debt instrument, or, they seek to sell themselves. Would they admit to a impending financial melt down? Never. Because it lowers the potential price of the company. To put this in perspective, ask yourself this. When is the last time you heard a CEO step up to the microphone and say, 'We are having record sales, record earnings and greater cash flow than we know what to do with, so I think we'll sell the company.'
Anyway, without being to overdramatic like I tend to be sometimes, the point I was trying to make is that out of 7,000 stocks on the market today, the majority are going to go down in price over a 10 year period. And if you were to graph that, this is what it would look like. Picture setting 10 charts of Vonage side by side pressed together. Every quarter a new round of IPOs line up for the blood bath with only 35 percent of them going up in price and the rest go down until they dissolve. Every quarter the market starts out on a high note and down it goes only to be recharged by the next round of sacrificial lambs.
http://stockcharts.com/c-sc/sc?s=VG&p=W&yr=3&mn=0&dy=0&i=p09125930937&r=9105
BTW, you guys are too smart for me. I think I'm going to stop asking rhetorical questions. It looks like most of you already strongly diversify or use ETFs.
Ryan
I have a question for you veterans?
At any given time, if you were to make a watch list of the entire stock market (referring to the approximately 7000 stocks that make up the NYSE, NASDAQ and AMEX) and graph it over a 10 year period as if it were an index, what would that graph look like?
Would it go up over time or down?
I already have the answer because I analyzed this during the most recent bull market. The answer will absolutely shock you. There is an enormous misconception about the stock market that is held by 99 percent of the public.
The misconception is that stocks go up over time. But it's actually the opposite.
But wait a minute, what about total market indexes like the Wilshire 5000. I've seen graphs and they go up over time.
Here's the paradox. There are no indexes that track all stocks. They only track surviving stocks. Each year a certain number go bankrupt or merge (a merger is a bankruptcy by the way, I'll explain later). Which means over time ALL companies go bankrupt. It's the reason you can only find one original remaining company in the DJIA. And only a handful have survived the last hundred years.
If you try to go back in history to see how an average company performed, say 30 years ago, you can't. Because it's data is no longer available. They've gone bankrupt. The only data you have access to is the huge market share grabbing companies that have survived. And rest assured they too will go bankrupt.
So look at your portfolio and ask, 'How long before the companies that I hold go bankrupt'. Because it's not a matter of if but when.
Oops. Looks like that link times out.
Well anyway, go to USPTO, and do a search for equity plus and you should see it.
Ryan
Hey, you guys want to see something interesting?
I am considering naming my software 'Lichello' in honor of Robert Lichello and so I did a trademark search.
Well, there are no trademarks (or products for that matter) that I am aware of or able to find named Lichello.
However, I did find this entry called EQUITY PLUS which appeared to have been filed by Lichello himself. I did not see an attorney of record.
It seems to be some kind of mutual fund plan that he started.
Here's the link,
http://tess2.uspto.gov/bin/showfield?f=doc&state=4003:9daia2.2.1
It's kind of neat to find a trail left by him.
Ryan

