 News
News  Market Data
  Discover
Support: 888-992-3836
Copyright © 2023 InvestorsHub Inc.


Gizmo
![]()
Register for free to join our community of investors and share your ideas. You will also get access to streaming quotes, interactive charts, trades, portfolio, live options flow and more tools.
Register for free to join our community of investors and share your ideas. You will also get access to streaming quotes, interactive charts, trades, portfolio, live options flow and more tools.
Dow RSI5 87.37 hod so far.
Rut powered up through the upper BB and is overbought. Needs a correction and probably worse. Maybe it sets a rounded top going in to end of quarter.
The top here could coincide with end of quarter buying. Fundamentals are gasping for air but the market is being supported by low interest rates and low inflation.
Do you see a higher high later in the year?
Why would he care about the ST or IT health of the Naz? Let market forces prevail w/o intervention. His legacy is already synonymous with "bubble", and "asset inflation".
If it does 4.00% should hold, but I'm inclined to believe it's too early for a pullback. Longs see that key reversal and a multi week rally should be in the offing.
Close up view of bullflag forming. Hit the bottom of the channel again Fri. so maybe we test the upper TL Mon.

Ndx Weekly

Re the Weekly. One more?
Needs to get out of this hole next week.
Welles...
I want to get the sense of what it is to be a real asshole
Some people say I'm already there. LOL
Blow it off?... Because it really doesn't matter.
I'll load the boat. 50% loaded from this am 1522.
Makes me think Ndx shakeout before next leg up.
Big divergance between Rut/Ndx performance makes me think this is just a tech shakeout.
I did some buying too. Re bonds...looking for TNX to fill some of those gap downs it left, but I don't think that will effect stocks as short term bond traders overdid it on the upside.
Here at AM pricing 1522 NDX would be a decent entry IMO. Could be the retest before 5 up.
Bonds higher, that may have indeed been a key reversal last Fri.
Money markets high liquidity and 3%. 10 year bond low liquidity sub 4%.
I don't understand the demand fundamental for bonds. Are people really willing to take the risk the bonds tank for chump change?
Made some money off that low but the problem I have is the dollar has broken out higher and is unlikely to reverse immediately. $USD should go into the 90's resistance and that could take gold to sub 400.
The markets not "acting right" this year, LOL. Supposed to be a 1st quarter high and a yearly low Sep/Oct, then the 4th quarter rally.
Thanks for the input and I tend to agree from a contrarian perspective. Still plenty of disbelief and shorts to unwind.
Not really. Recent action looks like that may be true but going back further they seem to run together.
Carl Swenlin interview with Ike Iossif. He thinks this is the final rally before the bear market reasserts it's self. I tend to agree but am not sure if the 4 your cycle high is in or yet to come. I'm looking for the 4 year cycle low around 10/06.
http://www.decisionpoint.com/interviews/InterviewMenu.html
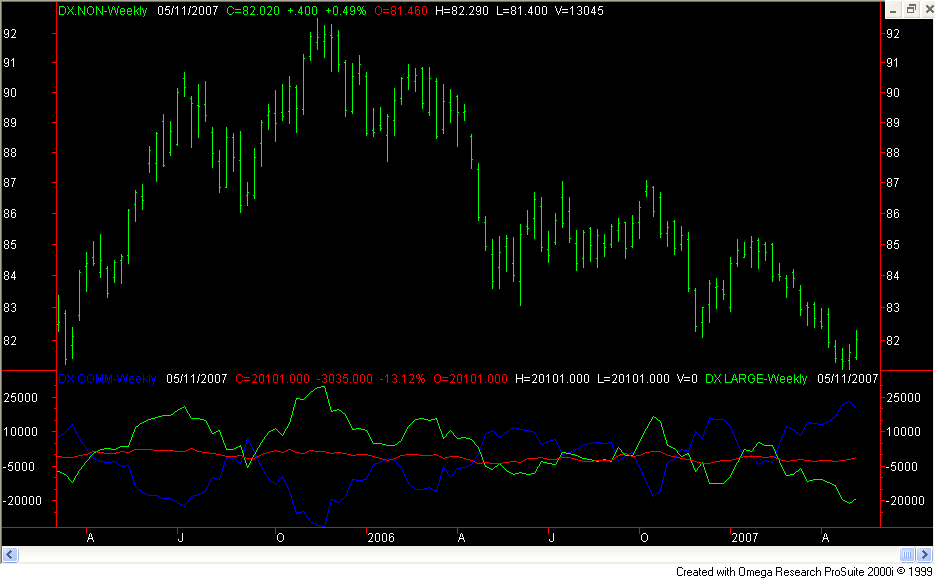
Cot chart of the dollar shows commercials getting ever shorter in the face of the bucks rally. These guys are sometimes early but rarely wrong. Note they were very long at the bottom in Nov/Dec. IMO sticking with the commercial traders by avg. in is a decent strategy.
I'm not leaving the thread...just not posting the trades. I enjoy adding my 2 cents and have not recieved criticism for doing so. None are expert so we can take what we can use and leave the rest behind.
PAUL CHERNEY’S MARKET FOCUS
By Paul Cherney
More Downside Would Be Natural
But momentum measures tilt the odds toward a rebound in prices
From Cherney Market Analysis
I think it would be natural to have a little more downside at the beginning of next week, but the measures of price momentum and volume momentum (up volume versus down volume) achieved over the last 2 to 3 weeks keep my expectations tilted to favor that the short-term profit-taking will find a floor and then prices will rebound.
Historically, when the Nasdaq is outperforming the S&P 500, both indexes benefit, and that is the case right now, but I think we have entered a window of time when short-term profit-taking in the Nasdaq creates a condition of relative out-performance by the S&P 500, that could be the case over the next couple of trade days. Relative strength/relative out-performance does not necessarily mean that the S&P 500 will gain more on a percentage basis relative to the Nasdaq, relative strength/relative out-performance can simply mean that the S&P 500 does not decline as much as the Nasdaq, which was the case on Friday.
The price and volume action of the past few weeks has exhibited positive readings for price and volume that usually mean there is an underlying willingness to buy. The first retracement should attract buying interest for a rebound. I do start to become concerned about being wrong about the willingness to buy short-term dips in price when or if the Nasdaq posts a close that represents a loss of 2.5% from its highest close. For the current market, that would be equivalent to a Nasdaq close under 2,045, but I have to add that markets are not obliged to comply with my expectations for performance, I also like to employ observations of chart support and in my view of the Nasdaq, the key chart support is 2,042-2,027. So, even if there is a close under Nasdaq 2,045, the key chart support for the Nasdaq is 2,042-2,027 and this is the area that is most likely to attract buyers (if prices were to move that low).
Immediate intraday support for the Nasdaq is currently being tested; that support is 2,076.80-2,067.23. If the index spends more than 4 minutes below 2,067.23 without attracting buyers to push prices higher, I think that would increase the chances for additional short-term downside and a test of a shelf of support at 2,057-2,050.
The S&P 500 has numerous layers of support and it is usually difficult for markets to just slice through layers of support like this.
Immediate intraday support for the S&P 500 is 1,197.39-1,191.03; there is a layer of support that overlaps at 1,194-1,185.19, which makes the 1,194-1,191.03 area a focus of intraday support.
There would be some concern for a short-term shake-out if the S&P 500 spent more than 4 minutes below the 1,185.19 level, but supports are stair-stepped and stacked, offering numerous price levels to entice buying participation. The support of 1,194-1,185.19 is overlapped at 1,187-1,180.87 which creates another focus of support 1,187-1,185.19. A move below 1,180.87 would not be healthy, and could ignite some fear-driven selling, the next layer of substantial support, though, is directly underneath 1,180.87 at 1,178.87-1,165.
I still expect that sometime over the next 19 trading days, there should be an S&P 500 close at or above the 1,215.00 level and a Nasdaq close at or above 2,119. Every day the markets deliver new information that either confirms or contradicts assumptions in place: so far, I have not seen anything to cause me to second guess this assumption.
Disclaimer: Use of the information provided by Cherney Market Analysis, Inc., is subject to the Terms of Use contained on its website, paulcherney.com.
http://www.businessweek.com/investor/content/jun2005/pi2005063_8401_pi081.htm
Mr. Market can be wrong but Ms. Market is never wrong.
LOL. Keep the peace.
Namiar, I'm discontinuing the practice of posting my trades. I trade often and it's too much effort to get them up in a timely manner.
Is this following the Japanese model of 1% JGB's, deflation, RE collapse and secular bear market?
I can't help but wonder.
Xau novice e-wave count.
I believe that this is a wave 4 correction that will terminate at or below the upper TL, and that the 5th wave down will take the Xau to new lows.

I use Rydex so it would be RYGBX if your bullish on bonds or RYJUX if bearish. The big trend has been ultra bullish but I think we're due for a retacement here.
On the RE market. Parabolics do correct...even though I detect much denial of this possibility. It looks like the last correction was a 15 year consolidation.

$USB.

Economic Commentary - Dave's Top Ten
Merrill Lynch
3 June 2005
This research product summarizes the 10 major macro themes of the past week as a
prelude to our weekly publication the Market Economist.
1. Fodder for the bond bulls and Fed policy doves: About the only risk we see in the
Treasury market is more short-term and technical in nature – overbought, and the
speculators have done much more than close their short positions (non-commercial
accounts now net long in the 10-year note to the tune of over 95,000 contracts, which in
the past marked an interim yield trough). Note that at the last three forays to or below
4% (February/05, October/04, and June/03) on the 10-year note, the net spec position
got as long as 94,494, 95,619, and 109,494 respectively. However, the macro landscape
is still very much bond-friendly. Note that Ford announced that it is going to cut Q3
output by 19% from Q2, in what will be the lowest production level since the end of
2001. GM intends to cut its assemblies by 12% quarter-over-quarter. Ford’s sales were
down 12% year-over-year, and GM down 11%. Even red-hot Toyota was off 2.4%. As
for all the inflation-phobes out there who believe that speculative runups in home prices
deserve to be in the CPI, look what’s happening in the auto sector – GM has embarked
on a “discounts for everyone” program, where rebates on 2005 models generally
reserved for employees will now be made universal. Paul Ballew, the company’s chief
sales analyst, stated that “our pricing is going to be more aggressive in June than it was
in May.”
2. No one can understand why bonds are rallying: Guide them away from the year-onyear
CPI data (yesterday’s story) to the pending pension crisis (tomorrow’s story). See
“Warning Over U.S. State Pension Funds Shortfall” in Tuesday’s FT. The PBGC last
Friday announced huge losses and said it may end up needing a taxpayer bailout as more
companies are expected to pull a UAL and walk away from their pension obligations.
The really grim stuff is that by many accounts, the underfunded liability in state pension
funds is even more acute. The article uses New Jersey as an example where the shortfall
under a conservative set assumptions is north of $30 billion. All this smacks of an S&Ltype
crisis, which, if we remember correctly, represented a period of ever-declining bond
yields even as commodities were filtering through to the PPI and CPI. Let the
economists get consumed over those lagging indicators as investors focus on what’s
happening in the real world that is driving bond prices higher.
3. ISM Edges Closer To 50-Mark: Following in the footsteps of the European
PMIs, the ISM manufacturing index came in weaker than expected and
displayed weakness virtually across the board, confirming that the
manufacturing sector is struggling to keep its head above water. The headline
index dropped to 51.4 in May, the lowest reading since June 2003. Both
manufacturing and customer inventories remained below the 50 mark. For the
first time since October 2003, the employment index moved below 50, dropping
3.5 points to 48.8 in May, which is consistent with our view that the pace of job
cuts in manufacturing intensified in May. It is also consistent with our below
consensus 150k forecast for total nonfarm payrolls due out this Friday. Other
details of the report suggest that the pace of manufacturing activity has shrunk
to 2003 levels. Notably, the production index slipped to 54.9 from 56.7 – the
lowest since June 2003. The forward looking subcomponents such as new
orders and new export orders also posted notable declines, an indication that
production activity will remain slow in the near term.
4. Back on February 3rd of this year, we published a report titled “Why The Bond
Market Has Optim-ISM”, which showed how ISM cycles are inextricably
linked to bond market cycles. It is not complicated-market rates are highly
cyclical and so is ISM. Look at the “nominal ISM” (prices paid multiplied by
the headline index) against the 12-month change in the 10-year note yield.
This has nothing to do with whether the yield is “too high or too low” and
whether it’s “over or undervalued.” And it certainly has nothing to do with
foreign central bank activity. It’s about the business cycle. If you’re
fundamentally bearish on the direction of the 10-year Treasury note yield,
have a view that we are either going to see the ISM index, prices-paid, or both
to embark on an upward path (as it did from mid-’03 to early ‘04 when we
had that vicious bond sell-off). Meanwhile, the ratio of orders to inventories
suggests that the ISM has yet to make a bottom ... so it would stand to reason
that 10-year yields haven’t either.
5. Chinese Revaluation – Not a “Fair Trade” from an Employment Standpoint:
The grim reality is that a yuan revaluation would likely not add one solitary job
over here in the USA (Pakistan, Thailand and Bangladesh, perhaps) but it
could end up costing jobs, in our view. Consider for a moment that the U.S.
employs just over 1.5 million people in the sectors where we import the most
from China – toys/appliances/electronics/apparel. And let’s not forget,
U.S./China wage differentials being what they are, the trend towards
outsourcing to China is not going to go away. At the same time, there are
nearly nine million employed in construction and real estate – “only” six times
larger than the sectors that have lost market share to China (and if it was not
China, it would be some other low-cost foreign locale). When it comes to
what a revaluation would mean for the overall U.S. job market, the math is
pretty daunting. For every one-percent loss of employment in the construction
and real estate sector due to the prospect of higher interest rates (though a
sustained run-up in rates is not our base-case view, the risks cannot be totally
dismissed), we would have to basically create 12% more jobs in the
apparel/textile industry just as an offset (the income trade-off is even larger).
Now from our lens, that hardly looks like a fair trade – for the economy.
6. Cracks in the Housing Boom’s Foundation Beginning to Surface: We have
said for some time that where we would start to see signs of the bubble
bursting would be via the press (like we saw with Orange County in Barron’s
circa Dec/94 and LTCM in the WSJ in Aug/98). Now a sobering article in
Wednesday’s Washington Post titled “U.S. Foreclosure Surge Taints Housing
Boom”. The article centers on Philadelphia ... the city and its suburbs, and
indeed much of Pennsylvania have experienced a foreclosure epidemic as
low-income homeowners take on mortgage debt they can’t afford. According
to the article, foreclosed properties are now running in excess of 1,000 per
month – tripling from five years ago. In fact, according to Foreclosure.com
(an online foreclosure-listing service), foreclosure rates rose in 47 states in
March. With nearly one in ten Americans spending more than half their
income on monthly mortgage payments, and over 60% of new mortgage
originations in ARMS and interest-only loans, the acting U.S. Comptroller of
the Currency (Julie Williams) said “we are clearly seeing a spike in
foreclosures in a number of our major urban areas .... we’ve produced a new
class of lenders willing to take on riskier and riskier borrowers at a very high
price. Many of the products are nothing more than time bombs”. This is why
it is a mistake to lay this at the Fed’s door and why a bear market in
Treasuries would be disastrous...in our view, it’s a problem of widespread lax
lending standards (it’s no coincidence that 70% of the foreclosures are among
households who were lured into the market by “subprime” mortgage brokers).
7. A look at inflation from 30,000 feet in the air (where I have been spending a
considerable amount of time in the past two weeks): What will make this
inflation cycle less of a long-lasting threat than what we saw in decades past
is the lack of labor bargaining power. In 1980, 22% of the workforce was
unionized versus 12% today. The telecom sector is a great case in point – in
the mid-1980s, the union membership was 625,000 strong compared with
275,000 today. Mergers, deregulation and technological change has sharply
compressed wage and price pressures. A Cornell University study found that
a technician in the unionized Bell company earns $46,500 a year while a nonunion
worker at a cable company earns $35,700.
8. Jump in unit labor costs not at all worrisome, in our view: For several
reasons we do not believe that the jump in unit labor costs poses a significant
inflationary threat. We highlight three reasons: 1) The bulk of the increase in
unit labor costs was in the fourth quarter, so it is a backward look at what
costs and prices have been doing, which provides no information about what
is going to happen going forward. Given the downside risks to economic
growth as the Fed keeps pressing on the monetary policy brakes, we think the
trend will be towards softer, not stronger, compensation growth. 2) Since
profits surged by more than 65% in the fourth quarter and by 20% in the first
quarter, margins remain high by historical norms. 3) We believe that the
surge in compensation likely stemmed from one-time payouts to employees,
such as year-end bonuses, which only increase the level of labor costs but are
not inherently inflationary. In all, we continue to believe that inflation will
start to trend lower later in 2005.
9. Both France and the Netherlands rejected the EU constitution. Although
market reaction to the results was relatively subdued – it was widely expected
and was priced-in – the political repercussions and its effects on the euro are
huge. In France, with such a decisive vote on the issue it will be very hard to
call for a second vote. In addition, the “non” vote also meant a “non”
confidence vote on the current government and the leadership of President
Chirac. Indeed, PM Raffarin handed his resignation papers to Chirac (as
expected), and in turn he quickly appointed Interior Minister De Villepin to
the post of PM – his socialist leanings are not expected to benefit reform or
market focus developments.
10. Australian house price index rose 0.2% q/q in Q1, which brought the yearover-
year trend to 0.4% – a huge slowdown from the 19% y/y growth rate in
the fourth quarter of 2003. Among the 8 major cities, house prices in Sydney
were flat, while prices in Melbourne fell 1.6% q/q, and Darwin saw the
biggest increase of +3.8% q/q. This situation looks very similar to the U.K.’s
housing market and we believe that the U.S. will follow in their footsteps
sooner or later. Imagine, all the RBA and the BoE had to do was to raise rates
125 bps to effectively cool down the housing market; the Fed has raised rates
by 225 bps and the housing market still continues to be red-hot. The day of
reckoning may be coming. The year-on-year pace of real estate loans is
slowing, going from a cycle peak of 17.8% in May of 2003 to just over 11%
currently, refis are down 78% from its peak and purchases of new mortgages
have now cooled off, down 12% from their peak. In addition, our proprietary
housing index is now down for the 11th straight week, which suggests that the
housing market is poised to slow.
http://www.siliconinvestor.com/readmsg.aspx?msgid=21384760
Took a small profit on NDX short and switched it over to Dow Short 140/200. Looking for a bit of follow through.
Up 3.05% YTD. I guess I shouldn't kick myself as it's above all the major averages.
Looks like a key reversal in bond land, they sold off on data that should have taken the yield lower.
Added a 15% short position but believe I'm being to skeptical of the reversal.

Feel like offering up a map for the back half of the year?
I just wonder how long prices can rise faster than incomes. Same thing with the growth in healthcare costs.
Creative financing seems to be bridging the gap for now.
Nope. Not untill the dollar's finished rising and that won't be till when the Fed's done.
I do think the Xau will make 90-91 though, and maybe 95-96 which is about where the main downtrend line comes in at.
Took off remaining gold trade. I'd buy the dip if it can get to 82-83 this week.
No inground pool but I've got thingy's and gizmo's all around the house.
J.P. Morgan/Bank One tried their hardest to get me to buy their mutual funds a few short months ago.
Apparently, all they care about is assets under management, and the fees they collect from that. LOL
0% Earnings growth.
J.P. Morgan staying away from U.S. equities By Padraic Cassidy
NEW YORK (MarketWatch) - J.P. Morgan analysts on Friday reiterated an underweight rating on global and U.S. stocks, saying a deteriorating earnings environment has the potential to reverse the trend of higher-than-expected U.S. earnings in the last eight quarters. Analysts forecast 0% earnings growth next year for the S&P 500, while consensus expectations call for 10.5% EPS growth, J.P. Morgan said. Put another way, analysts said, if earnings growth rises at close to trend, about 6%, "based on current consensus forecasts this would see numbers miss by an average of 75 cents a quarter over the coming year. We doubt the market is prepared for this or would easily absorb these disappointments over consecutive quarters." The brokerage rates Eurozone and Japan at overweight.
http://www.marketwatch.com/news/newsfinder/pulseone.asp?dist=¶m=archive&siteid=mktw&...


