 News
News  Market Data
  Discover
Support: 888-992-3836
Copyright © 2023 InvestorsHub Inc.


dindindon
![]()
Register for free to join our community of investors and share your ideas. You will also get access to streaming quotes, interactive charts, trades, portfolio, live options flow and more tools.
Register for free to join our community of investors and share your ideas. You will also get access to streaming quotes, interactive charts, trades, portfolio, live options flow and more tools.
12/17/14 SPX level to enter long
intraday high 2012.47 in progress
imho:
- the safer point to enter long is 2013.20.(0.382 1972.24-2079.47)
- prefer higher than 2016.89 in this chart .
- looks unsettling at this moment.

Federal Reserve Board and FOMC economic projections
For release at 2:00 p.m. EST
http://www.federalreserve.gov/newsevents/press/monetary/20141217b.htm
The attached table and charts released on Wednesday summarize the economic projections and the target federal funds rate projections made by Federal Reserve Board members and Federal Reserve Bank presidents for the December 16-17 meeting of the Federal Open Market Committee.
The table will be incorporated into a summary of economic projections released with the minutes of the December 16-17 meeting. Summaries of economic projections are released quarterly.
Projections (PDF)
http://www.federalreserve.gov/monetarypolicy/files/fomcprojtabl20141217.pdf
Federal Open Market Committee Press Release
Release Date: December 17, 2014
For immediate release
http://www.federalreserve.gov/newsevents/press/monetary/20141217a.htm
Information received since the Federal Open Market Committee met in October suggests that economic activity is expanding at a moderate pace. Labor market conditions improved further, with solid job gains and a lower unemployment rate. On balance, a range of labor market indicators suggests that underutilization of labor resources continues to diminish. Household spending is rising moderately and business fixed investment is advancing, while the recovery in the housing sector remains slow. Inflation has continued to run below the Committee's longer-run objective, partly reflecting declines in energy prices. Market-based measures of inflation compensation have declined somewhat further; survey-based measures of longer-term inflation expectations have remained stable.
Consistent with its statutory mandate, the Committee seeks to foster maximum employment and price stability. The Committee expects that, with appropriate policy accommodation, economic activity will expand at a moderate pace, with labor market indicators moving toward levels the Committee judges consistent with its dual mandate. The Committee sees the risks to the outlook for economic activity and the labor market as nearly balanced. The Committee expects inflation to rise gradually toward 2 percent as the labor market improves further and the transitory effects of lower energy prices and other factors dissipate. The Committee continues to monitor inflation developments closely.
To support continued progress toward maximum employment and price stability, the Committee today reaffirmed its view that the current 0 to 1/4 percent target range for the federal funds rate remains appropriate. In determining how long to maintain this target range, the Committee will assess progress--both realized and expected--toward its objectives of maximum employment and 2 percent inflation. This assessment will take into account a wide range of information, including measures of labor market conditions, indicators of inflation pressures and inflation expectations, and readings on financial developments. Based on its current assessment, the Committee judges that it can be patient in beginning to normalize the stance of monetary policy. The Committee sees this guidance as consistent with its previous statement that it likely will be appropriate to maintain the 0 to 1/4 percent target range for the federal funds rate for a considerable time following the end of its asset purchase program in October, especially if projected inflation continues to run below the Committee's 2 percent longer-run goal, and provided that longer-term inflation expectations remain well anchored. However, if incoming information indicates faster progress toward the Committee's employment and inflation objectives than the Committee now expects, then increases in the target range for the federal funds rate are likely to occur sooner than currently anticipated. Conversely, if progress proves slower than expected, then increases in the target range are likely to occur later than currently anticipated.
The Committee is maintaining its existing policy of reinvesting principal payments from its holdings of agency debt and agency mortgage-backed securities in agency mortgage-backed securities and of rolling over maturing Treasury securities at auction. This policy, by keeping the Committee's holdings of longer-term securities at sizable levels, should help maintain accommodative financial conditions.
When the Committee decides to begin to remove policy accommodation, it will take a balanced approach consistent with its longer-run goals of maximum employment and inflation of 2 percent. The Committee currently anticipates that, even after employment and inflation are near mandate-consistent levels, economic conditions may, for some time, warrant keeping the target federal funds rate below levels the Committee views as normal in the longer run.
Voting for the FOMC monetary policy action were: Janet L. Yellen, Chair; William C. Dudley, Vice Chairman; Lael Brainard; Stanley Fischer; Loretta J. Mester; Jerome H. Powell; and Daniel K. Tarullo.
Voting against the action were Richard W. Fisher, who believed that, while the Committee should be patient in beginning to normalize monetary policy, improvement in the U.S. economic performance since October has moved forward, further than the majority of the Committee envisions, the date when it will likely be appropriate to increase the federal funds rate; Narayana Kocherlakota, who believed that the Committee's decision, in the context of ongoing low inflation and falling market-based measures of longer-term inflation expectations, created undue downside risk to the credibility of the 2 percent inflation target; and Charles I. Plosser, who believed that the statement should not stress the importance of the passage of time as a key element of its forward guidance and, given the improvement in economic conditions, should not emphasize the consistency of the current forward guidance with previous statements.
2014 Monetary Policy Releases
Last update: December 17, 2014
rab120 - ( a swing trade illustration )
usually, i speak in a very soft way, the key words are “critical”, “important” “gauge”. leave the rest for friends to have a ‘silent understanding’, ‘unspoken agreement’. i hear what you ‘want’. i will try to post more clear buy/sell signals next year as an effort to up (raise) the ante.
This year i did only one large swing Short trade. Here is the details:
Friday, 09/19/14 01:13:57 PM
We are getting closer to see the beginning of the BIG flush that may last 6/7 months, In a realistic way, it is from any time now.
Wait for the ‘signal’.
EDIT: Set up an event flag, an alert.
Thursday, 09/25/14 01:42:02 PM
Initiate your own plan, not others
Currently, the intraday low 1968.04 (important) (in progress) is lower than 1970.90 (frame 2, 0.236). So, the scope can switch from Frame 1 to Frame 2.
EDIT: saying that the condition is in favor of a Short sell, see the illustration chart.
Thursday, 09/25/14 04:51:02 PM
i am waiting for a 'lower-high' (see illustration chart ) to buy inverse ETF.
illustration chart link: http://mediaserver.fxstreet.com/Reports/b05b53dc-f954-444d-a666-6c2d322d5bab/stocks2_20110913112718.jpg
EDIT: Short Entry criteria
Wednesday, 10/15/14 03:05:26 PM
sold partial SPXU with 22% gain, about 140-145 x 3 SPX points.
EDIT: time to cover
Thursday, 10/16/14 10:48:26 AM
sold SPXU
EDIT: swing trade completed, very ‘reasonable’ entry/exit points.

12/16/14 SPX
Intraday movements hit Fibonacci points nicely

Supports in chart
http://www.chartupload.com/images/66935499426303984992.jpg
Right now, index parks roughly in the middle way in between 2085 and 1846.
In the next 9 and half trading days, we will know:
(1) SPX marks new ATH (>2085)
(2) close below the year opening number 1845.86
(3) stalls in between (1) & (2)
chart, first release 11/20, latest 12/15
1560.33 is the dominant route

(core position purged, holding Corp Bonds for DIV)
(wait for new year & new plans)
12/15/14 SPX
Open gaps
1999.40-2001.20 (10/30-10/31) (EDIT: gap filled)
1905.03-1909.38 (10/20-10/21)
resistance:
2019, 2031, 2049 (EDIT: intraday high 2018.69, in progress)
critical gauge 1996 ( 1995.72 0.3236 2079.47-1820.66 )
1980.60 0.382
supports in chart: http://www.chartupload.com/images/66935499426303984992.jpg


rab120 . . . . . . .
i don't speak Russian
>> The Collapsing Periphery . . . .
FYI
perspective ( The implosion of the US dollar centric Bretton Woods system. )
Mikhaïl Khazine sur allocution de Poutine//Mikhail Khazin about Putin's speech 4. Dec. 2014
12/14/14 SPX
Thursday, 12/04/14 03:10:04 PM
supports:
2047.41 ( 21 EMA @2046-2047 as of 12/04)
2019-2017
2000-1995 (EDIT: 12/12 2002.33)
lower targets: (it is still too early to project)
1980
1948-1920

rab120 . . . . . . .
before my retirement, I was a full-time signal processing flow analyst in Electromechanics field.
12/12/14 SPX
intraday low & closing number 2002.33
critical gauge 1996
1995.72 0.3236 2079.47-1820.66
2001.81 0.3000
0.3236 = 1.618/5
0.3000 = 1.500/5
wave relationship

Monday, 12/08/14 02:19:23 PM
2015 worst case lower rail projection
Here is the worst case number for both DJI & SPX in 2015.
SPX 1577 - 1651 (approx. 20% off)
DJI 14263 - 14198
(1) Important peak has been anticipated but has not been confirmed ( < 1996)
SPX has a 32/33 calendar week (157 trading day) cycle, next due is 04/15-16 +/-
I have no visibility what is the polarity will be for the coming April time window and how indices get there is also hard to see. For short term trader, Now, flex your ‘brain muscle’, we “suppose” to see SPX head down from the Dec high, right? EDIT: Right! (so far)
Stock Indices 10th December 2014
by WaveTrack
International GmbH
http://www.wavetrack.com/
with the deteriorating picture in Asia, be prepared for a more immediate sell signal.
The depth and duration of upcoming declines are expected to translate into percentage declines between -15% to -20% and last into April next year.
re: rab120 . . . . .
sorry for the late reply
DinDin first appeared around 1998 in SinaChat.com (no longer in existence), is a retiree, put 'Capital Preservation' as the first priority.
12/07/14 some follow-up works
This post summarize a few scatter topics together. some older material has been merged into this self-contained post. sorry for the redundancy.
(1) Important peak has been anticipated but has not been confirmed ( < 1996)
i am watching for any signs of a developing reversal lower.
(1.1) Middle term upper rail projection
SPX http://www.chartupload.com/images/99280192870917928554.jpg
2079.76 2104.27
2069.93 2085.06 2100.20 2115.20 2130.46
DJI http://www.chartupload.com/images/35572302753628157028.jpg
18062 18657
17975 18103 18230 18357 18485
As of 12/05/14
SPX 2079.76 vs. actual 2079.47 (+0.014%)
DJI 17975.13 vs. actual 17991.19 (-0.089%)
(1.2) 2015 worst case lower rail projection
Here is the worst case number for both DJI & SPX in 2015.
SPX 1577 - 1651 (approx. 20% off)
DJI 14263 - 14198
Charts depict the FIB relationship that the middle point between Oct/11 low to Dec/14 high (as of 12/05) is almost to the exact peak in Oct/07. Therefore, i am ‘convinced’ the apex is around the corner (with + 1~2% overrun),
DJI: Peak observed in 2007 is the middle point in between October/1110404.49 & recent high 17991.19 (12/05)
http://www.chartupload.com/images/04182133367648669401.jpg
SPX: Peak observed in 2007 is the middle point between October/11 low 1074.77 and recent high 2079.47 (12/05)
http://www.chartupload.com/images/26163504060383682835.jpg
In essence: Important peak has been anticipated , it is around the corner. One of the factors that continues to corroborate this assessment is the divergence of highs among the indices. SPX vs. NYA, SPX vs. RUT.
2) RUT & SPX divergence
2014 divergence
RUT marked double peaks, (1212.82 03/04), (1213.55 07/01). There is an obvious divergence between RUT & SPX in between March and December. The head chasing tail game is much complicated than those in 2000 and 2007. Especially after October Low, It is interesting to see either RUT pulls down SPX or SPX pulls up RUT,

Divergence in between SPX & RUT observed near 2007’s market Top.
http://www.chartupload.com/images/69920303216812123138.jpg
Divergence in between SPX & RUT observed in Summer/Fall 2002’s market Top.
http://www.chartupload.com/images/61436563608302826452.jpg
(3) Cycles
i nailed 09/19 SPX high by luck
date: off 1 trading day. 09/18 vs. 09/19
http://www.chartupload.com/images/44473658094155286587.jpg
magnitude: off 0.09 points, 2019.17 vs. 2019.26
http://www.chartupload.com/images/61360258892975648112.jpg
so, i applied the same method again.
Here is the follow-up works:
RUT has a 21/22 calendar week (104 trading day) cycle, next due is 04/28-29 +/-
SPX has a 32/33 calendar week (157 trading day) cycle, next due is 04/15-16 +/-
The minimum usage would be that the time window can serve as a turn date observer and a reversal flag, thus all; Two 32/33-week cycle length is the same as three 21/22-week cycle, the shorter harmonics can be viewed as the aliasing between that two major cycles. The short cycles in between each main cycle behaves differently. imho. hunting shorter harmonic cycles is susceptible with noises, a task that invites frustration. I have no visibility what is the polarity will be for the coming April time window and how indices get there is also hard to see. For short term trader, Now, flex your ‘brain muscle’, we “suppose” to see SPX head down from the Dec high, right?
32/33 week cycle (157 trading day) observed in SPX, if recurs, due 04/15-16/2015, +/-

21/22 week cycle (104 trading day) observed in RUT 2000, if recurs, due 04/28-29/2015, +/-

self-reference:
1
2
RE: Hindenburg Omen Criteria
FYI, FWIW
Weekend Market Analysis
(12/6/14)
http://www.amateur-investor.net/AII_Weekend_AnalysisDec_6_14.htm
one key aspect that is ignored by investors when dealing with Hindenburg Omen's is whether the market is overvalued or not. When you factor in these two additional parameters (Shiller's PE Ratio is at least "18" the prior month and the S&P 500 is 100% or more above its 5 Year Low) then the number of signals is reduced
As you can see since 1980 there have only been "9" HO Signals ... so it has been a rare occurrence.
chart:
http://www.amateur-investor.net/_derived/AII_Weekend_AnalysisDec_6_14.htm_txt_ho1214.gif
chart:
http://www.amateur-investor.net/_derived/AII_Weekend_AnalysisDec_6_14.htm_txt_ho1214a.gif
Amateur Investors
12/05/14 S&P/DJI
Charts depict the FIB relationship that the middle point between Oct/11 low to Dec/14 high (as of 12/05) is almost to the exact peak in Oct/07. Therefore, i am ‘convinced’ the apex is around the corner (with + 1~2% overrun),
As of 12/05/14
SPX 2079.76 (2100, 2130) vs. actual 2079.47
DJI 17975.13 (18062, 18484) vs. actual 17991.19 (+0.089%)
2015 projection
Here is the worst case number for both DJI & SPX in 2015. Timing will be discussed separately.
SPX 1577-1651 (approx. 20% off)
DJI 14263-14198


S&P 500 Revenue Growth Information & Trend
S&P 500's pace of Revenue growth in 3 Q 2014 accelerated to 4.19 % year on year
details: http://csimarket.com/Industry/industry_growth_rates.php
Growth Rates by Sector within Total Market
http://csimarket.com/Industry/Industry_Growth.php?
12/05/14 DJI @ critical juncture 17975-18062
DJI last update 09/15, see re-post
intraday high 17991.19, in progress
DJI moves into target zone Zone 1
Zone 1 17975-18062
Zone 2 18062-18484
Monday, 09/15/14 11:57:44 PM
link
As the chart illustrated: 17365-17499 is the gauge (and the resistance) for the new assault above 18000, may be in between 18062-18485. (+5.2-7.7% above the recent high 17161.55)

12/04/14 SPX & Integrated Oil
Not much has changed since last update (11/23)
dindindon Sunday, 11/23/14 01:28:34 PM
(1) 2079.76 A gauge to see 2100-2130
(2) 2130.46 Middle term upper target
if “how to get these numbers” is important, then check with the following chart:
http://www.chartupload.com/images/99280192870917928554.jpg
Anthony Caldaro 12/03/14 Wednesday update
https://caldaro.wordpress.com/2014/12/03/wednesday-update-468/
Medium term support rises to the 2070 and 2019 pivots, with resistance at the 2085 and 2131 pivots.


11/23/14 SPX
Post No. 500
Continuation from 11/21
The following 2 lines came from my prior post that describes the near term scenario in a simple & succinct way.
(1) 2079.76 A gauge to see 2100-2130
(2) 2130.46 Middle term upper target
if “how to get these numbers” is important, then check with the following two charts.
(3) http://www.chartupload.com/images/09909473640003001790.jpg
(4) http://www.chartupload.com/images/05946992392831121277.jpg
Let’s see what other technicians say:
WaveTrack 24th November 2014
http://www.wavetrack.com/
The S&P 500 has clocked another record high and it will be next week’s European stock index performance that offers guidance as to whether the mid-October upswing has already ended or alternatively, continuing higher to our next upside targets towards 2128.25+/-. It remains a delicate balance between these two short-term scenarios
Anthony Caldaro Posted on November 22, 2014
https://caldaro.wordpress.com/2014/11/22/weekend-update-475/
This market hit the 2070 pivot on Friday. Around these pivots we have a cluster of Fibonacci wave relationships, which should act as resistance: 2078, 2082 and 2084. This small six point range locks in the entire advance from the SPX 1075 Primary II low, making it quite important. Should this uptrend break through it, and the pivots, the next pivot is at SPX 2131.
11/21/14 SPX & Goldman Sachs 2015 outlook
Near term upper side target 2069.93 has been met, intraday high 2071.46. Have mentioned couple times: No short action without seeing a pullback & its lower high.
2079.76
A gauge to see 2100-2130
2012.27
Near term support, floats with ATH (0.236 2071.46-1820.66)
2130.46
Middle term upper target
2213.50
Long term upper target 2213.50-2316.26.
1525.37
End of Bull market gauge, floats with ATH (0.382 2071.46-666.79)
Numbers in chart

Goldman Sachs equity strategist David Kostin is out with his 2015 outlook
Nov. 20, 2014, 9:21 AM
Full text & charts:
http://www.businessinsider.com/goldman-sachs-2015-sp-500-target-2100-2014-11
Kostin's price target: 2,100 In 2015.
Here's the chart of the Goldman's outlook for the S&P 500.
link
And the outlook for interest rates.
link
11/15/14 SPX (2)
For quite a while, I have 2047.41 (2050) as the upper side target. On 11/14 SPX marked ATH 2046.18.
Seemingly, we are getting closer to a sizable pullback, so near and yet so far.
One of the mechanical indicators: Parabolic SAR (usage link)

Near term upper rail targets:
set 1 2047.13, 2053.16, 2064.59 chart link
set 2 2047.41, 2069.93 chart link
Near term supports:
2013, 2004
1993, 1973
Middle term upper rail target range: 2130-2214.
- Gauge 2079.76 to see the possibility of assulting 2130
- imho, a pullback below 1520 decisively may confirm the end of the current bull market.
11/15/14 SPX
Near tern upper side targets
set 1 2047.13, 2053.16, 2064.59 (see bottom chart)
set 2 2047.41, 2069.93 (use chart link in archive)
archive
Wednesday, 11/05/14 11:22:31 AM
The bounce sine 10/15 has no “sizable” pullbacks, so i use the larger time frame as reference.
Saturday, 05/24/14 01:57:15 PM
1931.41 is the pivot/inflection point to gauge whether SPX will enter the zone 1970-2050.
chart http://www.chartupload.com/images/05946992392831121277.jpg

Hurst Cycles: The 9-Year Cycle by David Hickson
link creditor: gtsourdinis
http://investorshub.advfn.com/boards/read_msg.aspx?message_id=108200989
FWIW
Hurst Cycles - Analysis and Trading of Financial Markets
The 9-Year Cycle
November 14, 2014 by David Hickson.
Full text & charts: link
It is an “Aha!” moment that removes analysis uncertainty, and suddenly we can see just a bit further into the misty future.
we expect the bull market to continue until about March 2015 (where the first peak of the 18-month cycle is likely to form). There will be another run up which will complete in about October 2015, but it is unlikely to exceed the earlier peak.
Hurst Cycles
Contributors
Recent Comments
Archives
http://hurstcycles.com/authors-page/#sthash.Rnp5FwJ2.dpbs
11/15/14 Cycles
I demonstrated that there are different ways finding a Resistance/Support.
The more ways reach the same conclusion the better the odds.
Sunday, 11/09/14 05:39:54 PM
http://investorshub.advfn.com/boards/read_msg.aspx?message_id=107990569
HD168 has a number 25 points higher than 2019, thus 2044 (link)
Here is the theoretical details (table in chart)
2044.00 = 1266.74 + (1422.38 – 1074.77) * 2.236
Thursday, 11/13/14 11:33:11 AM
The major Fib point is at 2047.41 = [ 1.382:(1370.58-666.79):1074.77 ].
chart (2012): http://www.chartupload.com/images/05946992392831121277.jpg
Friday, November 14, 2014
Posted by PretzelLogic at 4:30 AM
http://www.pretzelcharts.com/
I really don't want readers to get too focused on the wave labels, because this entire wave remains borderline "uncountable."
The Next 18 Month Hurst Cycle
November 5, 2014 by SilentOne.
http://hurstcycles.com/the-next-18-month-hurst-cycle/#sthash.djiZMVeH.pLvdfnHS.dpbs
I have no preconceived ideas of what these markets will do from here. Each time you expect cycles to turn somewhat bearish, CBs step in to goose the markets.
Perhaps the only thing to keep in mind for now is that a 9 year Hurst cycle low (actual cycle period is expected to run approx. 7 years) is due late 2015 into 2016. How we get there is hard to see. I wonder how active CBs will be with QE from here through 2015.
September 6, 2014, 7:25:58 PM SPX
time stamp link: http://www.chartupload.com/viewer.php?file=64954477851568650340.jpg

08/01/14
I came out two dates: 08/22 +/- & 09/18 +/- , don't know which one will dominate.

08/05/14
A local Low in between 08/01-08/12 (EDIT: transpired on 08/07, intraday low 1904.78)
09/06/14 SPX Cycles
The actions in the next few weeks (center 09/18 +/-, see chart) will corroborate for a major decline to take hold.
09/22/14
We got an intraday based ATH 1919.26 on 09/19, one day late than the projected date 09/18 (center, +/-).
It is still too early to draw a decisive conclusion.
The low on 08/07 (1904.78), the high on 09/19 (1919.26), and a coming low will provide 3 points for a better estimating the trajectory. If the coming low is lower than 1904.78 that would be good news for bears.
Friday, 11/07/14 02:23:40 PM
Cycles - Eric Hadik & Hurst .
http://investorshub.advfn.com/boards/read_msg.aspx?message_id=107955458
do not expect exact dates/numbers disclosure in free and time delayed information. But, there is enough hints.
Eric Hadik
http://www.insiidetrack.com/
Stock Indices Fulfill Sept. 15--19th Cycle Peak; Project Sharp Drop into October! (1st Phase?) Action of Oct. 15--17th Could Impact Future Cycle... in April 2015.
Prepared by Eric S. Hadik Outlook 2014--2015
http://www.consensus-inc.com/002001i/knay1537/spec-rep/0914spl-itt.htm
08/29/14--Stock Indices remain positive and on track for an overall advance into 4Q 2014. 2014-- most synergistic in 4Q 2014.
Re: Classic tops form one of three ways
"The most common is the rounded top followed by a small 2 or 3% drop ...... "
ahimsak: Good observations
synopsis:
resistance 2047.41 2063.46-2069.93
For the current ramp, once SPX surpasses 2047.41, the next FIB cluster is 2063.46-2069.93
The major Fib point is at 2047.41 = [ 1.382:(1370.58-666.79):1074.77 ]. refer to the chart, where 1370.58 & 1074.77 are two major FIB. points.
chart: http://www.chartupload.com/images/05946992392831121277.jpg
In the past quarters, not every ramp knocked out the major Fib point at the first attempt. For example, 1474.51 (actual) vs. 1481.56, ... etc. No matter it was a successful or failed attempt, there was a sizable pullback.
---Fibs-- Actual
1440.55 (1422.38)
1481.56 (1474.51)
1684.25 (1687.18)
1861.61 (1850.84)
1880.12 (1897.28)
2031.01 (2019.26) (1.000 1687.18:1343.35)
2047.41 (???????)
2069.93? (??????)
archive:
Saturday, 05/24/14 01:57:15 PM
imho, 1931.41 is the pivot/inflection point to gauge whether SPX will enter the zone 1970-2050.
CHINA/BABA . My Goodness . . . .
(HD168) The only thing goldman left is the fraud CHINA/BABA?

Home Page
http://www.alibabagroup.com/en/global/home
Businesses
http://www.alibabagroup.com/en/about/businesses
Taobao Marketplace
Tmall.com (Sky Cat)
Juhuasuan
AliExpress
Alibaba.com
1688.com
Alipay
Alimama
China Smart Logistics
Alibaba Cloud Computing
Double 11 Buying binges ( 11/11/2014 )
in 2 seconds, sales reaches one billion Yuan
in 38 minutes, 10 billions Yuan

10 hours 51 minutes, 30 Billion Yuan ( $ 4,906,339,768 )

From 175 nations/Regions world wide

Godify: Fans run into Euphoria


(click to see) 'My Goodness!'
photo: http://i.ssimg.cn/guancha/News/2014/11/11/635513159462135833.jpg
China’s stock markets change forever on Nov/17/14
Shanghai-HK stock connect starts on Nov 17
http://www.chinadaily.com.cn/business/2014-11/10/content_18891935.htm
BEIJING -- The Shanghai-Hong Kong stock exchange connection will start stock trading on Nov 17,
The China Securities Regulatory Commission (CSRC) and the Securities and Futures Commission (SFC) of Hong Kong have approved the launch of the pilot program to provide mutual trading access between the Shanghai and Hong Kong stock markets
Landmark Hong Kong-China stock trading scheme to start Nov. 17
http://www.reuters.com/article/2014/11/10/us-hongkong-china-stockconnect-idUSKCN0IU01A20141110
in a move that will grant foreign investors unprecedented access to China's $3.9 trillion stock market and create the world's third-largest equity market

11/09/14 MISC
HD168 has a number 25 points higher than 2019, thus 2044 (link)
Here is the theoretical details (table in chart 3)
2044.00 = 1266.74 + (1422.38 – 1074.77) * 2.236
gdl has a pullback number 1945 (link), use his 2038 (2037.5 , Rick Ackerman) as a reference,
so:
1945.22 = [0.236, (2037.5-1646.47)] (10/09/13 low 1646.47)
The Rising Din of ‘Recovery’ Hubris
Rick Ackerman November 7, 2014 2:08 am GMT
Home: http://www.rickackerman.com/
quoting article: http://www.rickackerman.com/2014/11/the-rising-din-of-recovery-hubris/
We’ve been using a 2037.50 rally target for the E-Mini S&Ps, but check out the chart accompanying today’s tout if you want to see how much higher the futures could go if that Hidden Pivot fails to contain the rampage.
10th November 2014 http://www.wavetrack.com/
The S&P’s advance from the mid-Oct. low of 1820.66 is unfolding into a five wave impulse pattern but its internal structure can be counted in so many ways because there have been so little overlaps in its development of higher highs, higher lows.
We continue to describe two ongoing short-term possibilities
– the 1820.66 upswing is part of a zig zag pattern that represents the second sequence within a larger expanding flat pattern with upside targets to 2100.72
or more realistically, an incomplete five wave impulse pattern labeled intermediate wave (5) and representing the final sequence of primary wave 3 that began from the November ’11 lows with upside targets to 2128.25.
There is an estranged third scenario that complicates the differing short-term permutations where a more immediate high ends wave (5) at current levels of 2034.25+/- but its inclusion is only justified when comparing to the recent upside progress of European and Asian indices.

Sunday, 11/02/14 04:24:57 PM
short term resistance/high targets:
The bounce sine 10/15 has no “sizable” pullbacks, so i use the larger time frame as reference. i need some fresh hourly data to nail-in which cluster has the better odds.
2036.54-2038.24
chart 1 http://www.chartupload.com/images/99668381249151258206.jpg
2024.90-2031.01
chart 2 http://www.chartupload.com/images/40646545482565503695.jpg
In a broad direction:
(05/24:) 1931.41 is the pivot/inflection point to gauge whether SPX will enter the zone 1970-2050.
chart 3 http://www.chartupload.com/images/05946992392831121277.jpg

Cycles - Eric Hadik & Hurst . .
note:
do not expect exact dates/numbers disclosure in free and time delayed information. But, there is enough hints.
Eric Hadik
http://www.insiidetrack.com/
Stock Indices Fulfill Sept. 15--19th Cycle Peak; Project Sharp Drop into October! (1st Phase?) Action of Oct. 15--17th Could Impact Future Cycle... in April 2015.
Prepared by Eric S. Hadik Outlook 2014--2015
http://www.consensus-inc.com/002001i/knay1537/spec-rep/0914spl-itt.htm
08/29/14--Stock Indices remain positive and on track for an overall advance into 4Q 2014. 2014--most synergistic in 4Q 2014--is not only when so many Stock Index cycles and timing indicators converge, it is also the completion/transition of multiple social/economic/financial cycles. A stock market peak in 4Q 2014 would complete a 40-year inflationary advance in Stock Indices (and many other markets)--originating from the 4Q 1974 bottom.
Eric S Hadik INSIIDE Track Trading Friday, October 31, 2014 - 6:57pm
http://www.consensus-inc.net/category/contributor/insiide-track-trading
Stock Indices Confirm Oct. 15-17 Cycle Low!
Advance Into Early-November 2014 Projected (Discussed Since April 2013)…
Gold and Silver Reach October Resistance and Reverse; Sharp Drop Expected On Oct. 30-Nov. 7!
Eric Hadik’s Cycle Progression™
http://www.insiidetrack.com/Cycle_Progression.htm
The problem that most cycle analysts and cycle programs have is that they are constantly searching ONLY the lows or ONLY the highs for a consistent cycle. The futility of this exercise forces most novice “cyclists” to give up in desperation. Cycles are a dynamic entity -- they keep progressing and changing (direction--not amplitude). This disguise is what throws most cycle observers off track and forces most technicians to conclude that cycles are ambiguous, inconsistent and worthless.
The Next 18 Month Hurst Cycle
http://hurstcycles.com/the-next-18-month-hurst-cycle/#sthash.djiZMVeH.82aHSofJ.dpbs
So with new highs, one has to conclude that we saw an 18 month cycle low here in October, with the actual cycle period running almost 16 months. We are only 4 weeks up into this new cycle. How right translated can this 9 year cycle extend? I have no preconceived ideas of what these markets will do from here. Each time you expect cycles to turn somewhat bearish, CBs step in to goose the markets.
Perspective
ahimsak:
You are right, the root is neither R nor D
FWIW
Occupy was right: capitalism has failed the world
One of the slogans of the 2011 Occupy protests was 'capitalism isn't working'. Now, in an epic, groundbreaking new book, French economist Thomas Piketty explains why they're right
The Observer, Saturday 12 April 2014
Occupy was right: capitalism has failed the world
http://www.theguardian.com/books/2014/apr/13/occupy-right-capitalism-failed-world-french-economist-thomas-piketty
In essence: ( I compiled the lengthy commentary in a few paragraphs)
In short, the arguments have centred on two poles:
the first is a tradition that begins with Karl Marx, who believed that capitalism would self-destruct in the endless pursuit of diminishing profit returns.
At the opposite end of the spectrum is the work of Simon Kuznets, who won a Nobel prize in 1971 and who made the case that the inequality gap inevitably grows smaller as economies develop and become sophisticated.
I was genuinely surprised by what I found, which was that inequality is growing so fast and that capitalism cannot apparently solve it. One of the most penetrating of these is the rise of managers, or "super-managers", who do not produce wealth but who derive a salary from it. This is effectively a form of theft.
You have to ask what does this mean for ordinary people, who are not billionaires and who will never will be billionaires. Well, I think it means a deterioration of the public sector. You only have to look at what Obama's administration wants to do – which is to erode inequality in healthcare and so on – and how difficult it is to achieve that, to understand how important this is.
What have we learned? Capitalism is bad. Hooray! What's the answer? Socialism? Hope so. "It is not quite so simple"
America in Decay
The Sources of Political Dysfunction
By Francis Fukuyama
From the Council on Foreign Relations September/October 2014 Issue
Yoshihiro Francis Fukuyama (born October 27, 1952) is an American political scientist, political economist, and author.
http://en.wikipedia.org/wiki/Francis_Fukuyama
An excerpt:
full text:
http://atlasmonitor.wordpress.com/2014/09/30/america-in-decay-the-sources-of-political-dysfunction-by-francis-fukuyama/
original link: http://www.foreignaffairs.com/articles/141729/francis-fukuyama/america-in-decay
NO WAY OUT
The U.S. political system has decayed over time because its traditional system of checks and balances has deepened and become increasingly rigid. In an environment of sharp political polarization, this decentralized system is less and less able to represent majority interests and gives excessive representation to the views of interest groups and activist organizations that collectively do not add up to a sovereign American people.
The depressing bottom line is that given how self-reinforcing the country’s political malaise is, and how unlikely the prospects for constructive incremental reform are, the decay of American politics will probably continue until some external shock comes along to catalyze a true reform coalition and galvanize it into action.
11/06/14 SPX
short term support
1995-1984, 1976
immediate resistance
2036.54-2038.24
All Time High 2031.61 on 11/06/2014
projection 2031.01 vs. actual 2031.61
Prognosis:
- Use larger time frame.
- pick 1687.18, 1343.35 in chart 1.
- length 343.87 = (1687.18 – 1343.35),
- Ducking on top of 1687.18, 1687.18 + 343.87 = 2031.01
- Further details:
- 1688.73 (purple color in chart 1) can also be found
- in chart (2), in wave set No. 3, FIB 0.618
- That says the SPX is sticking on this route.
- The 1.0 length implies SPX is around the terminal point +/0.
- no gobbledygook wave count involved in calculation
No update is required at this moment.
Sunday, 11/02/14 04:24:57 PM
http://investorshub.advfn.com/boards/read_msg.aspx?message_id=107769303
short term resistance/high targets:
The bounce sine 10/15 has no “sizable” pullbacks, so i use the larger time frame as reference. i need some fresh hourly data to nail-in which cluster has the better odds.
2036.54-2038.24
http://www.chartupload.com/images/99668381249151258206.jpg
2024.90-2031.01
http://www.chartupload.com/images/40646545482565503695.jpg
chart 1:

In a broad direction:
(05/24:) 1931.41 is the pivot/inflection point to gauge whether SPX will enter the zone 1970-2050.
http://www.chartupload.com/images/05946992392831121277.jpg
chart 2:


Economic forecast summary: November 2014 by Economist.com
Economist
Growth in emerging markets is disappointing, leaving them particularly vulnerable to capital outflows as the normalisation of US monetary policy progresses.
The US recovery remains on track, and we maintain our 2014 GDP growth estimate of 2.2%. We forecast a pick-up to 3.2% in 2015, provided current fears of a renewed recession in Europe and elsewhere do not materialise.
The US Fed is on track to conclude its bond buying programme in October. Markets are now looking ahead to the first hike in US policy rates, which we expect in the second half of 2015. .
Conditions in the euro zone look increasingly bleak. We have cut our GDP growth forecasts in 2015 to 1.1% from 1.2% and in 2016 to 1.4% from 1.7%.
Full text and charts: (Oil, Non-oil commodities, ... )
Link (requires MS Power point)
Japan QE Torch relay
jumanji0881
There are many 'foot kicking' under the table. Japan has his own calculator. Abe did not sign the TPP (Trans-Pacific Partnership), it was a major failure for OB. Japan keeps some leeway in case Da-Brother's 'sickness' is becoming 'incurable'. Japan is a developed nation, not a emerging country, You asked a good question that is too sensitive to answer here. thus why i did a few very subtle implications in my "Great Transition" series. Same thing for the following one:
Putin will not waste his bullets, he has his calculator too.
It is about interest rate .... (Let me stop here .. )
The great transition (8) After Fed QE
http://investorshub.advfn.com/boards/read_msg.aspx?message_id=107876696
deliberative strategic moves
(Why Putin is doing this .... to be elaborated)
2014/10/29
NATO: ‘significant’ Russian military flights over Europe
http://airheadsfly.com/2014/10/29/nato-significant-russian-military-manoeuvers-over-europe/
The great transition (8) After Fed QE addendum
Fed has taken the advantage of dollar’s hegemony so that they can print out of thin air. No wonder why Putin says U.S. is living beyond its means like a "parasite" on global economy.
Putin says U.S. is "parasite" on global economy
http://www.reuters.com/article/2011/08/01/us-russia-putin-usa-idUSTRE77052R20110801
The Yellow color arrows indicates the possible QE hot money flow back to US from Asia emerging market. A similar flow chart applies to Europe nations ....

Federal Debt Held by Federal Reserve Banks
2014:Q2: 2,705.9 Billions of Dollars
http://research.stlouisfed.org/fred2/series/FDHBFRBN

Road side report said China "swapped" in a “considerable amount” short term bond during the 'Operation Twist', and that was the main reason Fed closed out OT. No body knows what is the impact on rate if China simply ask for principle on maturity.
The Federal Open Market Committee concluded its September 21, 2011 Meeting at about 2:15 p.m. EDT by announcing the implementation of Operation Twist. This is a plan to purchase $400 billion of bonds with maturities of 6 to 30 years and to sell bonds with maturities less than 3 years, thereby extending the average maturity of the Fed's own portfolio
Further, on June 20, 2012 the Federal Open Market Committee announced an extension to the Twist program by adding additionally $267 billion thereby extending it throughout 2012.
http://en.wikipedia.org/wiki/History_of_Federal_Open_Market_Committee_actions#Operation_Twist_.282011.29
>> A tad bullish
Larry Edelson gave out his reasons in quite a few separate commentaries.
In one of his commentary he came out an amount of "Safe Heaven chasing" money that will flow back to US. I misplaced the link somewhere, please check his archive.
----------------------------
FWIW
Poly-perspective (Bull, Bear, conspiracy, Road side news)
just one step shy from the Entertainment department
----------------------------
European Flight Capital to Accelerate. What to Do …
Larry Edelson | Wednesday, September 10, 2014 at 7:30 am
http://www.moneyandmarkets.com/european-flight-capital-accelerate-65364#.VFq1fmdNeSp
use this link http://www.moneyandmarkets.com/
and click Larry Edelson for his complete archive
Larry-Edelson on Gold: When will the bottom come?
FWIW
Your most important questions, answered!
by Larry Edelson
Larry Edelson | Wednesday, November 5, 2014 at 7:30 am
http://www.moneyandmarkets.com/important-questions-answered-2-67831#.VFqLfGdNeSo
I'm getting so many questions from readers, so this week I'm going to devote my column to answering the most important ones. Let's get started!
Q: Larry, you had a tough time earlier this year with gold and silver, but now, you're nailing it again. The precious metals are collapsing, just as you said they would. When will the bottom come?
A: Not for a while! Gold has now broken the June 2013 low and shattered monthly support at the $1,170 level. There may be another bounce, but gold will not bottom until the die-hard bulls are trashed.
That will be at much lower prices, at least in the medium term. The same for silver. I sure hope you took me up on my suggestions of the past several weeks to purchase inverse ETFs on gold, silver and mining shares. If you did, you're sitting pretty with some very robust gains. Hold those positions. I expect more gains to come as the metals and mining shares slide further into next year.
Q: Why isn't inflation a big problem now? Everyone is expecting it and the world's central banks have certainly printed trillions of dollars of paper money.
A: As I've said all along, printing money by itself is not inflationary if the majority of investors and consumers don't want to spend or borrow money. That's been the case for years now as consumers, investors and businesses — the private sector — all retrench.
Moreover, the money printed thus far, around six trillion dollars between the U.S. Fed, the Eurpoean Central Bank (ECB) and the Bank of Japan (BOJ) — is a tiny fraction of the amount of debt swirling the globe, a conservatively estimated $158 trillion.
So there is no way we are going to see hyperinflation, and in fact, the opposite is occurring, deflation!
Q: You’ve been forecasting that the U.S. stock market will take a moonshot to Dow 21,000 — even as high as 31,000 — over the next few years. Is that forecast still on target?
A: Absolutely. There is no doubt in my mind we will see the Dow move to at least 21,000 by 2016, and probably much higher. And not despite turmoil in the world, but because of it. The Dow and other blue-chip type stocks can and often do act just like gold, as a safe haven for capital.
But the Dow has not yet completely broken out to the upside. A sharp, swift correction is still overdue. We got the first phase of it in early October. October’s swings were the greatest in 119 years in the Dow. More wild swings are coming.
The great transition (8) After Fed QE

The Print Machine™ is on “scheduled maintenance”.
No one knows when it will be reactivated.

What's Next?
‘Hot money Reverse Repo’ is required to fleece the emerging market sheep
The Chess Master moves again!


"We have no need of getting involved in things, of ordering others around, but we want others to stay out of our affairs as well and to stop pretending they rule the world. That is all."
Meeting of the Valdai International Discussion Club
24 October 2014, Sochi http://www.paulcraigroberts.org/2014/10/25/vladimir-putin-leader-moral-world-paul-craig-roberts/

2014/10/29 (Why Putin is doing this .... to be elaborated)
NATO: ‘significant’ Russian military flights over Europe
http://airheadsfly.com/2014/10/29/nato-significant-russian-military-manoeuvers-over-europe/
OCTOBER 31, 2014 (The QE Torch Relay)
JAPAN JUST BOOSTED QE AND THE NIKKEI EXPLODED TO A SEVEN YEAR HIGH


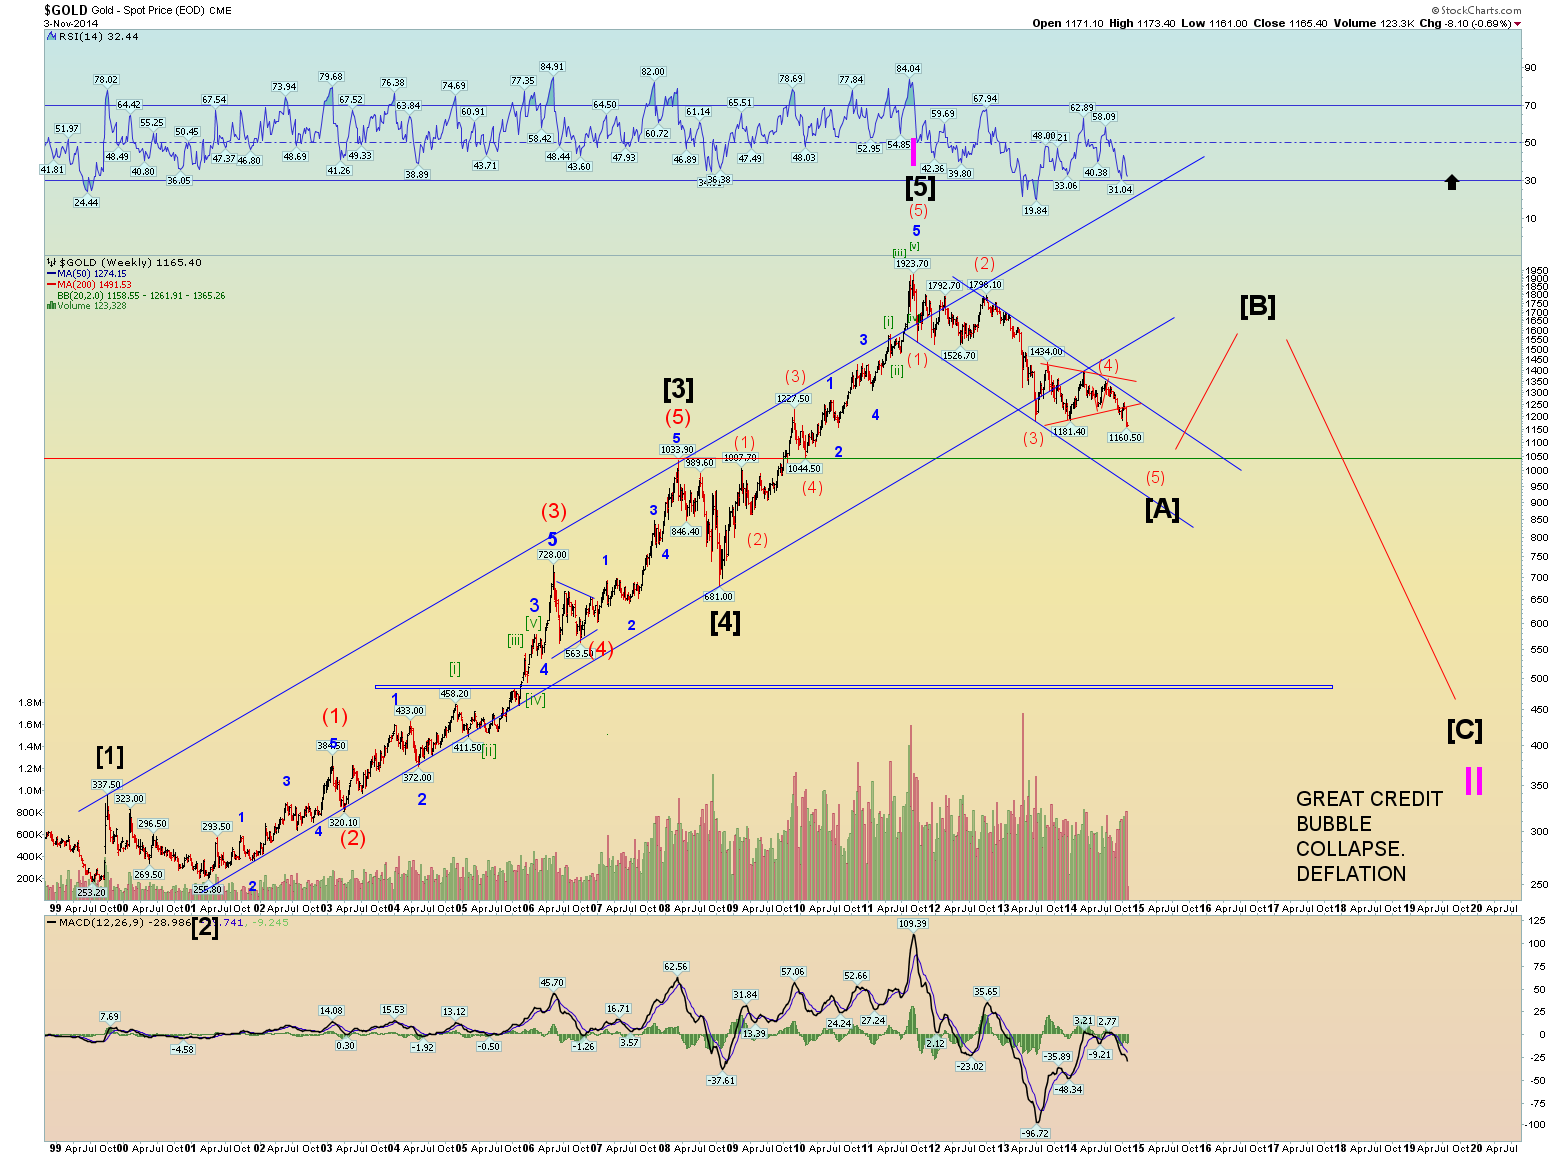
11/05/14 Gold
I stay away from this tough Golden Treasury Hunt®. In this hunting game, You win skirmish cheap chips occasionally. Your hard earned $ can be robbed by Da-Pa-Pa with high odds.
The Chart work is courtesy of Daneric's Elliott Waves
Daneric's Elliott Waves
http://danericselliottwaves.blogspot.com/
Monday, November 3, 2014
Gold confirmed wave (5) down.
Monday, 09/15/14 12:42:35 PM
Martin Armstrong GOLD: US$875 - $910. Ai-ya-yaa!
Poly-Perspective, FYI, FWIW ( Don't beat the messenger )
Martin Armstrong on Gold: Bottoms out at the End of 2015 / Early 2016 at the latest, with a worst case scenario of US$650 with 'ideal' somewhere between US$875 - $910.
Published on Sep 14, 2014
Thursday, 07/31/14 10:39:33 AM
Gold
down trend
GDX
down trend
11/05/14 SPX
short term support
1996.42-1985.93, 1976.36
immediate resistance
2024.90-2031.01
Prognosis:
(1) All Time High 2024.46 on 11/03/2014
(2) projection reconciliation (see chart in archive)
- Use larger time frame.
- length 207.77 = (1474.51 - 1266.74),
- ducking on top of 1560.33 (low on 06/24/13, an important point)
with Fibonacci ratio 2.236 maps to
2024.90 vs. actual 2024.46
No update is required at this moment.
Sunday, 11/02/14 04:24:57 PM
http://investorshub.advfn.com/boards/read_msg.aspx?message_id=107769303
short term resistance/high targets:
The bounce sine 10/15 has no “sizeable” pullbacks, so i use the larger time frame as reference. i need some fresh hourly data to nail-in which cluster has the better odds.
2036.54-2038.24
http://www.chartupload.com/images/99668381249151258206.jpg
2024.90-2031.01
http://www.chartupload.com/images/40646545482565503695.jpg
In a broad direction:
(05/24:) 1931.41 is the pivot/inflection point to gauge whether SPX will enter the zone 1970-2050.
http://www.chartupload.com/images/05946992392831121277.jpg

Time window
[ahimsak:] Never know for sure, but looks like the beginning of a top to me.
FWIW:
SemiBizz Nov 3 2014, 10:58 AM
Good Chance of DJIA Top this Week, others to follow, Confluence of Gann and Lindsay Models (eom)
http://www.traders-talk.com/mb2/index.php?s=&showtopic=157155&view=findpost&p=709643
SemiBizz Nov 3 2014, 06:14 PM
After today's (11/03) outcome, we do have all the ingredients in place for a top in the SPX. We had the high volume high on 9/19, and on Friday with locally stronger volume we failed to test that 9/19 high, and on Monday we tested both Friday's and the 9/19 high on much lighter volume and closed down on the day and inside Friday's trading range. We could delay one more day on light volume, but if we see a gap down on volume Tuesday or Wednesday, this could be all over.
http://www.traders-talk.com/mb2/index.php?s=&showtopic=157155&view=findpost&p=709664
dindindon Saturday, 10/25/14 09:31:37 PM
a dovish FOMC may spur a SPX rally into early November (11/03-11/07). Let’s see.
http://investorshub.advfn.com/boards/read_msg.aspx?message_id=107543851

