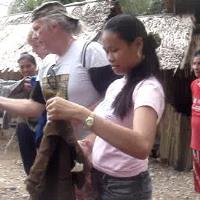
Feeding village children in Mindanao Philippines and watching my boy and girl grow up.
Register for free to join our community of investors and share your ideas. You will also get access to streaming quotes, interactive charts, trades, portfolio, live options flow and more tools.
There is resistance at .06-.065 and the weekly middly bb is at .07. If we could break through that I would be greatly impressed. I am not trading it though. Core position holding.
This is still the trendline I am watching. More time in the barrel.
https://stockcharts.com/h-sc/ui?s=GDVM&p=M&yr=4&mn=3&dy=10&id=p86339660684&a=1404420838&listNum=1
When someone our age says "recovery" one's ears perk up.
We are back testing the trend line again. .041 print will flip the SAR
https://stockcharts.com/h-sc/ui?s=GDVM&p=D&yr=0&mn=4&dy=10&id=p95985634396&a=1409140523&listNum=1
Full recovery?
Nothing to say that has not been said. I am willing to wait and ride the consolidation. Add when I feel the selling is overdone.
If you have a better company to put $ into, let me know. I can not. All otc is in crapper.
I am prepared to accumulate over the next 8 months b4 the next leg if necessary (as long as nothing changes fundmentally).
What I see is a stock that has gone up 140,000% in 2 years and corrected 75% in 3 months. I see an Accumulation and OnBalance chart that shows massive accumulation. I HOPE I have sufficient funds to double up at the bottom of this correction whether that is at .04 or .02.
https://stockcharts.com/h-sc/ui?s=GDVM&p=D&yr=10&mn=3&dy=10&id=p61375109690&a=1400342989&listNum=1
https://stockcharts.com/h-sc/ui?s=GDVM&p=D&yr=0&mn=4&dy=10&id=p95985634396&a=1409140523&listNum=1
Retest broken. More patience required.
https://stockcharts.com/h-sc/ui?s=GDVM&p=D&yr=0&mn=4&dy=10&id=p95985634396&a=1409140523&listNum=1
Back testing trendline
And 200 day sma
Yeah I noticed you guys have been posting here for years. Tenatious.
He said "maybe".
I was drawn to this stock a few months ago because of insider buying.
OHeeron has purchased over $350,000.00 worth of stock in the last 3 years. That is 15% of his next worth.
.06 will flip SAR.
MACD/PPO crossed up.
https://stockcharts.com/h-sc/ui?s=GDVM
We are back above the 200 day sma.
Testing middle bollinger band.
My core is 1 mill. I will flip 100k if it stays under 200 day sma, otherwise will just hold if we get above it.
I still feel that we have more time in the barrel.
No chasing. I hold a ton.
Lol. Flipped 100k, holding a million.
Nicely played. I flipped a few that I bought at .034 but have not bought them back yet.
1st resistance 200 day sma at .047
I hope you are right. If nothing changes fundamentally with the company, it will probably make people beau coup $$ a year from now.
I added some more at .034 and will add in .02's with all in at .015 if we get there. There is no bottom picking strategy for catching a falling knife
I thought it would have happened already. It has been a premium sucking markrt. Dcrewing bulls and bears.
The market looks 6 months out, so its looking at November, which SHOULD put us smack in the middle of the recession. The overall market has held up remarkably well considering the rate hikes, bank failures, etc.
The one negative for the market is that Jim Cramer is bullish. I am a big inverse Cramer guy.
Saw that posted on Twitter.
Yes, i am looking for opportunity to buy lower if it happens.
Perhaps, but I have seen stocks do their own thing, ignoring good news in a bear market and ignoring bad news in a bull market. I find it difficult to believe that we are in the 3's because of a name change that we all know is coming. I lean toward the belief that this is part of the bear market that the other otc stocks have been experiencing for awhile and Cathie Woods has been experiencing for over a year in some very good companies.
200 day sma is .047. 200 day ema is .0519. Both have been broken. Tested them last week and held then definitively broke them today.
https://stockcharts.com/h-sc/ui?s=GDVM&p=M&yr=4&mn=3&dy=10&id=p86339660684&a=1404420838&listNum=1
Previous two corrections were 80% and 70%. We have now pulled back 70% from the .13 high. 80% would bring us back to .028.
The monthly MACD has not crossed down as yet but the PPO and PMO have. There is not much that a TA guy can hang his hat on now that the 200 day sma has broken and if the .0366 is broken it will create a lower high and lower low scenario. Therefore I think TA followers are cutting losses rather than one guy.
I am still looking at the uptrend line and the "time in the barrel" on this correction and banking on that holding, but I believe it will still be a few more months of patience before this turns if my scenario is correct. I would love to be wrong on the timing though.
Broke thr 200 day sma after bouncing off of it last week. Panic selling followed. This is what I thought would happen last week.
If .0366 breaks then we could see more of the same but RSI is under 30. Oversold.
I dont understand the Kent bashing on Twitter by some. He is not selling.
If we come down to .015 and nothing changes fundamentally, i will break a personal rule and be all in $gdvm as I will sell all my other positions.
I have followed John for years. I will match his net worth with yours any day.
This is no different then the previous 2 corrections which lasted 6 and 10 months
It is a great opportunity looking a year out, not a month out.
A stock goes up 4000% but contracts 60% and its the end of the world?
Look at the 2 year chart, not the 2 month chart.
Also John Kent's job (in his prior life) makes him very knowledgeable of the industry, which I find valuable as well.
I totally respect the time and work you put in here, and as I said before, if my current contrarian, unpopular posts upset people I am happy to go mute until things turn rainbows and unicorns again on the chart (as I perceive it).
Peace.
Lol, nah I do not like blood in the streets. I just use what I see to guide me in my decisions about where to add.
We shall see if I am correct about this consolidation lasting another three plus months. I am used to my consolidation/correction posts not being accepted well. But if I am correct we will consolidate/correct with .06-07 being resistance. I am still bullish 12 months out.
BTW I view consolidations and even blood in the streets as being overall healthy in charts that have made a 4000% run. Just as I view this 13 month bear market in the $spx as healthy after a 13 year bull market.
https://stockcharts.com/h-sc/ui?s=GDVM&p=D&yr=10&mn=3&dy=10&id=p61375109690&a=1400342989&listNum=1
The previous two corrections went sideways for months before the next leg up. We are a considerable distance from the uptrend line so I am prepared to be patient and wait it out.
I see the glass half full. No one is selling.
Most otc looks the same.
Well, i agree that it is fundamentally a choice otc company. However otc has been weak and there are some very good companies that have gotten hammered (ask Cathie Woods :)
However, tech has been a safe haven (i.e. MSFT earnings last night) so that may provide added support.
I still believe that more consolidation time is needed to digest the massive 4000% run that has taken place in 6 months. If I had unlimited funds, like someone I know ;) I would not nitpick over .005 price and just add here but prudence tells me to be satisfied with my mill for now.
Broke 200 day sma intraday but closed above it. No panic selling on the break which I had thought might happen.
If a stock goes ex-dividend ten cents a share the price opens lower by 10 cents on ex date. How much will they ex the price of HNRC tomorrow on open.