 News
News  Market Data
  Discover
Support: 888-992-3836
Copyright © 2023 InvestorsHub Inc.


Attempting to add nano-particles of (K) to bottle of bucky-ball (C)60 to make it float in air..what are you doing?
tothe
![]()
Attempting to add nano-particles of (K) to bottle of bucky-ball (C)60 to make it float in air..what are you doing?
Register for free to join our community of investors and share your ideas. You will also get access to streaming quotes, interactive charts, trades, portfolio, live options flow and more tools.
Register for free to join our community of investors and share your ideas. You will also get access to streaming quotes, interactive charts, trades, portfolio, live options flow and more tools.
Attempting to add nano-particles of (K) to bottle of bucky-ball (C)60 to make it float in air..what are you doing?
@Mrlahey1 weekly~~~ Handle should be at .07 because we have a boatload of potential profit takers from the .03's. I expect the "GDVM Q-2 Earnings Consolidation Riots" after the handle beginning in September to get us up to blue sky .13 as the OTC starts discovering us. 
https://school.stockcharts.com/doku.php?id=chart_analysis:chart_patterns:cup_with_handle_continuation
https://stockcharts.com/h-sc/ui?s=GDVM&p=W&yr=1&mn=0&dy=0&id=p34307943936&a=1105106922&listNum=2

Veemost public revenue quote began December 2021
* Veemost $75mil contract quote prior to 2021 failed JPEX merger.
https://pennystocks.today/jpex-stock-from-shell-to-billion-dollar-industry/
* Subsequent news....
https://veemost.com/investor-news/
* The latest and first "Global Developments Holdings" GDVM 10Q... unaudited, to help you with enterprise value.
https://www.otcmarkets.com/otcapi/company/financial-report/371847/content
Chart ~~~ Volume is perfect as we ride into August. Exhausted both Speculators and Longs so the only buyers today were Late Value Investors taking advantage of low volume and ridiculous low Dollar Volume.
As long as we got dependable Fuzzy Dice on the dashboard of our car: the AccumDist divergence and +20% CMF(20) are money in the bank!
this post IS NOT on my chart thread!
https://stockcharts.com/h-sc/ui?s=GDVM&p=D&yr=0&mn=5&dy=0&id=p24986097784&listNum=23&a=1113701411

GDVM chart~~~ Bullish five candle setup, need the green one tomorrow... a moderate volume nudge should do it.
But I will take anything to bust out of our Rectangle Bottom!
chart & TA post thread
https://thepatternsite.com/BullBreakaway.html
https://thepatternsite.com/rectbots.html
https://stockcharts.com/h-sc/ui?s=GDVM&p=D&yr=0&mn=5&dy=0&id=p24986097784&listNum=23&a=1113701411

@Spidaman: It should not be a problem. The unique property of the OTC Microcaps is that two years ago you could have purchased for $200 one million shares of GDVM. The early Legacy Investors (pre-loaders) hold millions of shares and most of them will engage in speculative manipulation.... I do not begrudge them on profiteering opportunity and taking advantage of GDVM being undervalued and oversold..
I agree with 07up~~~: we have to wait for NASDAQ where $200 buys 100 shares. Meanwhile we are stuck with other GDVM Investors in the OTC "brain eating amoeba swamp" playing by the rules.
 BULLISH
DLOC charts~~~ PSAR flip today. Positive bias on MOMO, TREND and VOLUME MONEY indicators.... or just follow the MA(100) on the 60min chart.
https://school.stockcharts.com/doku.php?id=technical_indicators:parabolic_sar
* Momentum~~~ RSI is in the goldilocks zone over 50.
https://investmentu.com/relative-strength-index-rsi-ultimate-overbought-oversold-indicator/
* Volume Money Indicators: OBV and AccuDist are in positive diversion with CMF Volume Money pressure over 20% all support TREND. the ADX value presently at 40%.
 * ADX Value    Trend Strength
  0-25         Absent or Weak Trend
  25-50        Strong Trend
  50-75        Very Strong Trend
  75-100       Extremely Strong Trend


GDVM charts~~~ This may be the last chance to flip again at .056 probably next week. When you start seeing doji bouncing off Rectangle Bottom supports mark a good buy signal. We should be back here for another low before August 15.... then the run North and the .056's and .03's lows will be Flipper's history.
* A brief on chart Indicators
https://investorshub.advfn.com/boards/read_msg.aspx?message_id=146368673
chart & T/A thread post
 BULLISH
* One day reversal at support level
https://thepatternsite.com/ODRB.html
* Hammer at support level
https://thepatternsite.com/Hammer.html
* Rectangle Bottom Trader's playground for two and a half months!
https://school.stockcharts.com/doku.php?id=chart_analysis:chart_patterns:rectangle_continuation
https://thepatternsite.com/rectbots.html
https://stockcharts.com/h-sc/ui?s=GDVM&p=D&yr=0&mn=4&dy=20&id=p24986097784&listNum=23&a=1113701411

10d 15min~~~ RSI will be crossing .50 also both PPO and PMO crossing signal lines. Nice setup for a green Friday.
https://stockcharts.com/c-sc/sc?s=GDVM&p=15&yr=0&mn=0&dy=10&id=p13378160109&listNum=23&a=1120870561

Good info plus IBOX candy. Added link to IBOX under "Auditors " header.
https://www.linkedin.com/in/robert-l-hymers-iii-cpa-9ba6474
GDVM ~~~ Someone tried to flip PSAR! The nerve! Especially in a consolidation where both buyers and sellers are exhausted. August 15 can't come sooner.
https://stockcharts.com/h-sc/ui?s=GDVM&p=D&yr=0&mn=4&dy=20&id=p24986097784&listNum=23&a=1113701411

GDVM chart~~~ As we wait for Q-2 and CUSIP we have dropped into a classic Rectangle Bottom twelve week continuation pattern. All minor highs and lows have been between 0.057 and 0.033 for a 0.024 spread.... a flippers dream and a core building job for our workaholic trading longs. Right now we are in a short term walk-down to test the 0.03's again for the forth time.
* The last Q-1 to get a handle on revenues and enterprise value calculator link.
https://www.otcmarkets.com/otcapi/company/financial-report/371847/content
https://developmentcorporate.com/2019/02/19/enterprise-value-calculator-for-private-companies/#:~:text=To%20estimate%20the%20revenue%20for,companies'%20examples%20of%20their%20peers.
chart thread post
BULLISH
* Rectangle Bottom
https://school.stockcharts.com/doku.php?id=chart_analysis:chart_patterns:rectangle_continuation
https://thepatternsite.com/rectbots.html
https://stockcharts.com/h-sc/ui?s=GDVM&p=D&yr=0&mn=4&dy=20&id=p24986097784&listNum=23&a=1113701411

GDVM technical~~~ With Chewy's TA. I got a feeling that after Q2 fins we will find ourselves tripping over a lot of golden crosses.
Note that early July we got the daily golden cross for 8/21 ema and 8/34 ema. Today we're almost seeing another one for 21/34 ema. Our last 3 big rejections were right around the 200 sma on the daily. a break over that will send this into clear bullish territory.
BULLISH 
Mirror trades could be a rollover into a Roth or into a Tax Free Trust like by some Parent for their kids Collage Education. Some Investors here have long horizons planned out.
Whatever is going on it is not dilution when I look at the OBV indicator on the chart.
Everyone on edge for a catalyst? I think so just looking back on yesterday's social media storm on Melvin's birthday.
GDVM chart~~~ We are in a weak trend and need at least 2mil volume a day to reach .056 to cross MA(200) plus PSAR flip. Anybody see the BB pinch last week????
The aim for us this week is to make .056 our support target by Friday. You guys put too much weight on PPS targets but it is really support we should be building a foundation on this week.
 ADX Value    Trend Strength
  0-25         Absent or Weak Trend
  25-50        Strong Trend
  50-75        Very Strong Trend
  75-100       Extremely Strong Trend

GDVM weekly chart~~~ Three and a half session week! Of note first ADX DMI cross since last August. More bullish bias: this week's candle body closed over Primary Trend MA(50) for the first time in a month. Better news is the close over the Short Term Trend EMA(13)... I hope this was not because a clever EOD paint job. 
* A brief on chart Indicators
https://investorshub.advfn.com/boards/read_msg.aspx?message_id=146368673
chart & T/A thread post
BULLISH
https://stockcharts.com/h-sc/ui?s=GDVM&p=W&yr=1&mn=0&dy=0&id=p34307943936&a=1105106922&listNum=2

6mn Daily~~~ OBV tracking over MA(50) showing more positive volume than negative because of seller exhaustion. CMF(20) over 20% volume money pressure making it's money mark bank deposit. Momentum with PPO & PMO tracking over their signal lines for a couple of weeks now.....if you guys are looking for a "fat hint out in the open" this is it.
https://stockcharts.com/h-sc/ui?s=GDVM&p=D&yr=0&mn=6&dy=0&id=p24986097784&listNum=23&a=1113701411

6d 15min~~~ We should see consolidation steps following the MA(50) because of the lack of serious sellers and their baggage of unsolicited bids giving us a buyers market.
https://stockcharts.com/c-sc/sc?s=GDVM&p=15&yr=0&mn=0&dy=6&id=p13378160109&listNum=23&a=1120870561

This six decimal places on the quote is something else.
0.046545 -0.001305 (-2.73%)
 BULLISH
GDVM 15d.30min.chart~~~ Three weeks ago we were tooling along at .035. Fourteen days ago a vertical run up followed by ten days of squeezing the barrel of sellers with minor lows sometimes reaching .035. July is coming in with a "holy crap" bang trading at .045 with MM's that have new faces!
Did someone happen to look into the Cisco website and found a VeeMost?
* search through Cisco
https://locatr.cloudapps.cisco.com/WWChannels/LOCATR/pf/index.jsp#/partner/2850602
* Veemost Partnerships
https://veemost.com/tag/cisco/
chart & TA post thread
https://stockcharts.com/c-sc/sc?s=GDVM&p=30&yr=0&mn=0&dy=15&id=p13378160109&listNum=23&a=1120870561

Consensus here on the board for target is .002. I have been holding onto .0009's since middle of June and added more .0009's last week.
GSAC chart~~~ Second retracement low is 70% ($0.0007) reached this week on third consolidation step in two months. Momentum is positive although we just had a negative PSAR flip. I doubt we have a MA 50/100 cross next week in four trading sessions. Imagine a "barrel roll" next week churning with active buyers and exhausted sellers on the MA50 road North.
chart & TA post thread
https://stockcharts.com/h-sc/ui?s=gsac&p=D&yr=0&mn=4&dy=0&id=p24986097784&listNum=23&a=1113701411

GSAC charts~~~ Two bullish patterns in last four months where the first two months panic selling settled into two reversal patterns. The last two months show three valleys of higher lows.
https://thepatternsite.com/3rv.html
https://thepatternsite.com/udb.html
https://school.stockcharts.com/doku.php?id=chart_analysis:chart_patterns:double_bottom_reversal
* A brief on chart Indicators
https://investorshub.advfn.com/boards/read_msg.aspx?message_id=146368673
* Monday's AI Deep Forecast post... and the sellers should be exhausted by now so we should start serious accumulation.
https://investorshub.advfn.com/boards/read_msg.aspx?message_id=172211684
chart & T/A thread post
https://stockcharts.com/h-sc/ui?s=gsac&p=D&yr=0&mn=4&dy=0&id=p24986097784&listNum=23&a=1113701411

https://stockcharts.com/h-sc/ui?s=GSAC&p=30&yr=0&mn=0&dy=15&id=p24986097784&listNum=23&a=1113701411

ILUS ***institutional holdings,.Insider Holders.& Insider.Ownership, trading***
https://www.secform4.com/insider-holders/1496383.html
chart & TA post thread
https://stockcharts.com/h-sc/ui?s=ILUS&p=D&yr=0&mn=4&dy=0&id=p24986097784&listNum=23&a=1113701411

@Janet; Added link to Info Box (IBOX) tagged "GSAC Insider Trading Activity" under Share Structure header.
https://www.secform4.com/insider-trading/890725.htm
@Stalker; +chart~~~ .0009 is good today because there were a lot of profit takers embedded in the four days of 670mil volume last week.
https://stockcharts.com/h-sc/ui?s=GSAC&p=W&yr=0&mn=11&dy=25&id=p34307943936&a=1105106922&listNum=2

GSAC chart~~~ Two bullish candlestick patterns today. The week of June 12 we had two sets of these in five days!
https://thepatternsite.com/MatchingLow.html
https://thepatternsite.com/TweezersBottom.html
* A brief on chart Indicators
https://investorshub.advfn.com/boards/read_msg.aspx?message_id=146368673
chart & T/A thread post
Technical EMA 8 -34 chart~~~ Try not to get too excited by the positive diversions of OBV and AccumDist are happening in a consolidation (seller flush) and retracement low just after a speculative run up.
* Trix
https://school.stockcharts.com/doku.php?id=technical_indicators:trix
https://stockcharts.com/h-sc/ui?s=GSAC&p=D&yr=0&mn=3&dy=0&i=p6680853606c&a=639143585&r=1548554336877

GSAC chart~~~ Two months with two Vertical Runs and one Double Bottom.
* First run up from .0002 to .0012 retrace to .0005 or 62%
Second run up from .0005 to .0017 retrace to .0008 or 70%
https://thepatternsite.com/VerticalRunUp.html
* Ugly Double Bottom in throwback to .0008
https://thepatternsite.com/udb.html
https://school.stockcharts.com/doku.php?id=chart_analysis:chart_patterns:double_bottom_reversal
chart & TA post thread
https://stockcharts.com/h-sc/ui?s=GSAC&p=D&yr=0&mn=3&dy=0&id=p24986097784&listNum=23&a=1113701411

@North; Good call on Fibs. The .0012 retrace was 62%, now the .0017 retrace is at 70%.
I picked up .0009's yesterday to be on the safe (North) side of 62%.
@Stalker +chart~~~ One wimpy sell in the first 15 minutes is not exactly a strong case for S2.
Buyers will not risk spilling their first cup of coffee of the day on their laptop!
https://stockcharts.com/c-sc/sc?s=GSAC&p=2&yr=0&mn=0&dy=1&id=p69741074503&a=1100650802&listNum=23

GSAC charts~~~ Ugly Double Bottom setup: yes, they do outperform the pretty ones.
Yes, the next leg up is more explosive, possibly leading to a gap up and throwback to fill it.
https://thepatternsite.com/udb.html
https://thepatternsite.com/ugly.html
https://school.stockcharts.com/doku.php?id=chart_analysis:chart_patterns:double_bottom_reversal
chart & TA post thread
https://stockcharts.com/h-sc/ui?s=gsac&p=D&yr=0&mn=4&dy=0&id=p24986097784&listNum=23&a=1113701411

15d 30min~~~ for closer development & decision making. Oh, sellers appear to be exhausted so now we are left with "now you see it and now you don't" technical bid/ask stacking.
https://stockcharts.com/h-sc/ui?s=GSAC&p=30&yr=0&mn=0&dy=15&id=p24986097784&listNum=23&a=1113701411

@Stalker +chart~~~; Agree. $0.0009 support puts us back to last Tuesday. The sellers were carless with market orders giving us a 23% erosion of the PPS. Suspect we saw small retail today who were buyers from two weeks ago at $0.0007 dumping for meager profits, a seller flush encouraged by buyers who casually stack the low bids. No problem, nothing we haven't seen before in the OTC swamp, we got five trading sessions to get back to $0.0012.
* Sorry for the late response I had to watch the grandkids today.
 BULLISH
https://stockcharts.com/h-sc/ui?s=GSAC&p=30&yr=0&mn=0&dy=10&id=p24986097784&listNum=23&a=1113701411

GSAC charts~~~ Good set up for next week, TA is with the charts.
https://school.stockcharts.com/doku.php?id=technical_indicators:on_balance_volume_obv
https://school.stockcharts.com/doku.php?id=technical_indicators:chaikin_money_flow_cmf
* A brief on chart Indicators
https://investorshub.advfn.com/boards/read_msg.aspx?message_id=146368673
chart & T/A thread post
10dy 30min~~~ Bullish shakeout with $0.0012 strong base for support next week.
* Short term bullish bias setting up with OBV diversion, CMF(60) the six day look back, PPO & PMO approaching signal line crossover.
https://stockcharts.com/h-sc/ui?s=GSAC&p=30&yr=0&mn=0&dy=10&id=p24986097784&listNum=23&a=1113701411

Daily ~~~ Second candle body over MA(200) or $0.0011. Powerful OBV diversion with CMF(60) agreeing. PPO & PMO signal lines crossed last week. You guys who are rabid RSI and MACD followers try not to freak out.
* Candlestick pattern continuation bias..
https://thepatternsite.com/8NewPriceLines.html
https://stockcharts.com/h-sc/ui?s=GSAC&p=D&yr=0&mn=3&dy=0&id=p24986097784&listNum=23&a=1113701411

@Burd; Thanks everyone. You guys did tremendous protection on $0.0012 support today. I do not subscribe to Level2 because I think it is a gateway drug to video games. However with my Fidelity account I can see dynamic bid-ask swapping between .0011 and .0013 sometimes as high as 6mil shares jumping between the two! Then during power hour there was some serious calls on these bluffs.... I think you guys are dangerous Poker Players!
GSAC weekly.chart~~~ Two bullish patterns for May.&.June..
* May 8 & 15 : Weekly Upside Reversal and we are still in it.
https://thepatternsite.com/WeeklyRevsUpside.html
* June 15 Open Close Reversal Downtrend two week retrace and resuming the upside.
https://thepatternsite.com/OCRD.html
chart &TA post thread
https://stockcharts.com/h-sc/ui?s=GSAC&p=W&yr=0&mn=11&dy=25&id=p34307943936&a=1105106922&listNum=2

GSAC chart~~~ Reminder we have completed three sessions of a four session week. We have packed a lot of volume in these last three days. Note that today's candle body (gravestone doji) closes over the MA(200).
* We satisfy this pattern because of + $0.0001 (8.70%) close gives us bullish bias to a continuation pattern.
https://thepatternsite.com/ShootingStar2.html
* This pattern needs a green candle tomorrow for a continuation.
https://thepatternsite.com/8NewPriceLines.html
  ADX Value    Trend Strength
   0-25         Absent or Weak Trend
   25-50        Strong Trend
   50-75        Very Strong Trend
   75-100       Extremely Strong Trend


@Stalker; I invite everyone to borrow the charts, that's why I keep links with the chart. I have "live" charts in the INFO box that I am currently constructing.
I use 'Microsoft Paint' for annotation. StockCharts keeps my charts because of heavy usage for their promotions. I do not have a StockCharts account currently, the chart templates you see are about two years old.
@BERKSHIRE; I keep projected valuation with the relative value of the current PPO crossover to the last major crossover of June 2022. During the past year there was small 64mil dilutive eguity financing. It is like saying the speed of light is constant but you have blue and red shifts corresponding to buy-back or dilution.... so PPO signal line crossovers are the closest thing we have to relativistic calculation.
Use the 1yr. 1m. chart to see the $0.002- $0.004's of June 2022 and follow the horizontal line that utilizes time telescoping back to the big bang.
https://school.stockcharts.com/doku.php?id=technical_indicators:price_oscillators_ppo
https://stockcharts.com/h-sc/ui?s=GSAC&p=D&yr=1&mn=1&dy=0&id=p24986097784&listNum=23&a=1113701411

A Trader (or Master of Fake Volume) doing ETF trades on his dual platform(s) and/or with different brokerages. This has been going on for years and makes the OTC casino the 'Speculators Paradise' with all those Unsolicited Bids flying around like confetti.
GSAC chart~~~ Today's $0.001 resistance flipped to support.
* RSI goldilocks and Williams%R agreeing over 50%
https://investmentu.com/relative-strength-index-rsi-ultimate-overbought-oversold-indicator/
* CMF(20) volume money pressure over 20% again and agreeing MFI the RSI of volume money
* OBV diverting up from AccumDist showing free trading float seriously winding up.
* ChiOsc the MACD of AccumDist line showing buyers outnumbering sellers/
* A brief on chart Indicators
https://investorshub.advfn.com/boards/read_msg.aspx?message_id=146368673
chart & T/A Post Thread
https://stockcharts.com/h-sc/ui?s=GSAC&p=D&yr=0&mn=5&dy=0&id=p24986097784&listNum=23&a=1113701411

Weekly volume turbulence watch
https://stockcharts.com/h-sc/ui?s=GSAC&p=W&yr=1&mn=0&dy=0&id=p34307943936&a=1105106922&listNum=2

@Gail; The compound chart is used for modest gains on the higher exchanges and the OTC. The indicators are plug-in values used in most common algorithms found on the internet. The chart forces us to use "wetware'' rather than someone's software in decision making.
* A brief on chart Indicators
https://investorshub.advfn.com/boards/read_msg.aspx?message_id=146368673
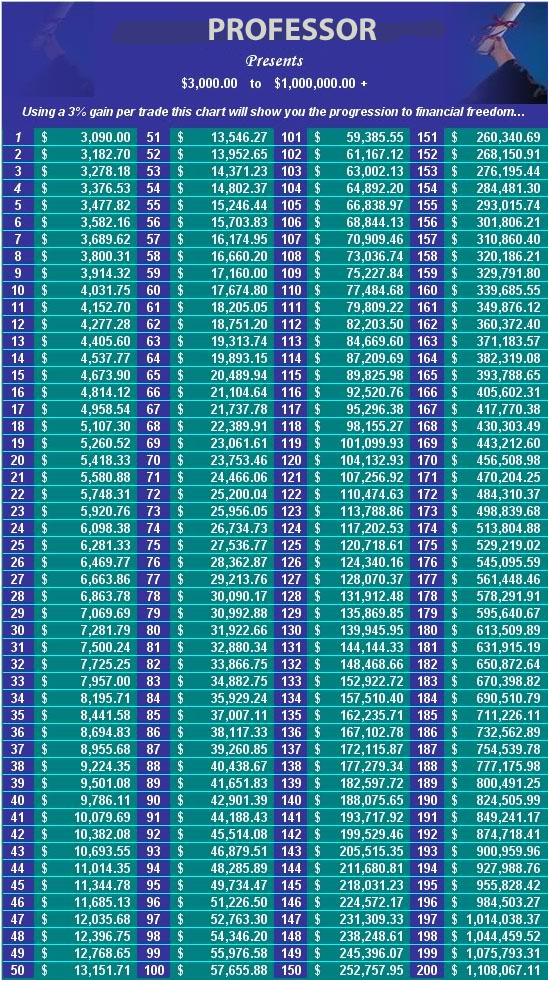
Compounding
The main focus here is to compound our gains. Too many people enter the stock market with the intent of trying to hit a home run. Swinging for the fences also gives you a high strike out ratio. It is important to compound your gains and go for the singles and doubles and you will find that you eventually hit triples and home runs as well. The chart below shows how you can turn only 3k into 1 million dollars in 200 steps. So join me in moving up the steps of our compounding gains chart. Compound those gains!
https://investorshub.advfn.com/boards/read_msg.aspx?message_id=125078854
GSAC compound chart~~~ AROON8 up from zero (\0/) was the first indicator signal, the others a day later.
chart thread post
Compound Chart
#1. AROON- 8 You watch as the AROON DOWN crosses the 75 down and the AROON UP comes up from zero. Most important. (\0/)
#2. WILLIAMS%R- 9 You watch the line cross the 50.
#3. CMF- 15 You will usually only see growth when the CMF is in the negative.
#4. ADX/DMI-5 You watch as the D+ line either crosses the D-, or crosses above the 20.
#5. MACD histogram- 5,15,10 You watch the negative bars register -50% smaller then the bar before it, or -50% smaller then the largest in the grouping.
#6. Full Stoch- 5,3 You watch the fast line cross the slow line while the AROON DOWN(8) crosses the 87.50. Crossing the 20 would be best, when the Williams agrees.
#7. Bollinger Band 20,2 You watch for the Magic Box to occur when the negative close touches above the lower bolly and the next day’s close to it is positive growth in a white candle.
#8. RSI 5 you watch as the indicator crosses above the 50 for a quick pop.
#9. MA(2) Watch the 2 day MA cross above the 5 day MA. That’s helpful.
#10. MA(2) To sell it just watch the 2 day MA kiss the bottom center of the red candle body.
https://stockcharts.com/h-sc/ui?s=GSAC&p=D&yr=0&mn=3&dy=0&id=p29397895492&listNum=23&a=1093863074

THE MAGIC BOX
(A) The Magic Box is a pure two-day pattern. Basically the "close" of a red candle printing on or near lower Bollinger Band with the next day printing an "open white candle."
A gift from The Seasonality Stock Reports Board
The reason that I named this setup the Magic Box was so that you could relate to it and remember it faster. Without relationship to something, it is nothing to us. It must be something memorable to you before you can set it into your subconscious mind and see it always.
(A1) On day one the Aroon Down is setting at 100 on the indicator and price is near the lower Bollinger Band. The Candlestick is dark-shadowed.
(A2) On day two, to form the Magic Box, the Aroon Down must drop to 87.50, and price to form a white candle, to complete the box. No other indicator is watched until this occurs for this setup, just the Bollinger Band and the Aroon Down.
If you see a Magic Box develop, that being, on the first day the Aroon Down going from 100.00 while the close is either on or just above the lower Bollinger Band and the second day the Aroon Down is now 87.50, you have a Magic Box.
(B) The buy opportunity occurs when the confirmation of two things happens: on day three or few days later the Aroon Down goes to 75.00 and the Williams%R comes above the -50%. That is the buy. The Williams must come through the -50%. It may take more than three days but you must wait for the confirmation of the William%R. I have seen again and again, the Aroon Down come down from 100.00 to zero without the Williams ever crossing the -50%, those are the ones you pass on. There will be no growth when this happens. At most there is consolidation or a small drop. During this process the Aroon Up can rise slowly but without the Williams you have nothing.
There are other Magic Boxes that develop in a stock's life cycle, too, and they, too, can give great growth. These are the supported median, the floating, and the rising Magic Boxes. The buy-in criteria, though, will remain the same for all of them. The Aroon Down comes to the 75.00 and the Williams crosses the -50%. June 7th, 8th, and 9th accomplish this in the 2007 HGR chart, though the William%R took until June 13th to confirm. You must wait.
Trading: It is highly recommended that you paper trade the system to familiarize yourself with it thoroughly. As with anything in life nothing is guaranteed, so, always use appropriate stop loss according to your risk tolerance.
Kenneth J. Goodrich
http://investorshub.advfn.com/SEASONALITY-STOCK-REPORTS-1616/
Example
http://investorshub.advfn.com/boards/read_msg.aspx?message_id=37119243
Sell trigger
https://investorshub.advfn.com/boards/replies.aspx?msg=40130527
Buyers are doing a good job picking up on the wash. The profit takers are holding cores of free shares so there really is no complete dump and the only "pump" today was my bullish chart. I followed (stalked) Dasqeezr to the chat room today and liked what I saw.
200mil volume !?
https://stockcharts.com/h-sc/ui?s=Gsac&p=D&yr=0&mn=4&dy=0&id=p24986097784&listNum=23&a=1113701411


