 News
News  Market Data
  Discover
Support: 888-992-3836
Copyright © 2023 InvestorsHub Inc.


Register for free to join our community of investors and share your ideas. You will also get access to streaming quotes, interactive charts, trades, portfolio, live options flow and more tools.
Bernanke's Former Advisor: "People Would Be Stunned To Know The Extent To Which The Fed Is Privately Owned"
April 12, 2016
With every passing day, the Fed is slowly but surely losing the game.
Only it is not just former (and in some cases current) Fed presidents admitting central banks are increasingly powerless to boost the global economy, even if they still have sway over capital markets. What is far more insidious to the Fed's waning credibility is when former economists affiliated with the Fed start repeating mantras that until recently were only a prominent feature in the so-called fringe media.
This is precisely what happened today when former central bank staffer and Dartmouth College economics professor Andrew Levin, special adviser to then Fed Chairman Ben Bernanke between 2010 to 2012, joined with an activist group to argue for overhauls at the central bank that they say would distance it from Wall Street and make its activities more transparent and accountable to the public.
Levin is pressing for the overhaul with Fed Up coalition activists. Many of the proposed changes target the 12 regional Federal Reserve Banks, which are quasi-private and technically owned by commercial banks in their respective districts.
All of that is not surprising. What he said to justify his new found cause, however, is.
"A lot of people would be stunned to know” the extent to which the Federal Reserve is privately owned, Mr. Levin said. The Fed “should be a fully public institution just like every other central bank” in the developed world, he said in a conference call announcing the plan. He described his proposals as "sensible, pragmatic and nonpartisan."
Why is that stunning? Because it has long been a bone of contention if only among the fringe media, that at its core the Fed is merely a private institution, beholden only to its de facto owners: not the people of the U.S. but to a small cabal of banks. Worse, the actual org chart of who owns what is not disclosed, even as the vast majority of the U.S. population remains deluded that the Fed is a publicly owned institution.
As the WSJ goes on to note, the former central bank staffer said he sees his ideas as designed to maintain the virtues the central bank already brings to the table. They aren’t targeted at changing how policy is conducted today. “What’s important here is that reform to the Federal Reserve can last for 100 years, not just the near term,” he said.
And this is coming from a former Fed employee and Ben Bernanke's personal advisor! That in itself is a most striking development, because now that the insiders are finally speaking up, it will be a race among both current and prior Fed workers to reveal as much dirty laundry as possible ahead of what is increasingly being perceived by many as the Fed's demise.
To be sure, Levin's personal campaign for Fed transformation will not be easy, and as the WSJ writes, what is being sought by Mr. Levin and the activists is significant and would require congressional action. Ady Barkan, who leads the Fed Up campaign, said the Fed’s current structure “is an embarrassment to America” and Fed leaders haven’t been “willing or able” to make changes.
Specifically, Levin wants the 12 regional Fed banks to be brought fully into the government. He also wants the process of selecting new bank presidents—they are key regulators and contributors in setting interest-rate policy—opened up more fully to public input, as well as term limits for Fed officials.
This would represent a revolution to the internal staffing of the Fed, which will no longer be at the mercy of its now-defunct shareholders, America's commercial banks; it would also mean that Goldman Sachs would lose all its leverage as the world's biggest central bank incubator, a revolving door relationship which has allowed the Manhattan firm to dominate the world of finance for the decades.
Levin’s proposal was made in conjunction with the Center for Popular Democracy’s Fed Up coalition, a group that has been pressuring the central bank for more accountability for some time. The left-leaning group has been critical of the structure of the regional banks, and has been pressing the Fed to hold off on raising rates in a bid to make sure the recovery is enjoyed not just by the wealthy, in their view.
The proposal was revealed on a conference call that also included a representative from Bernie Sanders’s presidential campaign, although all campaigns were invited to participate.
The WSJ adds that according to Levin, who knows the Fed's operating structure intimately, says the members of the regional Fed bank boards of directors, the majority of whom are selected by the private banks with the approval of the Washington-based governors, should be chosen differently. The professor says director slots now reserved for financial professionals regulated by the Fed should be eliminated, and that directors who oversee and advise the regional banks should be selected in a public process involving the Washington governors and local elected officials. These directors also should better represent the diversity of the U.S.
Levin also wants formal public input into the selection of new bank presidents, with candidates’ names known publicly and a process that allows for public comment in a way that doesn’t now exist. The professor also wants all Fed officials to serve for single seven-year terms, which would give them the needed distance from the political process while eliminating situations where some policy makers stay at the bank for decades. Alan Greenspan, for example, was Fed chairman from 1987 to 2006.
As the WSJ conveniently adds, the selection of regional bank presidents has become a hot-button issue. Currently, the leaders of the New York, Philadelphia, Dallas and Minneapolis Fed banks are helmed by men who formerly worked for or had close connections to investment bank Goldman Sachs.
Levin called for watchdog agency the Government Accountability Office to annually review and report on Fed operations, including the regional Fed banks. He also wants the regional Fed banks to be covered under the Freedom of Information Act. A regular annual review hopefully would insulate the effort from perceptions of political interference, Mr. Levin said.
* * *
While ending the Fed may still seem like a pipe dream, at least until the market's next major crash at which point the population may finally turn on the culprit behind America's serial boom-bust culture, the U.S. central bank, Levin's proposal would get to the heart of the most insidious conflict of interest in the US: the fact that the Federal Reserve works not for the people of America, but for its owners - the banks.
Which is also why, sadly, this proposal will be dead on arrival, as its passage would represent the biggest loss for Wall Street in the past 103 years, far more significant than anything Dodd-Frank could hope to accomplish.
http://www.zerohedge.com/news/2016-04-11/bernankes-former-advisor-people-would-be-stunned-know-extent-which-fed-privately-own
The ‘Data Dependent’ Fed Blows Its Cover… Annihilates Its Credibility
by Wall Street Journal
March 18, 2016
Normal is a lot harder than it looks.
The Federal Reserve on Wednesday not only refrained from raising interest rates, but it telegraphed that it would almost certainly raise rates at an even slower pace than it previously expected. This is a break from its outlook of just three months ago, when it raised its benchmark rate at the December meeting and laid out the path for the awkwardly phrased “policy normalization.”
The Fed has been talking about normalizing rates for several years now, so it’s rather jarring that just a few months after it starts doing just that, it handcuffs its own policy. Even more odd is that the data back up its original goals. All of this gives a short-term boost to the risk-on set, but it is unsettling to anybody who’s time-frame is not measured in nanoseconds.
In December, the Fed concluded that the economy was largely headed in the right direction, that the twin mandate of maximizing employment and stable prices were being met. The bank also clearly stated that it understood that policy works with a time lag, and that in order to get prices and jobs good and maximized, it needed to act then, knowing those higher rates would take some months to work their way through the system.
All that disappeared yesterday, as the Fed quickly reversed field. “It was as if a light bulb went off,” UBS’ Art Cashin wrote. The four rate hikes the Fed had been planning on for this year suddenly became two.
The practical result of all this can been seen in the U.S. dollar this morning. The dollar is down 1% against the euro and 1.2% against the yen. The WSJ Dollar Index is down 1%. “No matter where you turn, U.S. dollar charts are ‘puking,’ ” said DailyFX currency analyst Christopher Vecchio. “Most everyone was on one side of the trade, and now everyone is rushing for the exits at the same time.”
The dollar selloff started, in fact, with the first question asked of Ms. Yellen at Wednesday’s press conference. CNBC’s Steve Liesman asked if the Fed now had a credibility problem, after reversing itself so quickly. Ms. Yellen of course answered no, but the market seems to feel different. “At that point,” Dennis Gartman wrote in his daily newsletter, “the dollar was doomed. It remains ‘doomed’ thus far this morning and it may worsen we fear.”
Why does the Fed have a credibility problem?
Because it has been arguing for months, years, that it is being guided by data – by U.S. data – but yesterday’s decision simply does not comport with the data. Unemployment is at 4.9%. Inflation is rising – the year-over-year “core” CPI reported on Wednesday morning came in at 2.3%. We understand that isn’t the Fed’s “preferred” gauge, but it is also not an entirely ignored gauge either. More importantly, in the three months since the Fed’s December meeting, both of these measures have further strengthened.
If you’re in the camp that thinks the odds of a recession are material if not overwhelming, then the Fed stepped back from a potentially obvious policy mistake: raising rates too soon. This is something that the Fed rather infamously did all the way back in 1937, and critics have never let them forget it. Indeed, we’ve been seeing references to 1937 for years. Here’s Bruce Bartlett writing in the New York Times on the topic in 2011. Here’s Christina Romer writing in the Economist on the topic – in 2009.
There is, however, nothing in the data that signal an imminent recession. There just isn’t. You can make all the arguments you want that point to the fallibility of the data – we do all the time – but if you’re telling the world over and over that you are “data dependent” and then you stop depending upon the data, you can see how that might confuse a few folks. What exactly is the Fed looking at now, if not the data? “The Fed’s goal is now a perfect world,” Lindsey Group’s Peter Boockvar wrote. “As we of course will never get there, the rest of us are left flying blind as to what to expect from monetary policy.”
If the data are right and the Fed is dragging its feet, that could still result in a policy mistake. Indeed, Ms. Yellen was asked if the Fed is intentionally letting inflation overshoot the target. The Fed’s credibility problem will either be amplified if the economy doesn’t behave, or vaporized if it does. The ultimate arbiter will be reality.
http://davidstockmanscontracorner.com/the-data-dependent-fed-blows-its-cover-annihilates-its-credibility/
9 Signs That 2016 Looks Ominously Like 2008 (Just Before The Crisis)
by Simon Black via SovereignMan.com
March 17, 2016
If you haven’t seen the 2015 Best Picture nominee, The Big Short, I strongly recommend it.
The Big Short is based on Michael Lewis’ book which examines how such an extraordinary financial crisis gripped the world in 2008, and the handful of people who saw it coming.
The movie opens asking a very simple question about the global financial meltdown:
Wall Street missed it; the Federal Reserve missed it; the government missed it; every major financial institution missed it; the homebuilders missed it.
So how is it that a handful of people were able to see it coming? How could they see what nobody else saw?
Easy. They looked.
For anyone who actually looked, it was obvious that the banking and housing boom in the early 2000s was built on a house of cards. The data was all there.
Given the financial establishment’s astonishingly short-term memory and capacity to make even bigger mistakes than ever before, we now find ourselves in a very similar position today.
Once again, the financial system is in desperate condition. And the data is all there for anyone who cares to look.
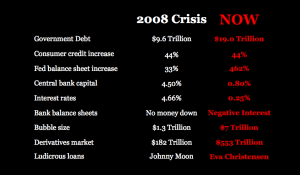
Let’s look at a few of the numbers together.
Back in 2008, much of the calamity was caused by an implosion of “subprime loans” in the housing market.
These were frequently no-money down loans at teaser interest rates made to people with poor credit and limited income.
Banks made these toxic loans with your money.
The best example of this was probably Johnny Moon, a homeless man with no income or employment history who was able to borrow more than $600,000 to speculate in real estate.
The total value of these subprime loans was a whopping $1.3 trillion.
Not much has changed.
In 2016, instead of loaning money to subprime home buyers, the financial system is now loaning money to bankrupt governments.
They’ve even managed to go beyond “no-money down”, and are actually paying governments to borrow money at negative interest rates.
Japan is as great example.
Even though Japan’s national debt exceeds 200% of GDP, and it takes over 25% of tax revenue just to pay interest on the debt, the Japanese government is able to borrow money for ten years at negative interest.
This means that investors are GUARANTEED to lose money. It’s worse than no money down. And it’s total madness.
The bigger issue is that the size of this bubble is an astounding $7 trillion, far bigger than the subprime bubble in 2008. And it grows larger by the day.
To expect that this will turn out any differently is foolish.
Back in 2008, US government debt was “only” $9.5 trillion. The Federal Reserve’s balance sheet was $850 billion. Interest rates were over 4%.
So at least they had some capacity to slash interest rates and fight the crisis using traditional policy tools.
Today, US government debt exceeds $19 trillion, well in excess of 100% of GDP.
They have to borrow money just to pay interest, and they have entire pension funds that are on the brink of bankruptcy.
The Federal Reserve’s balance sheet has exploded to $4.5 trillion, and interest rates are barely above zero.
The government has no means to bail anyone out, including itself. And the Fed has no capacity to print more money and expand its balance sheet without causing a major currency crisis.
Simply put, the bubble is just as insane as in 2008, but much bigger. And the financial establishment has no ammunition to fight it.
If you want a more detailed comparison of the 9 most ominous similarities between 2008 and 2016 click here to watch today’s video podcast.
https://www.sovereignman.com/sm-presentation/?utm_source=sm_prospects&utm_medium=website&utm_campaign=egw_webinar&utm_content=email_notes_160317
Why The Fed Is Paralyzed - Its Economic Model Is Junk
Jeffrey Snider via Alhambra Investment Partners
March 17, 2016
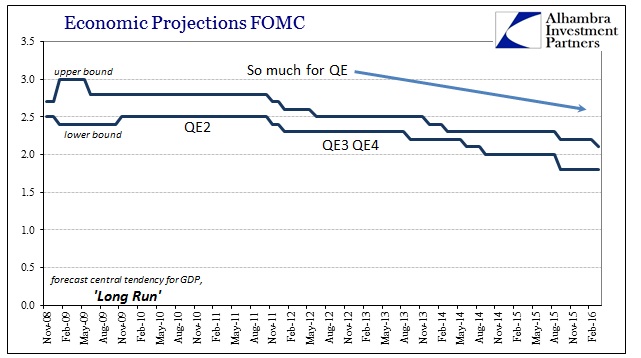
If there is any doubt as to the confusion inside the FOMC, one needs only to examine its models. The latest updated projections make a full mockery of both monetary policy and the theory that guides it. Ferbus and the rest don’t buy the labor market story, either, which is why the Fed can only be hesitant at best about “normalization.” Coming from the (neo or not) Keynesian persuasion, what is showing up should never happen.
The theoretical notion of recovery is very straightforward in orthodox economics. In recession, the economy starts with high unemployment and therefore low inflation. Using the Phillips Curve as a short-term guide, orthodox models assume that as levels of unemployment begin to normalize, output (GDP) will rise. That will occur first without any uptick in inflation as the “slack” produced by the recession keeps price pressures to a minimum.
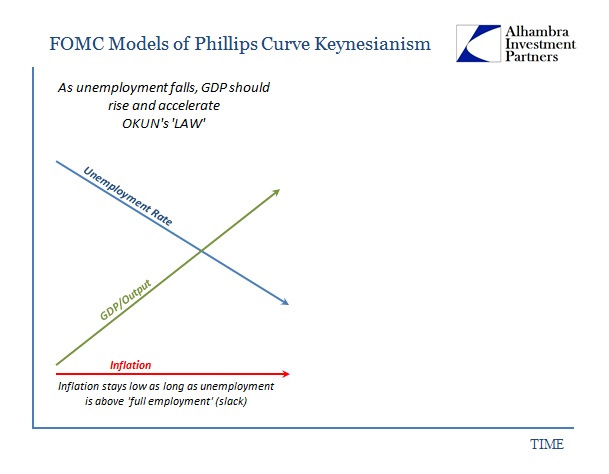
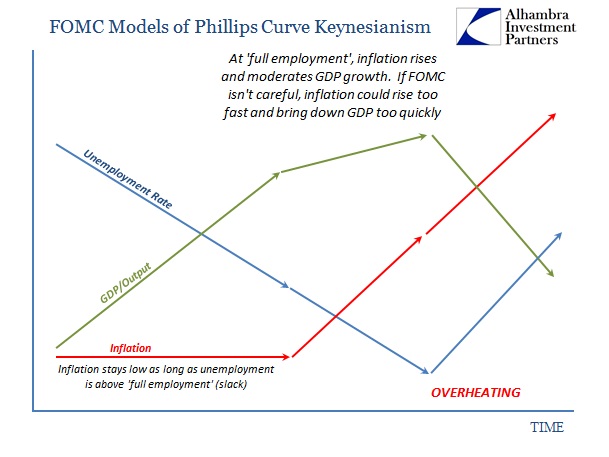
In Stage 1 everything is easy, so long as you can gain forward momentum in unemployment or output (which is what the QE’s were supposed to accomplish with regard to theoretical notions of hysteresis). Stage 2 gets slightly more complicated as the economy nears or reaches “full employment.” At that point, inflation should start to rise which will moderate output growth. If it progresses too far, that means the economy has reached “overheating” whereby inflation gets out of control and actively suppresses output, even reversing employment gains.
By the simple act of communicating a rate hike in December (though not actually carrying it out in meaningful fashion), the FOMC proclaimed closeness to overheating. But there is a huge problem with not just observed conditions but also projected economic conditions for the immediate future. If the economy and recovery has progressed sufficiently through Stage 2 to demand policy action before overheating, we should see a concurrent rise in inflation as well as output. The FOMC estimates show no such thing; worse, they estimate the opposite for especially inflation, as modeled GDP projections continue to muddle. That was true for not just CY 2015 as it was completed in full disappointment, but now encompassing CY 2016 as well.
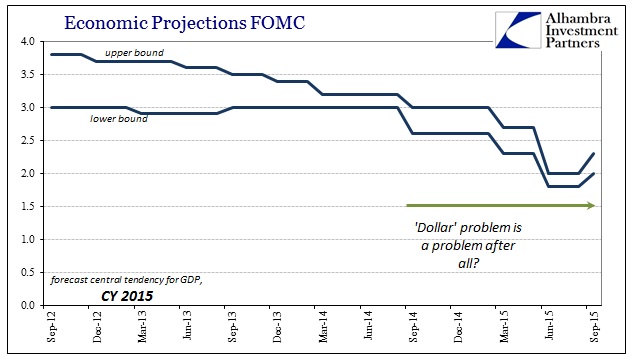
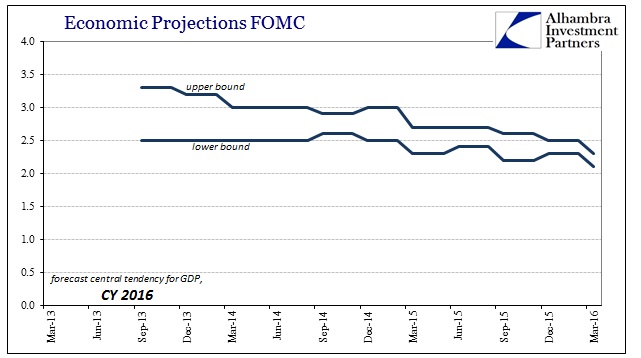
Both years start out in the earliest projections as they should according to theory, or close enough to be plausible; GDP should accelerate to at least something significantly better than the deficient output expansion of the recent past. Instead, as time rolls forward, that acceleration never materializes as GDP has stagnated around 2% year after year. The March 2016 projections show yet again another year absent acceleration in output (losing track of how many years in a row that would make).
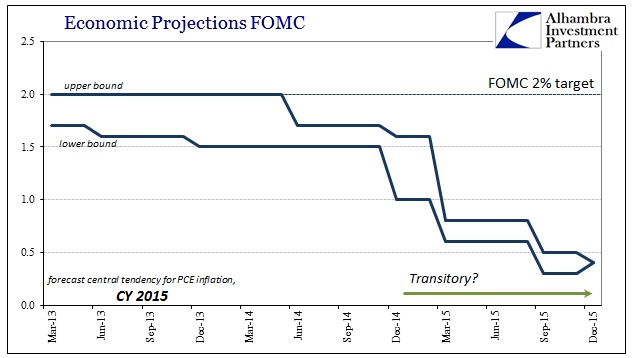
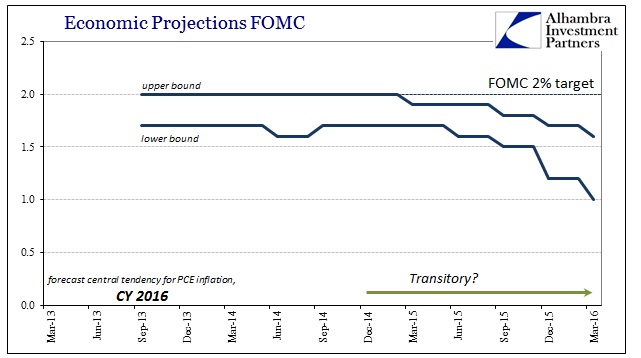
In terms of inflation, the trends are even worse. When oil prices first crashed in late 2014/early 2015 that was demanded to be “transitory” uniformly across both models and orthodox interpretations (redundant, I know). A year later, not only did inflation never materialize for the rest of 2015, it is now modeled to be increasingly absent in 2016, as well.
That’s a huge problem because the unemployment rate only gets better and better at each forecast. Back in late 2013 as the sounds of taper grew louder, the FOMC’s staff models projected the unemployment rate in 2016 would only be 5.4% to 5.9% (central tendency). That was forecast as a relatively slow improvement because output growth had been so lacking to that point, and even though it was expected to accelerate it was never thought to attain true recovery mechanics (something more like 4-5% rather than 3-3.5%). Instead, as noted above, GDP growth never accelerated at all – but the unemployment rate fell far faster than orthodox theory predicted anyway. In fact, so fast it asserts a major problem somewhere because Okun’s Law suggests GDP should have been, given the unemployment rate improvement, not just higher than 2.1% to 2.3% but higher than even the 3.3% once thought the upper bound back in 2013.
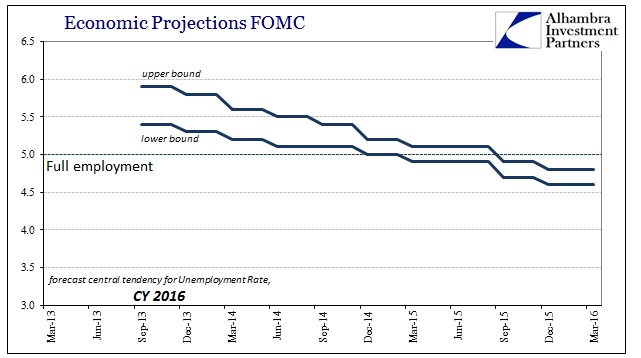
In other words, in late 2013 the models suggested relatively modest GDP of 2.5% to 3.3% in 2016 which would bring unemployment down also modestly to 5.4% and perhaps as high as 5.9%. That progress was supposed to be closing in on full employment enough to propel inflation very close to the 2% target for the PCE deflator. Instead, as of the March 2016 projections, the unemployment rate is expected to be enormously lower at just 4.6% to 4.8%, but GDP still stuck (and being downgraded each quarter) at 2.1% to 2.3% while inflation at the lower bound of the central tendency is 1%? One of these factors really doesn’t add up even in this orthodox context.
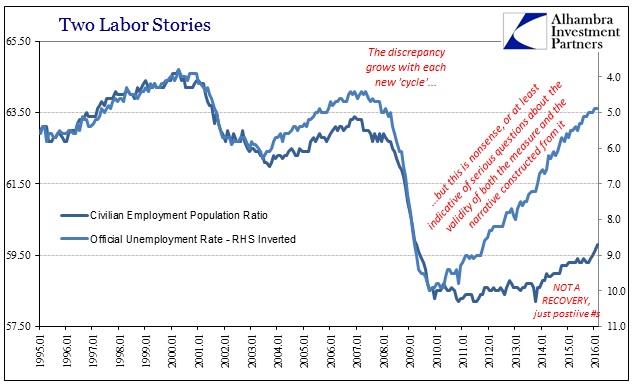
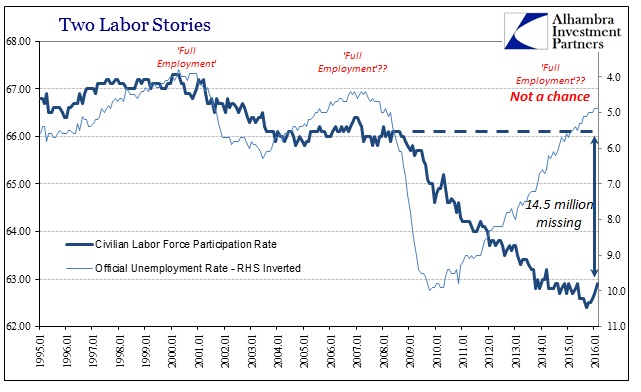
It isn’t difficult to determine which one, as persistently low calculated “inflation” is fully consistent with insufficient economic growth (or worse) for the nth year in a row. It is the huge and unexpected improvement in the unemployment rate blowing right on past “full employment” almost two years faster than predicted that is completely out of line; this “best jobs market in decades” that doesn’t project beyond really questionable BLS statistics.
As if to emphasize this statistical struggle against orthodox theory, the models are “forced” by the inequity between reported unemployment and the continuing disagreement via output and inflation to reduce to the long run growth rate estimate in order to make 2.2% growth seem like it could possibly belong in Stage 2 as if it were acceleration.
That means the unemployment rate is so far out of whack that the FOMC, a committee dedicated to believing in it above all else, really cannot base monetary policy on the most basic Keynesian, Phillips Curve assumptions. In fact, by count of even orthodox theory, the unemployment rate cannot be real. It doesn’t take much survey outside of these three variables to confirm the suspicion. As much as policymakers want it to be meaningful and representative, the fact that their own models not only fail to confirm it but openly refute it (with emphasis) is why Janet Yellen is slow on the rate hikes even though she talks about the jobs market at every opportunity (as if the unemployment rate as merely a number were, rational expectations, itself a stimulant that QE never was or could be).
It was the best jobs market in decades that once again finds nobody actually in it; not even the economists.
http://www.zerohedge.com/news/2016-03-17/why-fed-paralyzed-its-economic-model-junk
World’s Second Largest Reinsurer Buys Gold, Hoards Cash To Counter Negative Interest Rates
March 17, 2016
The world’s second-largest reinsurer, German Munich Re which is roughly twice the size of Berkshire Hathaway Re, is boosting its gold reserves and buying gold in the face of the punishing negative interest rates from the European Central Bank, it announced today.
As caught by Mark O'Byrne at GoldCore and reported by Thomson Reuters this afternoon, the world’s largest reinsurer is far from alone in seeking alternative investment strategies to counter the near-zero or negative interest rates that reduce the income insurers require to pay out on policies.
Munich Re has held gold in its coffers for some time and recently added a cash sum in the two-digit million euros, Chief Executive Nikolaus von Bomhard told a news conference.
“We are just trying it out, but you can see how serious the situation is,” von Bomhard said.
The ECB last week cut its main interest rate to zero and dropped the rate on its deposit facility to -0.4 percent from -0.3 percent, increasing the amount banks are charged to deposit funds with the central bank.
Munich Re is one of the largest reinsurance companies in the world - It oversees €231 billion in investments. A small 3% allocation to gold would equate to buying gold worth €8.19 billion. At the current spot price of €1,130 per ounce that would equate to 7.2 million ounces or 225.4 tonnes of gold bullion
The news is interesting and we believe that other institutions will follow in their footsteps and diversify into gold in order to protect themselves from negative yields. We have not heard of any other non central bank institutions diversifying into gold but it stands to reason that a small percentage will follow in Munich Res footsteps.
* * *
It isn''t just gold: the German company confirms that when rates turn negative enough, physical cash will be increasingly more valuable.
As Bloomberg reports, the German company will store at least 10 million euros ($11 million) in two currencies so it won’t have to pay for the right to access the money at short notice, von Bomhard said at a press conference in Munich on Wednesday. “We will also observe what others are doing to avoid paying negative interest rates,” he said.
Institutional investors including insurers, savings banks and pension funds are debating whether it may be worth bearing the insurance and logistics costs of holding physical cash as overnight deposit rates fall deeper below zero and negative yields dent investment returns. The ECB last week cut the rate on its deposit facility, which banks use to park excess funds, to minus 0.4 percent.
“This may well become a mass phenomenon once interest rates are low enough -- the only question will be where that exact point is,” said Christoph Kaserer, a professor of finance at the Technische Universitaet in Munich. “For large institutions, that may be the case sooner rather than later. The ECB will react with countermeasures, such as limiting cash.”
As Bloomberg adds, Munich Re’s strategy, if followed by others, could undermine the ECB’s policy of imposing a sub-zero deposit rate to push down market credit costs and spur lending. Cash hoarding threatens to disrupt the transmission of that policy to the real economy.
Munich Re, which oversees a total of 231 billion euros in investments, wants to test how practical it would be to store banknotes, having already kept some of its gold in vaults, von Bomhard said. This comes at a time when consumers are increasingly using credit cards and electronic banking to pay for transactions. Deutsche Bank AG Chief Executive Officer John Cryan has predicted the disappearance of physical cash within a decade.
“This shows the difficulties that the ECB is facing in its efforts to stimulate the real economy,” said Andreas Oehler, a professor of finance at Bamberg University in Bavaria. “Charging negative rates on overnight liquidity doesn’t stimulate longer-term lending. All it does is make companies’ and institutions’ payment transactions more expensive.”
Incidentally, once the Fed's infatuation with playing central planning doctor fizzles as the economy relapses into an accelerating downward spiral, negative rates are coming to the US next, as such the real-time experiments of how to evade a repressive monetary regime such as those conducted by the Munich Re CEO will be particularly useful to those who want to protect their assets once NIRP crosses the Atlantic.
http://www.zerohedge.com/news/2016-03-16/world’s-second-largest-reinsurer-buys-gold-hoards-cash-counter-negative-interest-rat
Oil Prices Heading For A Fall, Possibly Hard
by Forbes • March 11, 2016
By Art Berman at Forbes
Oil prices should fall, possibly hard, in coming weeks. That is because fundamentals do not support the present price.
Prices should fall to around $30 once the empty nature of an OPEC-plus-Russia production freeze is understood. A return to the grim reality of over-supply and the weakness of the world economy could push prices well into the $20s.
A Production Freeze Will Not Reduce The Supply Surplus
An OPEC-plus-Russia production cut would be a great step toward re-establishing oil-market balance. I believe that will happen later in 2016 but is not on the table today.
In late February, Saudi oil minister Ali Al-Naimi stated categorically, “There is no sense in wasting our time in seeking production cuts. That will not happen.”
Instead, Russia and Saudi Arabia have apparently agreed to a production freeze. This is meaningless theater but it helped lift oil prices 37% from just more than $26 in mid-February to almost $36 per barrel last week. That is a lot of added revenue for Saudi Arabia and Russia but it will do nothing to balance the over-supplied world oil market.
The problem is that neither Saudi Arabia nor Russia has greatly increased production since the oil-price collapse began in 2014 (Figure 1). A freeze by those countries, therefore, will only ensure that the supply surplus will not get worse because of them. It is, moreover, doubtful that Saudi Arabia or Russia have the spare capacity to increase production much beyond present levels making the proposal of a freeze cynical rather than helpful.

Saudi Arabia and Russia are two of the world’s largest oil-producing countries. Yet in January 2016, Saudi liquids output was only ~110,000 bpd more than in January 2014 and Russia was actually producing~50,000 bpd less than in January 2014. The present world production surplus is more than 2 mmbpd.
By contrast, the U.S. plus Canada are producing ~1.9 mmbpd more than in January 2014 and Iraq’s crude oil production has increased~1.7 mmbpd. Also, Iran has potential to increase its production by as much as ~1 mmbpd during 2016. Yet, none of these countries have agreed to the production freeze. Iran, in fact, called the idea “ridiculous.”
Growing Storage Means Lower Oil Prices
U.S. crude oil stocks increased by a remarkable 10.4 mmb in the week ending February 26, the largest addition since early April 2015. That brought inventories to an astonishing 162 mmb more than the 2010-2014 average and 74 mmb above the bloated levels of 2015 (Figure 2).
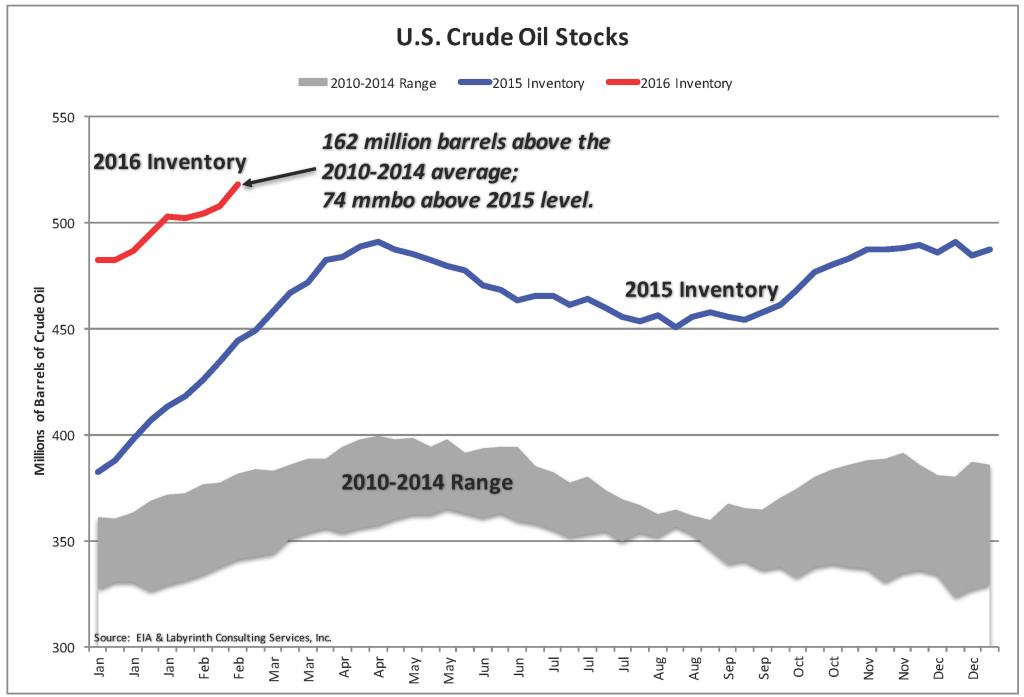
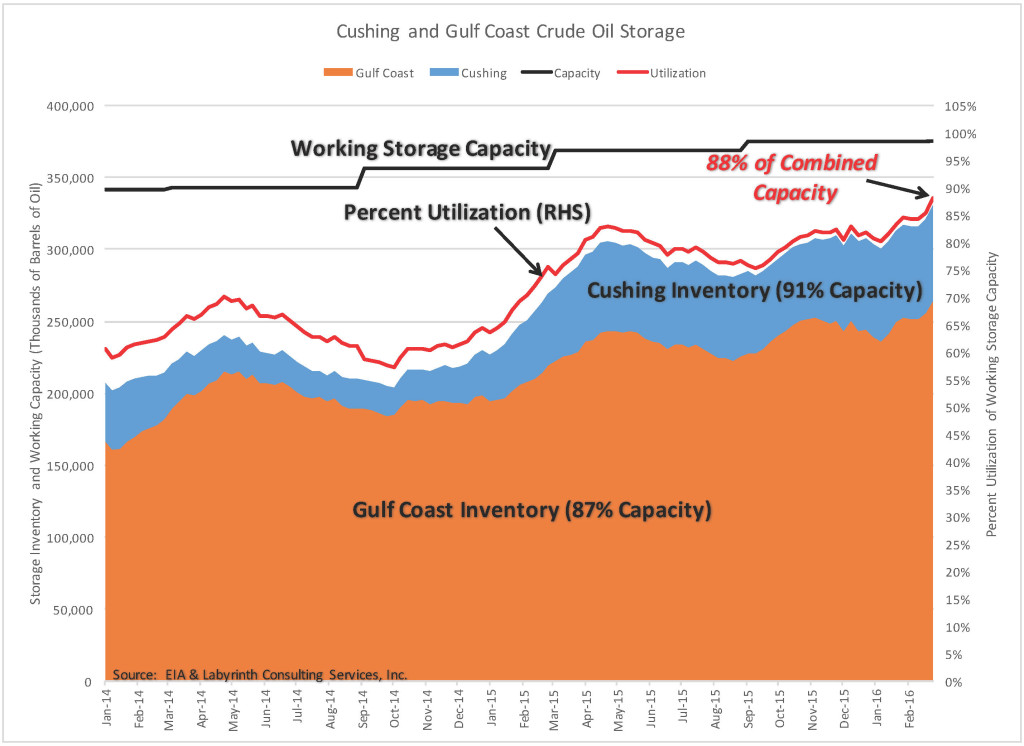
The correlation between U.S. crude oil stocks and world oil prices is strong. Tank farms at Cushing, Oklahoma (PADD 2) and storage facilities in the Gulf Coast region (PADD 3) account for almost 70% of total U.S. storage and are critical in WTI price formation. When storage exceeds about 80% of capacity, oil prices generally fall hard. Current Cushing storage is at 91% of capacity, the Gulf Coast is at 87% and combined, they are at a whopping 88% of capacity (Figure 3).
Prices have fallen hard in step with growing storage throughout 2015 and early 2016. Since talk of a production freeze first surfaced, however, intoxicated investors have ignored storage builds and traders are testing new thresholds before they fall again.
The truth is that prices will not increase sustainably until storage volumes fall, and that cannot happen until U.S. production declines by about 1 mmbpd.
Despite extreme reductions in rig count and catastrophic financial losses by E&P companies, production decline has been painfully slow. Thelatest data from EIA indicates that February 2016 production will fall approximately 100,000 bpd compared to January (Figure 4).
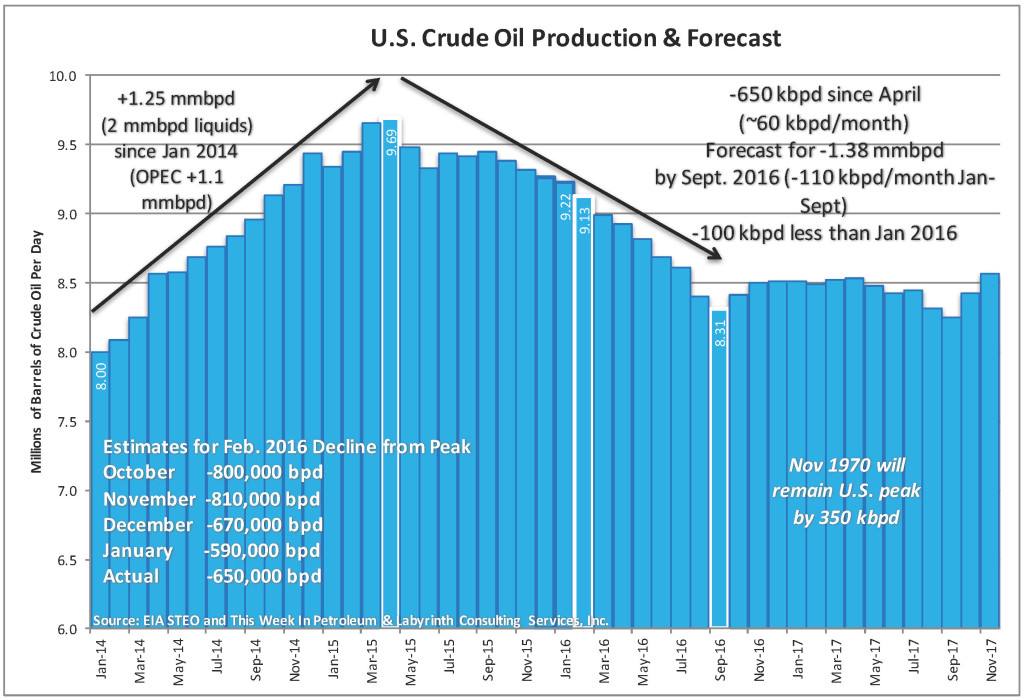
That is an improvement over the average 60,000 bpd monthly decline since the April 2015 peak. It is not enough, however, to make a difference in storage and storage controls price.
EIA and IEA will publish updates this week on the world oil market balance and I doubt that the news will be very good. IEA indicated last month that the world over-supply had increased almost 750,000 bpd in the 4th quarter of 2015 compared with the previous quarter. EIA data corroborated those findings and showed that the surplus in January 2016 had increased 650,000 bpd from December 2015.
Oil Prices and The Value of the Dollar
Why, then, have oil prices increased? Partly, it is because of hope for an OPEC production freeze and that sentiment is expressed in the OVX crude oil-price volatility index (Figure 5).

The OVX reflects how investors feel about where oil prices are going. It is sometimes called the “fear index.” That suggests that investors are feeling pretty good and less fearful about the oil markets than in the last quarter of 2015 when oil prices fell 47%. Since mid-February, prices have increased 37%.
But there is more to it than just hope and that may be found in the strength of the U.S. dollar. The negative correlation between the value of the dollar and world oil prices is well-established. The oil-price increase in February was accompanied by a decrease in the trade-weighted value of the dollar (Figure 6).
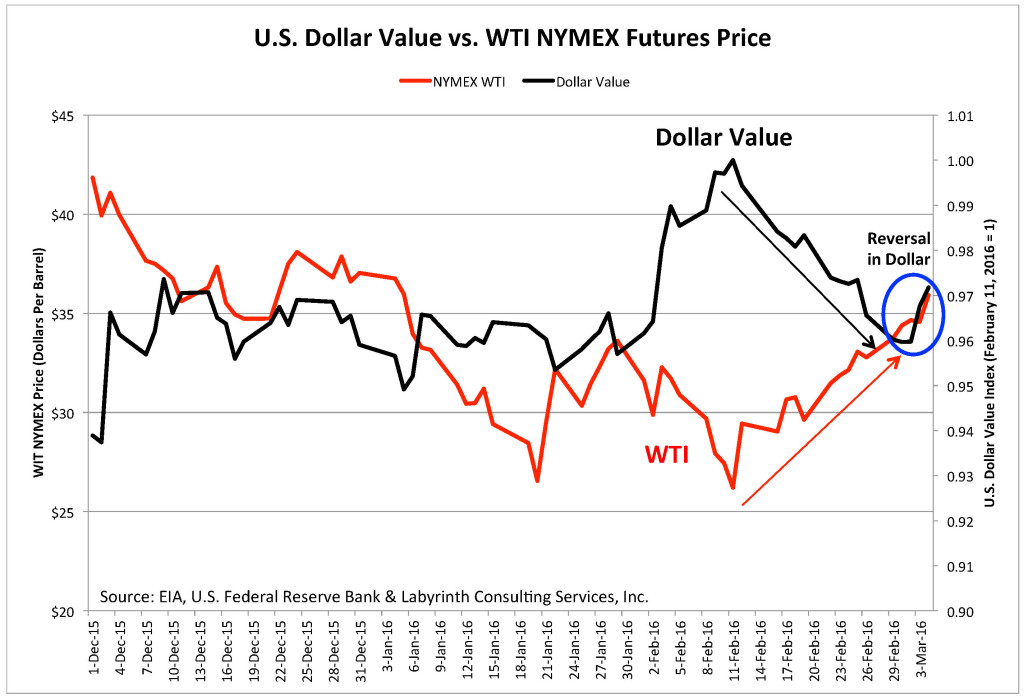
Now, that trend has reversed. The U.S. jobs report last week was positive so continued strength of the dollar is reasonable for awhile. Assuming the usual correlation, that means that oil prices should fall.
Oil Prices Should Fall Hard
It is a sign of how bad things have gotten in oil markets that we feel optimistic about $35 oil prices. It should also be a warning that the over-supply that got us here has not gone away.
Oil storage volumes continue to grow and that is the surest indication that production has not declined enough yet to make a difference. It is impossible to imagine oil prices rising much beyond present levels until storage starts to fall. In fact, it is difficult to understand $35 per barrel prices based on any measure of oil-market fundamentals.
The OPEC-plus-Russia production freeze is a cynical joke designed to increase their short-term revenues without doing anything about production levels. An output cut would make a difference but a freeze on current Saudi and Russian production levels means nothing. It apparently made some investors feel better but it didn’t do anything for me. Iran got this one right by calling it ridiculous.
No terrible economic news has surfaced in recent weeks but that does not change the profound weakness of a global economy that is burdened with debt and weak demand. The announcement last week by the People’s Bank of China that it sees room for more quantitative easing may have comforted stock markets but it only added to my anxiety about reduced oil consumption and future downward shocks in oil prices.
I hope that oil prices increase but cannot find any substantive reason why they should do anything but fall. As market balance reality re-emerges in investor consciousness and the false euphoria of a production freeze recedes, prices should correct to around $30. A little bad economic or political news could send prices much lower.
Now, that trend has reversed. The U.S. jobs report last week was positive so continued strength of the dollar is reasonable for awhile. Assuming the usual correlation, that means that oil prices should fall.
http://www.forbes.com/sites/arthurberman/2016/03/07/oil-prices-should-fall-possibly-hard/#7a8fc1196f45
"Gloom" Returns To China's Economy: Industrial Production, Retail Sales Miss Lowest Estimates
03/12/2016
After an unprecedented surge in Chinese attempts to stimulate the economy in late 2015, mostly on the fiscal side, coupled with recent monetary easing by the PBOC which cut the banks' reserve ratio recently and unleashed a tsunami of new loan creation in January, many expected that this unprecedented credit impulse would translate into at least a modest rebound for the economy, prompting a stable pick up in spending for the economy which many are touting is now consumer-spending driven as opposed to export and production.
However, that did not happen: according to data released overnight by the National Bureau of Statistics, Chinese factories and retailers not only missed expectations, but slowed down materially from the December prints, as anemic demand and excess capacity continued to bear down on the world’s second-largest economy.
Specifically, Jan-Feb factory output grew just 5.4% in January and February from a year earlier, data released by the National Bureau of Statistics (NBS) showed, slowing from a 5.9% rise in December to the weakest since November 2008; the print matched the lowest Wall Street estimate.
Meanwhile, retail sales rose 10.2% over the two-month period from a year ago, below the lowest Wall Street estimate of 10.5%, and far below the December’s 11.1% increase, pushing the trend growth in this series to lows not seen since early 2015.
"Overall, the picture is still quite gloomy," said Commerzbank AG economist Zhou Hao. “Normally, because of Chinese New Year, there’s a big drop and a big jump. This year there’s only a big drop.”
The retail data was particularly disappointing because as the WSJ writes "while industries have been battered by the economic slowdown, retail sales have been relatively buoyant, so the downtick surprised some economists, especially since it occurred around the Lunar New Year holiday when consumption is usually strong."
And to think record, if fake, box office numbers were supposed to carry China's economy in the aftermath of the absolutely disastrous trade data released earlier in the month.
To be sure, the commentary immediately explained that the weak data will mean even more stimulus, even though it was just last week when the Congress laid out all the measures that China will adopt to assure "GDP growth" of 6.5%-7.0%.
Here's Reuters: "China's activity data remained weak in the first two months of 2016, with factory output growth hitting the weakest since the global financial crisis, keeping pressure on policymakers to do more to avert a sharper showdown in the world's second-largest economy."
Unlike the recent collapse in Chinese exports and imports, the overnight data could not be "explained away" due to calendar effects as it combines the January and February timeframe: China's government combines some economic data for January and February to minimize distortions tied to the Lunar New Year holiday, which falls during those two months. It was in early February this year.
It wasn't all bad news: one area that did pick up was investment in factories, buildings and other fixed assets, which increased a faster-than-expected at 10.2?% year-over-year in January and February, compared with a 10% increase for all of 2015. However, economists said that boost came largely from government spending on infrastructure and from investment in parts of the overbuilt property market.
In other words, China is adding even more excess capacity to an economy already drowning in excess capacity.
Ultimately, the problem for China remains: weak demand at home and abroad is weighing on industries and many factories continue to churn out unneeded goods. "A recovery is still eluding China’s industrial sector,” Mizuho Securities Asia Ltd. said in a recent report, before the release of the data Saturday.
Worse, for all the talk about a massive stimulus, China's economy continues to deteriorate: as quoted by the WSJ, Chen Zhenxing, sales manager with Zhejiang Lanxi Shanye Machinery Co., which produces hand carts and other logistics equipment in the eastern city of Jinhua, said his company faces ongoing problems raising capital and boosting prices: "competition is cutthroat,” he said. “Too many companies make products that are pretty much the same, so the focus turns to lowering prices."
Ultimately many will have to go out of business, leading to millions in layoffs, and forcing the Beijing politburo to face its greatest nightmare.
The problem with China's economy is that the local population, having tired of the stock market bubble, has now shifted its attention back to reflating the housing bubble, where as we reported recently there has been an unprecedented 50% surge in some Tier 1 cities such as Shenzen. As such the economy is focused not on creating new goods and services, but merely facilitating financialization and extracting rents.
This is why China's leaders have now put all their eggs in the housing market basket: Zhang Yiping, an economist with China Merchants Securities, said property investment and domestic consumption could be China’s major growth drivers this year given sluggish global demand and Beijing’s plans to cut industrial overcapacity.
Commerzbank’s Mr. Zhou and other economists expressed concern that investment is flowing into a few real-estate markets that show signs of overheating, rather than into new ventures. “Monetary policy is relaxed, but it’s reluctant to go to the real economy, only to property assets,” he said.
The slower pace of retail sales in January and February may reflect the turbulent financial markets and weak corporate profits last year, which dampened wage hikes and bonuses, economists said.
Even accounting for data volatility around the Lunar New Year holiday, China’s economy is off to a slow start this year following economic growth in 2015 of 6.9%, the slowest pace in 25 years. A host of stimulus measures late last year and into 2016—most recently a 0.5 percentage point cut in bank reserves late last month, have yet to reverse the slide in momentum.
The biggest problem, one which we have warned about since 2010, is that China remains mired under an unprecedented debt load, one which makes any forecast for 6.5% growth on the back of credit which is growing at double this pace, laughable.
Weekend Reading: The Bull/Bear Struggle Continues
March 11, 2016
by Lance Roberts
via RealInvestmentAdvice.com,
The standoff between the “bulls” and “bears” continued this week as prices struggled to rise. The “bulls” continue to “hope” that the recent turmoil that started at the beginning of this year has come to an end. The “bears” continue to point out silly things like an ongoing earnings recession, weakening economic data, and deteriorating technicals to make their case.
Silly “bears”.
Interestingly, on Thursday, the ECB launched its biggest “bazooka” yet pushing further into negative interest rates, increasing their already failed QE program and crossing every finger and toe for “good luck.” Via the ECB:
“At today’s meeting the Governing Council of the ECB took the following monetary policy decisions:
(1) The interest rate on the main refinancing operations of the Eurosystem will be decreased by 5 basis points to 0.00%, starting from the operation to be settled on 16 March 2016.
(2) The interest rate on the marginal lending facility will be decreased by 5 basis points to 0.25%, with effect from 16 March 2016.
(3) The interest rate on the deposit facility will be decreased by 10 basis points to -0.40%, with effect from 16 March 2016.
(4) The monthly purchases under the asset purchase programme will be expanded to €80 billion starting in April.
(5) Investment grade euro-denominated bonds issued by non-bank corporations established in the euro area will be included in the list of assets that are eligible for regular purchases.”
Question:
“What happens during the next global economic recession when these unsecured corporate bonds go bankrupt?”
If you remember, Lehman bonds were IG unsecured corporate bonds the DAY BEFORE they went into bankruptcy. That event sparked the global financial crisis. But this time will be different, right?
I’m only asking the question.
Anyway, I digress. This week’s reading list takes a look at various views on the market, the latest jobs report, oil prices and other interesting reads.
1) Do Any Of The Recent Rallies Pass The Sniff Test by Charles Hugh Smith via OfTwoMinds
“As Chris Martenson and many others have noted, “price discovery” is a joke now, as markets are either propped up by central bank “we got your back” guarantees or outright asset purchases, or driven up and down by speculative hot money flows.
This is not capitalism, or a functioning market: this is the end-game of legalized looting and financialization. What’s the value of real estate? If interest rates are pushed negative, then that gooses housing demand, as the cost of interest on a mortgage declines to near-zero in real terms.”

2) The Markets Are Stretched, So I’m “All-In” Short by Doug Kass via Real Clear Markets
“My recent column Not So Super Tuesday highlights why I believe markets are tipping over to short-term bearish, while my Top 10 Reasons to Sell Stocks Now piece incorporates most of my intermediate-term concerns.
That’s why I moved to “all-in short” on Friday during the market’s post-jobs-report ramp-up. I believe stocks’ recent rally from their mid-February low has stretched valuations and drastically altered the risk-vs.-reward ratio.
I‘d also note that Friday’s seemingly good February U.S. jobs report wasn’t quite as “clean” as the strong headline number of 242,000 non-farm job gains suggests. For instance, average wages dropped by 0.1%, while average hours worked fell by 0.2 — a decline usually seen in recessions. (Previous similar drops occurred in February 2010 and December 2013.)”
But Also Read: The Market Is Doing The Most Bullish Thing It Can Do by Kevin Marder via MarketWatch
And Read: Stocks Won’t Earn Nearly As Much Over Next 7-Years by Mark Hulbert via MarketWatch
Further Reading: The Perfect Storm Isn’t Over Yet by Mohamed El-Erian via Project Syndicate
3) The Wall Street Profits Illusion by Sam Ro via Yahoo Finance
“Wall Street gurus like Societe Generale’s Andrew Lapthorne, have been tracking the discrepancy between GAAP and non-GAAP reported profits for years.
But last fall, more experts like Deutsche Bank’s David Bianco grew increasingly concerned with what was becoming a growing divide between GAAP and non-GAAP profits.
‘Blended [non-GAAP] 4Q earnings per share is $29.49 with GAAP EPS of $19.92,’ Bianco said of S&P 500 profits on Monday. He further noted that this 67% ratio of GAAP to non-GAAP EPS is ‘well below the normal ~90% ex. recessions.'”

4) February Jobs Report A Little Misleading by John Crudele via New York Post
“Labor trumpeted that 242,000 new jobs were created in February, although wages declined 0.1 percent, the average workweek dropped by 0.2 hours and aggregate hours worked fell 0.4 percent. And part-time work soared in February while full-time job growth was mediocre.
Even the 242,000 job growth looked hokey. Retailing, for instance, saw an unbelievable (as in “not to be believed”) jump of 55,000 jobs despite the fact that February isn’t exactly the month when stores hire people to handle a swarm of shoppers.
As I said last Thursday and in a special Saturday column, the February job report was helped by rogue statistics — untrustworthy seasonal adjustments (especially in retailing) and giddy assumptions made by Labor that will probably have to be corrected later.“
Also Read: Wages – Shadow Hanging Over Jobs Market by Jeff Cox via CNBC
And Read: Does Jobs Report Point To Recession by Jared Pincin via Real Clear Policy
5) Oil Prices Should Fall, Possibly Hard by Art Berman via Forbes
“Oil prices should fall, possibly hard, in coming weeks. That is because fundamentals do not support the present price.
Prices should fall to around $30 once the empty nature of an OPEC-plus-Russia production freeze is understood. A return to the grim reality of over-supply and the weakness of the world economy could push prices well into the $20s.“

http://realinvestmentadvice.com/weekend-reading-the-bullbear-struggle-continues/
Why Crude Prices Are Heading For Another Deep Plunge
March 10, 2016
In this bipolar market, where only momentum, liquidity, technicals and short squeezes matter, as well as the occasional kneejerk reaction to a flashing red headline (usually some lie out of Venezuela or Nigeria about an imminent OPEC meeting which has not even been scheduled), one thing that no longer seems to have an impact on prices is actual news and fundamentals. So to help those who are blindly following the price of oil as an indicator of what is happening, here is a brief recap of the main news and research reports that should be impacting where oil trades today, but almost certainly won’t.
Among today’s key highlights compiled by Bloomberg we learn that JBC Energy doesn’t expect China to maintain record crude imports seen in Feb. as refinery maintenance, elevated storage impact. FGE says proposed producer accord to freeze output a “joke”, while Deutsche Bank says “fading oil demand may hamper price recovery.”
Here are the top stories via Bloomberg:
JBC Energy
China probably can’t maintain Feb.’s record crude imports amid refinery maintenance, storage capacity limitations
Feb. imports likely were boosted by “continued weakness in outright prices,” higher crude runs at teapot refineries
Facts Global Energy chairman Fereidun Fesharaki
Deal to cap crude output at record “a joke”; production freeze is “nonsense”
Libya can boost output to 1.2m b/d, taking prices down to $20/bbl
CNPC Chairman Wang Yilin
Current $30-40/bbl oil price not sustainable; $50-60 a “reasonable” range
Co. drafting development plans for long-term low oil price environment
Bloomberg story
Oil producers slow to add hedges as they wait for higher prices
As prices continue to rise, “we should see producer hedging accelerate,” says BNP Paribas head of commodity markets strategy Harry Tchilinguirian
Eurasia Group global energy, natural resources director Bruno Stanziale
Oil at $50 will bring U.S. producers back to mkt
Oil prices to see “gradual” rise to around $40/bbl by yr-end, avg. $50/bbl in 2017; price “volatility will dry up”
Institute for Energy Research
U.S. shale oil boom makes renewable fuels standard obsolete, helped to reduce dependence on imports
JBC Energy
European gasoline cracks to see further upside in coming wks on higher U.S. consumer demand
Increased gasoline imports by Nigeria may be supporting Mediterranean market
Deutsche Bank report
Fading Chinese oil demand may hamper price recovery
Chinese fuel consumption “may begin to flatten more quickly than some long-term projections indicate.” This could reduce global oil demand growth to 800k b/d by 2024, compared w/ 1.1m b/d from 2000-2016
ESAI report
Libyan production will not recover as “the ongoing civil war and the rise of ISIS in Libya will carry on for years”: Boston-based consultant
* * *
And now back to your liquidity/squeeze driven melt up/down.
http://www.zerohedge.com/news/2016-03-09/output-freeze-joke-china-demand-fall-and-other-news-should-be-moving-oil
Amend, Extend, Pretend—-How Bankers Will Intensify The Global Deflation
by SHTFPlan.com • March 8, 2016
In 2011, as gold prices rocketed to $1900 and oil was trading above $120 a barrel, there were few analysts who saw anything but further gains. But Marin Katusa ofKatusa Research had a different opinion. At a major commodity conference Katusa, to boos and jeers from the audience, held strong to his analysis that an imminent deflationary collapse in commodity prices was on the horizon. And collapse they did.
According to Katusa, who is closely involved in the Canadian resource sector, most people simply assumed the good times would go on forever… because it was different this time. But like any uninhibited party fueled by unlimited cash, the hangover was sure to follow.
There’s no doubt you had massive high paying jobs. In Canada, the province that benefited the most is Alberta… In the last twelve months they’ve had 70,000 layoffs of jobs paying over a hundred grand a year.
…when I’d go to these oil towns you’d sit down at the casinos with them and these guys were all about the hookers and blow… they were all about their toys… big fancy trucks… snow mobiles… and they’re in the field for two weeks and they make $20,000 and blow it all at the casinos.
You knew it couldn’t last.
As Katusa notes in his latest interview with Future Money Trends, though the crash has been brutal for the sector, it’s not over yet and it’s going lower for longer.
They [OPEC] can survive at $20 oil…
For two years everyone’s been saying, “OPEC’s going to cut back.”
They reality here is, why would OPEC cut production? That would only prop up the Russians and the shale sector.
And while most will argue that low oil prices will wipe out most of America’s shale industry, Katusa has a contrarian view, suggesting that shale sector debt, while significant, is not necessarily going to cause these companies to go under in the immediate future.
Why?
Because what banker in their right mind wants to get dirty and actually operate an oil field?
So the debt will be amended, extended and then they’ll pretend.
… Because you can’t just shut down an oil field. You have to reclaim those wells, which means you have to shut them down and environmentally reclaim them… and it costs more to do that today than what the actual value is.
The bankers know that.
… With innovation, in the Western world, costs will decrease and the bankers have no choice but to amend, extend and pretend the debt.
So they’re going to go lower for longer.
In short, going forward we should expect widespread manipulation from the producers and the banks themselves to keep the bankruptcies at bay.
But recession still looms, and Katusa says that there are two things we can count on in the near future and why people need to rethink their investments:
The economy is changing… In a zero-interest rate policy world people have to rethink their investments… You’re looking at higher volatility, lower returns, but much higher risk.
With all this going on in the world there are only two things that can happen.
We continue with negative interest rates, which I see the trend globally… 35% of Eurozone countries already have negative interest policies…
And there’s going to be quantitative easing for the people… QE4-P… and that’s the reality here.
Negative interest rates are a tax on wealth… a tax on savers.
And if you haven’t already guessed, amid all the volatility and debasement of currencies, one asset class, according to Katusa, will survive and counter the coming helicopter drop of freshly printed dollars:
There’s a great way to make money on this if you get ahead of QE4P… the quantitative easing for the people… and gold is one of the ways to do that.
In his must-see interview, Katusa expands on this forecast by noting that, on top of all the bailouts, trade tariffs, and quantitative easing to follow, China, in an effort to maintain the perception of stability in their economy and financial markets, will soon begin flooding the global economy with commodities like aluminum, steel, iron ore and coal, which will continue to have a deflationary impact on broader commodity markets.
But the one sector they can’t flood – precious metals – is the very sector investors should be looking at as a way to not only preserve wealth going forward, but to grow it exponentially as crisis continues to hammer the global marketplace. That’s why Katusa has disclosed he is writing million dollar checks to one specific gold acquisition company, in similar fashion to other noteworthy insiders who are moving heavily into gold including Doug Casey, Eric Sprott, George Soros, Stanley Druckenmiller and Carl Icahn.
http://davidstockmanscontracorner.com/amend-extend-pretend-how-bankers-will-intensify-the-global-deflation/
Deflation Is Coming To The Auto Industry As Used Car Prices Drop, Off-Lease Deluge Looms
03/08/2016
Last week, we learned that vehicle leasing as a percentage of monthly light-vehicle sales hit a record in February at 32.3%.
In other words, a third of the over 1 million cars and light trucks “sold” during the month were leases, according to J.D. Power.
This is indicative of what is now a long-term trend. Have a look at the following chart from WSJ, which shows that since 2009, the share of monthly auto leases as a percentage of vehicle sales well more than tripled:

Of course the thing about leased vehicles is that they come back, and as WSJ wrote last week, “about 3.1 million vehicles will return to dealer lots off leases this year, up 20% from 2015 [and] the number will climb to 3.6 million in 2017 and 4 million in 2018.”
So what does that mean for dealers? Deflation.
And what does that mean for the automakers? Hefty losses.
Nothing about this is hard to understand. You get a supply glut causing pricing assumptions for your existing inventory to prove wildly optimistic and you end up with giant writedowns.
This has happened before. "The auto industry expanded the use of leasing in the mid-1990s, helping to fuel retail sales of new vehicles," WSJ recounts. "Eventually, a glut of off-lease cars sent resale values down and auto lenders who had bet residuals would remain high ended up racking up billions of dollars in losses, having to sell the cars for much less than they anticipated."
Right. Nothing difficult to grasp about that. But the especially silly thing about the dynamic with auto leases is that it was the dealers and the automaker-affiliated financing companies that made the leases in the first place. In other words, it's not like this was some supply shock that couldn't have been forecast ahead of time. In fact, they knew exactly when the off-lease deluge would start, so it's not entirely clear why they would have set optimistic residual assumptions.
Anyway, the cracks are already starting to show.
The Manheim Used Vehicle Value Index posted its largest Y/Y decline in over two years last month, falling -1.4% and -1.5% M/M. We're now 3.5% below the peak.

"All else equal, it puts pressure on lease residuals - though we note most fincos had assumed declining used vehicle prices in their lease writing," Goldman said, earlier today. "Second, while improving inventory acquisition cost for the dealers, it may put downward pressure on the value of existing dealer inventories, which can be negative for used margins."
Well yes, declining used vehicle prices "may" be a "negative for used margins" - in fact that's almost a tautology.

And of course falling used car prices means pressure on new car prices as well, which would be a shock to America's booming auto market.
Obviously, the scariest part about all of the above is that consumers still have the pedal to the metal (pun fully intended) when it comes to leases, which means there's no end in sight to the off-leases and thus no way to determine, at this juncture, how big the residual writedown wave and deflationary auto industry calamity will ultimately end up being.
So, you know... "buckle up."
* * *
Bonus chart: largest used car price decline for any February since 2008

http://www.zerohedge.com/news/2016-03-08/deflation-coming-auto-industry-used-car-prices-drop-lease-deluge-looms
The Oil Short Squeeze Explained: Why Banks Are Aggressively Propping Up Energy Stocks
March 8, 2016
Last week, during the peak of the commodity short squeeze, we pointed out how this default cycle is shaping up to be vastly different from previous one: recovery rates for both secured and unsecured debts are at record low levels.
More importantly, we noted how this notable variance is impacting lender behavior, explaining that banks - aware that the next leg lower in commodities is imminent - are not only forcing the squeeze in the most trashed stocks (by pulling borrow) but are doing everything in their power to "assist" energy companies to sell equity, and "persuade management" to use the proceeds to take out as much of the banks' balance sheet exposure as possible, so that when the default tsunami finally arrives, banks will be far, far, away from the carnage.
All of this was predicated on prior lender conversations with the Dallas Fed and the OCC, discussions which the Dallas Fed vocally denied and accused us of lying, yet which the WSJ confirmed, showing that it was the Dallas Fed who was lying.
This was our punchline:
[Record low] recovery rate explain what we discussed earlier, namely the desire of banks to force an equity short squeeze in energy stocks, so these distressed names are able to issue equity with which to repay secured loans to banks who are scrambling to get out of the capital structure of distressed E&P names. Or as MatlinPatterson's Michael Lipsky put it: "we always assume that secured lenders would roll into the bankruptcy become the DIP lenders, emerge from bankruptcy as the new secured debt of the company. But they don't want to be there, so you are buying the debt behind them and you could find yourself in a situation where you could lose 100% of your money."
And so, one by one the pieces of the puzzle fall into place: banks, well aware that they are facing paltry recoveries in bankruptcy on their secured exposure (and unsecured creditors looking at 10 cents on the dollar), have engineered an oil short squeeze via oil ETFs...

... to push oil prices higher, to unleash the current record equity follow-on offering spree...

... to take advantage of panicked investors some of whom are desperate to cover their shorts, and others who are just as desperate to buy the new equity issued. Those proceeds, however, will not go to organic growth or even to shore liquidity but straight to the bank to refi loan facilities and let banks, currently on the hook, leave silently by the back door. Meanwhile, the new investors have no security claims and zero liens, are at the very bottom of the capital structure, and face near certain wipe outs.
In short, once the current short squeeze is over, expect everyone to start paying far more attention to recovery rates and the true value of "fundamentals."
Going back to what Lipsky said, "the banks do not want to be there." So where do they want to be? As far away as possible from the shale carnage when it does hit.
Today, courtesy of The New York Shock Exchange, we present just the case study demonstrating how this takes place in the real world. Here the story of troubled energy company "Lower oil prices for longer" Weatherford, its secured lender JPM, the incestuous relationship between the two, and how the latter can't wait to get as far from the former as possible, in...
"Why Would JP Morgan Raise Equity For An Insolvent Company"
I am on record saying that Weatherford International is so highly-leveraged that it needs equity to stay afloat. With debt/EBITDA at 8x and $1 billion in principal payments coming due over the next year, the oilfield services giant is in dire straits. Weatherford has been in talks with JP Morgan Chase to re-negotiate its revolving credit facility -- the only thing keeping the company afloat. However, in a move that shocked the financial markets, JP Morgan led an equity offering that raised $565 million for Weatherford. Based on liquidation value Weatherford is insolvent. The question remains, why would JP Morgan risk its reputation by selling shares in an insolvent company?
According to the prospectus, at Q4 2015 Weatherford had cash of $467 million debt of $7.5 billion. It debt was broken down as follows: revolving credit facility ($967 million), [ii] other short-term loans ($214 million), [iii] current portion of long-term debt of $401 million and [iv] long-term debt of $5.9 billion. JP Morgan is head of a banking syndicate that has the revolving credit facility.
Even in an optimistic scenario I estimate Weatherford's liquidation value is about $6.7 billion less than its stated book value. The lion's share of the mark-downs are related to inventory ($1.1B), PP&E ($1.9B), intangibles and non-current assets ($3.5B). The write-offs would reduce Weatherford's stated book value of $4.4 billion to - $2.2 billion. After the equity offering the liquidation value would rise to -$1.6 billion.

JP Morgan and Morgan Stanley also happen to be lead underwriters on the equity offering. The proceeds from the offering are expected to be used to repay the revolving credit facility.
In effect, JP Morgan is raising equity in a company with questionable prospects and using the funds to repay debt the company owes JP Morgan. The arrangement allows JP Morgan to get its money out prior to lenders subordinated to it get their $401 million payment. That's smart in a way. What's the point of having a priority position if you can't use that leverage to get cashed out first before the ship sinks? The rub is that it might represent a conflict of interest and [ii] would JP Morgan think it would be a good idea to hawk shares in an insolvent company if said insolvent company didn't owe JP Morgan money?
The answer? JP Morgan doesn't care how it looks; JP Morgan wants out and is happy to do it while algos and momentum chasing daytraders are bidding up the stock because this time oil has finally bottomed... we promise.
So here's the good news: as a result of this coordinated lender collusion to prop up the energy sector long enough for the affected companies to sell equity and repay secured debt, the squeeze may last a while; as for the bad news: the only reason the squeeze is taking place is because banks are looking to get as far from the shale patch and the companies on it, as possible.
We leave it up to readers to decide which "news" is more relevant to their investing strategy.
Is This Whole Rally Just One Big TRAP?
by Phoenix Capital Research
03/07/2016
I don’t trust this rally.
Few analysts realize that the sharpest, most aggressive rallies occur during bear markets. The reason for this is that during bear markets, investors tend to go short (borrow shares to bet on a collapse).
So when the market rallies even a little bit, it often will go absolutely vertical as these individuals panic and cover their shorts (which increases the buying).
Consider the Tech Bubble. When it burst, we had THREE monster rallies of 17%, 33% and 16% in just SIX months time!

Anyone who bought into these moves for the long-term ended up get crushed as the market soon rolled over and worked its way down. The below chart gives some perspective on just how much further stocks would fall relative to these traps.

Smart investors, however, used those rallies to prep for the next round of the drop. They didn’t get suckered into believing that it was the beginning of the next bull market.
http://www.zerohedge.com/news/2016-03-07/whole-rally-just-one-big-trap
China Is About To Unleash A Monster Housing Bubble, In Six Easy Steps
March 7, 2016
One week ago we showed the disturbing degree to which the latest (and greatest) housing bubble among China's Tier 1 has gripped the broader public, when we reported that local speculators are waiting in line for days to flip homes.
Visually, it looks as follows - the bubble is entirely in the Tier 1 cities; for now everyone has given up on the other regions which are suffering greatly as a result of the bursting of the commodity bubble and have seen an exodus of recently unemployed workers:

The demand for housing in Shanghai and Shenzen has gotten so "bubbly" that even the government-run news agency Xinhua on Wednesday warned of increasing leverage risks and called for further tightening measures to rein in the market. Which is ironic, because just days later the People's Congress announced it would support the Chinese housing market, sending conflicting messages of whether it does or does not want another housing bubble.
And while we know that retail speculators are simply feeder-fish piggybacking on the latest housing craze, it is the people with far more capital - and leverage - who are ultimately pulling the strings, as an article in the local media explains in detail.
In an article written on Caijing, we get to the bottom of the rapid rise in housing prices in Shenzhen and other Tier I cities. As it notes, the property boom is ominous, and ultimately hints of even more capital outflow and currency devaluation to come.
The gist of the article (in Chinese) is that the business owners, foreign factory bosses and other powerful people are the cause of the meteoric housing price rise. Here is the link. Some of the other highlights:
The typical housing transaction in this latest housing bubble looks as follows:
1. The business owner creates a fake employment contract with his maid or driver, showing an impressive income to justify a high monthly mortgage.
2. The owner sells his property to his maid/driver at the highest price possible (as much as the bank will appraise for). Maid/driver doesn't care about what the price is and accepts the asking
3. The owner gives his maid the money for the down payment of 30% (lowered recently as PBOC policy), while receiving the the full or above full value of the property
4. Maid/driver moves into the upscale property of the owner, which is why mainstream media is characterizing the boom as 'upgrade buys'. And continue to live there until the actual owners decide to stop outlaying for the mortgage payment.
5. The owner cashes out of the property basically with PBOC's help (ease of credit, lowered down payment etc), promptly moves the money out of China through import/export channels, contributing to capital outflows.
6. At some point in the future, the owners will stop making mortgage payment, since they've already cashed out of the property with a huge windfall. Bank goes to foreclose; maid/driver will go back to living where they lived before.
In Shenzhen, housing debt as percentage of total debt is 22.4%, 1.7X Shanghai and 2.25X Beijing.

But what's more worrisome is that since this trick can be applied basically anywhere in China, it will be and the elite in Shanghai and Beijing will catch on as will tier 2-4 cities, whose governments are even more desperate to rescue the housing market.
With the elite and smart money milking the existing banking system in this way and moving money out, China's 3.2 Trillion (and declining for 4 consecutive months) official reserves doesn't look all that impressive.
The Last Time The Market Was So Overbought, This Happened
March 3, 2016
The last 3 weeks have been a near unprecedented rip higher in stocks... as markets anticipated G-20 cooperative actions (and then BoJ and ECB follow-through) creating a vicious short-squeeze bounce...

This has sent The McClellan Oscillator to its most overbought since January 2009...

What happened then?
The Group of 20 leaders from major developed and emerging economies had pledged on their meeting on Saturday short-term measures such as fiscal stimulus in order to try to keep the global economy from falling into a deep slump and promised to look at ways to tighten regulations to prevent future crisis.

That did not end well!
"The Bounce Has Run Its Course" Bob 'The Bear' Janjuah Warns S&P Heading To 1700s
March 5, 2016
Nomura's Bob Janjuah warend in January that "the bubble implosion can't be fixed this time," and, as he explains in his latest note, he is pleased with all six of his key forecasts for 2016...
In particular on Commodities, with his expectation that crude would trade below $30 (the price per barrel fell from $37 in early January to a low so far of $26 in February).
And on Rates, the 30yr UST yield fell from 2.95% in early January to a low so far of 2.49% in February, below his 2.5% target for 2016, and the 10yr UST yield fell from 2.2% in early January to a low so far of 1.66% in February, in line with his expectation over 2016 of a move in yields down from 2% towards 1.5%.
The reasons for his latest note are:
1. To reiterate my bearish views on risk assets for H1 2016 – I continue to see much lower equity prices, lower core bond yields, wider credit spreads, and weakness in EM and commodities over the next four months (at least). In January I said that the S&P500 would fall from 2000/2050 to the 1500s as my target over 2016. I reaffirm this view. I note with interest that at the global equity market ”lows” so far in 2016, seen earlier in February, virtually all major global stock markets were in official bear market territory. For example, the Eurostoxx 50 fell over 30% from its 2015 high to its (so far) 2016 low. The MSCI World fell 20% from its 2015 high to its (so far) 2016 low. The key exception to this move into official bear market territory has been the major US indices, but I expect this to correct itself over the next four months or so.
2. To highlight that, in my view, stocks’ countertrend bounce off the February lows has now run its course and I believe we are – in early March – likely to see the onset of the next leg weaker in risk, vs stronger in core duration. I expect this next leg of weakness to last three to five weeks and to result in new lows so far in this cycle in stocks (S&P500 into the 1700s) and new lows in core government bond yields (target 1.5% in 10yr USTs). It is important to remember that in bear markets the strength is to the downside, the violence is to the upside, with countertrend rallies in bear markets often being the most painful. Markets simply do not go down (or up) in straight lines. But if I am right that this bounce is over, we should continue to see a series of lower lows and lower highs in stocks around the globe.
To protect against being wrong, particularly with respect to timing, it is prudent to put in place a stop loss, triggered if/when we see a consecutive weekly close in the cash S&P500 index above 2040.
3. To admit that even I am a little surprised by the desperation already evident among central bankers. As per my January note, I expected the BOJ to ease in Q1, but going straight to negative rates has seriously harmed the BOJ’s credibility and the credibility of Abenomics. ECB QQE has clearly failed to create the inflation Mario Draghi promised us, but I have no doubt the ECB will ease again this month. And even the Fed is now “drip-feeding” negative rates into the market through its usual channels. The Fed has made a major policy error already, and I remain convinced that the Fed will be easing by the end of the year. But I would not be surprised if Fed hubris “forces” it to tighten once more before end-June. Focusing so much on an extremely lagging and “technically created” number like the unemployment rate is at the root of this policy error. The Fed is simply not focusing enough on important issues like weak earnings, poor quality jobs, imported deflation, weakness in investment spending, weakness in corporate revenue and profit (not EPS) growth, and deeply scarred consumer behaviour. I could go on, but suffice it to say that I think the Fed has backed itself into a corner, and will only be able to free itself to get ahead of the curve (rather than as it is now, way behind the curve) once the data and markets truly hit some form of capitulation bottom. As I have written in the past, I don’t see a “Fed put” until the S&P500 trades down into the 1500s.
4. To stress that central bank credibility is draining fast and, assuming that the BOJ and ECB go again this month, I now see a risk of a breakdown in markets and outcomes that are the opposite of what central bankers are trying – and have been failing for over seven years now – to achieve, i.e. nominal GDP at 5%, EVEN IF THIS 5% CONSISTS OF 0% REAL AND ALL 5% FROM INFLATION. We are entering an extremely worrying time and we have got here even faster that I had feared – a place where monetary policy and central banks become the problem and not the cure. As discussed above, the Fed is in a hole of its own making by using self-serving metrics to fix a debt and asset bubble crisis with a policy that relies on more debt and even bigger asset bubbles. But in the short term – this next month – I am concerned that markets will react badly and contrary to policymaker expectations when both the BOJ and the ECB attempt to ease further this month. I suspect the ECB and the BOJ are – as far as markets are concerned – “damned if they do, and damned if they don’t” with any residual credibility likely to decay away this month. But both institutions should realise this is down to their own mistakes, whereby (like the Fed) they have sought to fix the ills of excessive debt, asset bubbles and a lack of competitiveness thorough policies which merely result in a zero-sum outcomes (FX wars) and/or which rely on the “greater fool” theory requiring “someone” to take on more debt to continually speculate on an un-burstable asset price bubble. Sadly, of course, mankind has so far failed to create un-burstable bubbles, especially where the underlying foundations are so flimsy. This competitiveness issue is global and critical. Since the global financial crisis (GFC) very little production capacity reduction has been allowed to occur in the DMs (courtesy of QE and ZIRP, which together facilitate the avoidance of default cycles, which are central to reducing capacity). At the same time, globally, particularly in places like China and in industries like Energy and Shipping, we have seen significant production capacity added since the GFC. Again, in part due to QE and ZIRP policies in DMs. Of course, this would be less of a problem if global aggregate demand growth had increased strongly over the last seven years, but this has clearly not happened. In particular, the debt-driven consumption frenzy of the years leading up to the GFC in the DMs has barely come back, while at the same time demand growth in the EM sphere has been much slower than hoped for (and needed), and latterly severe economic downturns in places like Russia, China, the Middle East and Brazil have hampered this handover even more. So the response to all of this has been the zero-sum game referred to above, FX wars, which merely operate to allow temporary and transitory relative shifts in competitiveness but with severe (unintended?) consequences.
5. To stress that, in a world of NIRP and QE, and where the bid for liquidity in markets is many multiples of the levels of liquidity the sell-side can offer, I find it extremely difficult to get any visibility in FX markets. FX markets are the most exposed to central bank credibility and are also where significant flows can drive markets most immediately, more so than in other markets like Rates or Equities. My bias is to believe that the USD is the least worst “long” until the Fed flips on its current policy path. But as with the BOJ's recent easing and the market’s response (the opposite of what was trying to be achieved), the credibility issue of central banks in general, and of some central banks more than others at any given time, has now become a major uncertainty factor. As such, I feel that this is an extremely difficult market to call on anything other than a very medium-term basis. I am not alone here – the 20% rally in gold since December testifies to this. My key message for 2016 remains unchanged in terms of FX markets (strong USD until the Fed reverses course), but I am increasingly inclined to look at gold again as a safe haven for 2016, and am increasingly inclined to avoid tactical calls on FX markets.
Janjuah concludes by noting that his inclination when thinking about this note was to consider even more bearish targets for risk assets/even more bullish targets for core bond yields.
For now, I have decided to stick with what I published in January, but now I think we are facing an even more difficult 2016 than I had anticipated at the outset of this year.
The over-reach of central bankers and their failed policies is not news to me. What is news to me, especially after the BOJ's easing in January, is that markets are now either at or very close to losing all confidence in the post-GFC policy response crafted by the Fed/ECB/BOJ et al much earlier in 2016 than even I had expected.
http://www.zerohedge.com/news/2016-03-05/bounce-has-run-its-course-bob-bear-janjuah-warns-sp-heading-1700s
The Most Painful Part Of The Short Squeeze May Be Yet To Come, JPM Warns
March 5, 2016
Two weeks ago, we reported that NYSE Short Interest has risen 4.5%, back over 18 billion shares near the historical record highs of July 2008 (and up 7 of the last 9 months).

We said that this dynamic means one of two things:
Either a central bank intervenes, or a massive forced buy-in event occurs, and unleashes the mother of all short squeezes, sending the S&P500 to new all time highs, or
Just as the record short interest in July 2008 correctly predicted the biggest financial crisis in history and all those shorts covered at a huge profit, so another historic market collapse is just around the corner.
So far not a single central bank or major policy-making institution has intervened with a major (or for that matter, any) stimulus, but the expectation that one will - be it the G-20 last weekend, China this weekend, the ECB next week or the BOJ the week after - has led to precisely one of the two postulated outcomes: as we reported yesterday, the "mother of all short squeezes" was indeed unleashed, and last week the "most shorted" stocks were up a near record 8.7%, the highest since the furious November 2008 bear market rally.

So does this mean the short squeeze - whether ordinary course of business or engineered by banks to push the price of both the S&P and oil higher so that energy companies can sell equity and repay secured bank loans (as we speculated last week) - is over? According to JPM, not just yet, even though by now the weakest hands have clearly tapped out. In fact, since there has been virtually no rotation into ETFs, the most brutal part of the squeeze may be just ahead. Here's why:
The covering of short equity positions continued over the past week. The short interest in US equity futures declined over the past week as seen in Figure 1.

But its level remains very negative suggesting there is room for further short covering. The short interest on SPY, the biggest equity ETF, at 4.75% stands below its recent peak of 5.43% but it remains elevated vs. its level of 3.54% at the start of the year. Equity ETFs have not yet seen any significant inflows, suggesting that ETF investors have done little in actively reversing the almost $30bn of equity ETFs sold over the previous two months. CTAs, which have been partly responsible for this year’s selloff, are still short equities and they have only covered a third of the short position they opened in January. In contrast, Discretionary Macro hedge funds, Equity L/S, risk parity funds and balanced mutual funds, appear to be modestly long equities, so they are currently benefitting from the equity rally.

Is it possible that the short squeeze can take the S&P another 100 points higher, reaching Goldman's 2016 year-end target even as GAAP EPS have crashed to just over 90, and which would mean that the market when valued on a GAAP basis would be at 22x earnings and the most expensive it has ever been? Of course it is, even if that will make the S&P500 the most overbought, and overvalued in history, and just ripe for the next wave of short selling.
So for all those eager to short the S&P but unsure when to do it, keep an eye on the SPY short interest and CTA net exposure. Breakout failures would mean this week's roundhouse punch to the face of market shorts may be as bad as it gets.
On the other hand, if the covering momentum is only just starting, and now it is the ETFers and CTA's turn to pick up the baton, the next move higher in this bear market squeeze could easily take the S&P500 to new all time highs.
http://www.zerohedge.com/news/2016-03-05/most-painful-part-short-squeeze-may-be-yet-come-jpm-warns
The Nine Horsemen Of The US Recession Apocalypse
March 5, 2016
"There are no signs of a US recession anytime soon"... apart from these nine charts that is..

Of course, even The Fed is forced to admit that recession probabilities are rising fast...

How This Default Cycle Is Different: Record Low Recovery Rates
03/03/2016
At the end of January, when looking at some recent liquidating energy companies selling off their assets in "stalking horse" bankruptcy auctions, we found something disturbing: total recovery rates under liquidation of oil and gas companies were paltry, ranging anywhere between 5 and 20 cents on the dollar, and averaging a little under 15 cents.

While we had a rather limited universe of cases we made the following observation: "these bankruptcy auctions confirm recoveries on existing debt will be paltry, and based on our limited dataset, average to roughly 15 cents on total debt exposure, which includes both secured and unsecured debt."
A few months later we have a more complete data set and we can confirm that it is indeed the case that one novel feature about this particular default cycle are the record low recovery rates on bankrupt bonds.
First, here are some thoughts from JPM's Peter Acciavatti, who first notes the dramatic surge in default volume which in February soared to a four-year high:
Default activity increased notably in February, as eight companies defaulted totaling $9.3bn in high-yield bonds ($8.5bn) and leveraged loans ($766mn). This month’s activity marked the highest number of defaults since nine companies defaulted in August 2009 and the highest monthly volume since November 2011’s $9.5bn (excluding 2014’s defaults of TXU and CZR in April and December, respectively). By comparison, five companies defaulted totaling $5.25bn in January, which followed five defaults totaling a 2015-high $8.2bn in December and three defaults totaling $5.26bn in November. Default activity has picked up over the last several months, as February marked the fourth consecutive month of greater than $5bn in default volume, and the sixth $5bn month over the past nine. Further evidencing the recent pick up in activity, an average of $5.4bn has defaulted per month over the last seven months, compared with a $2.1bn average over the prior seven months and a modest $1.6bn monthly average from 2010 through 2014 (ex-TXU and CZR). Year to date, 13 companies have defaulted totaling $14.6bn in bonds and loans, compared with five defaults and $4.4bn during the first two months last year. As a reminder, 37 companies defaulted totaling $37.7bn in bonds ($23.6bn) and loans ($14.1bn) in full-year 2015, the sixth highest total on record and the second highest total since the credit crisis, behind FY14’s 27 defaults and $69.9bn

None of this is surprising: the default onslaught is by now well known, and the fact that it has so far remained isolated to the energy sector is the reason for the recent junk bond euphoria across other industries. Just yesterday, Credit Suisse wrote that "speculative bonds default rate reached a 6yr high of 3.3% in February. However, if you exclude energy, the US HY default rate actually went to 2.2% in Feb from 2.4% in January. This tells us that the market contagion is not translating (yet) into default contagion. Our high yield group compared it to the 2002 TMT blow-up (WCOM) , when everything sold off very hard but the defaults were confined to TMT."
Others, however, such as UBS' Matthew Mish have disagreed:
... while there may not be another 'energy' sector this cycle, our proverbial list of candidates includes lower quality high yield (ex-commodities) and commercial real estate (CRE). More broadly, the OCC's own examiners would also likely add asset-backed and auto loans to the list. The stark conclusions these credit officers draw with respect to the massive easing of credit standards due to competitive pressures seems clear enough – but unfortunately they seem to largely fall on deaf ears.
Whether or not Credit Suisse, and the recent influx of record retail fund flows into junk is right...
Whether or not Credit Suisse, and the recent influx of record retail fund flows into junk is right...

... or just a momentary bout of euphoria, remains to be seen and is largely irrelevant for the time being. What matters far more is what else Acciavatti writes further on in his latest weekly default report: it confirms what we first observed over a month ago.
Recovery rates in 2016 are extremely low... for high-yield bonds, the recovery rate YTD is 10.3% (10.5% senior secured and 0.5% senior subordinate), which is well below the 25-year annual average of 41.4%. Final recovery rates in 2015 for high-yield bonds were 25.2%, compared with recoveries of 48.1%, 52.7%, 53.2%, 48.6%, and 41.0% in full-years 2014, 2013, 2012, 2011, and 2010, respectively. Notably, average recoveries for Energy and Metals/Mining bonds were 18.3% and 20.0%, respectively, which weighed down overall high-yield recovery rates. Excluding the troubled commodity sectors, high-yield recoveries were a more respectable 46.1% (32.1% Ex-Energy only). As for loans, recovery rates for first-lien loans thus far in 2016 are 24.5%, compared with their 18-year annual average of 67.2%. Final 2015 1st lien recoveries were 48.2%, while average recoveries for Energy and Metals/Mining 1st lien loans were 44.1% and 38.4%, respectively.
The record collapse in recovery rates is shown below.
It is not just JPM who points out what we first noticed in January: in an interview with Goldman's Allison Nathan, credit guru Edward Altman reiterates that same warning, although he focuses on the 2015 recovery rate which already is more than two times higher than that seen in 2016 defaults:
Allison Nathan: What is your view on recovery rates?
Edward Altman: Our approach to recovery rates is not centered on sectors. What we’ve looked at carefully over 25 years is the correlation between default rates and recovery rates. As you would expect, when the former rise to high or above-average levels, you always observe the latter dropping to below-average levels. This strong inverse relationship is as much a function of supply and demand as it is of company fundamentals. So if we are expecting a higher default rate in 2016 and even 2017, then we would expect a lower recovery rate. Already in 2015, the recovery rate dropped dramatically relative to 2014 even though the default rate was below average; we saw a 33-34% recovery rate versus the historical average of 45%, measured as the price just after default. This is primarily due to the heavy concentration of energy companies whose recovery rates depend on their ability to liquidate their assets at reasonable prices, which in turn depends on the price of oil. Low oil prices have pushed recovery rates in the energy sector below 25% and even into the single digits for some companies. And that’s going to continue. So this year I expect recovery rates much below average, producing a double-whammy of high default rates and low recovery rates for credit investors.
So why do recovery rates matter? Simple: they determine the exit IRR calculation for distressed investors in the case of a bankruptcy.
A simple analysis on the importance of how recovery rates play into purchase assumptions was made once again by UBS' Matt Mish three weeks ago, when he calculated at what yield bond investors should start to buy the numerous distressed opportunities. This is what he said:
In our 2016 US high yield outlook we posited there is one central question that will dictate the outlook for high yield: will credit markets be able to absorb refinancing needs of almost $1tn stressed and distressed credit. And we continue to believe this should be THE debate in the market. In our view, if the lower quality rung of the market cannot stabilize the balance of risks is for contagion to spread further. So what is the clearing level for what we believe is upwards of $750 - 1tn in stressed credit? First, investors will require compensation for loss risks; cohorts of triple Cs typically experience 5yr cumulative default rates of 55 - 65% near the end of the cycle, implying half of the universe defaults before the end of year 5 and no longer pay coupons. Assuming recovery rates of 35% an investor should require roughly 12% yield to compensate for loss risks alone...
Further, although our prior analysis assumes hold-to-maturity, investors will need to be compensated for the fact that illiquidity may prevent them from selling when needed. Bottom line, our conversations with investors suggest yields in the 20 – 25% context could be attractive enough to draw in marginal capital – although several investors noted that is reasonable for triple C risk excluding commodities. In short, we're not there yet.
Keeping everything constant, and assuming these new, if not improved, record low recovery rates, what it means is that for Mish' analysis to hold, the yield required to compensate for loss risks doubles to over 20%, while the all-in liquidity risk analysis moves the 20-25% yield threshold to over 30%, if not 40% if one indeed is expected to recover 10 cents on the dollar in the upcoming default wave.
That record lower recovery rate also explains what we discussed earlier, namely the desire of banks to force an equity short squeeze in energy stocks, so these distressed names are able to issue equity with which to repay secured loans to banks who are scrambling to get out of the capital structure of distressed E&P names. Or as MatlinPatterson's Michael Lipsky put it: "we always assume that secured lenders would roll into the bankruptcy become the DIP lenders, emerge from bankruptcy as the new secured debt of the company. But they don't want to be there, so you are buying the debt behind them and you could find yourself in a situation where you could lose 100% of your money."
And so, one by one the pieces of the puzzle fall into place: banks, well aware that they are facing paltry recoveries in bankruptcy on their secured exposure (and unsecured creditors looking at 10 cents on the dollar), have engineered an oil short squeeze via oil ETFs...
... to push oil prices higher, to unleash the current record equity follow-on offering spree...
... to take advantage of panicked investors who are desperate to buy the new equity issued. Those proceeds, however, will not go to organic growth or even to shore liquidity but straight to the bank to refi loan facilities and let banks, currently on the hook, leave silently by the back door. Meanwhile, the new investors have no security claims and zero liens, and are in fact at the very bottom of the capital structure, face near certain wipe outs.
In short, once the current short squeeze is over, expect everyone to start paying far more attention to recovery rates and the true value of "fundamentals."
http://www.zerohedge.com/news/2016-03-03/how-default-cycle-different-record-low-recovery-rates
The Deep State——Malodorous, Malevolent, and Malignant—— Is Coming for Your Savings
by Bill Bonner • March 1, 2016
Rig Plunge
Is there really a “War on Cash”? No. There’s a war on you. We’ll come back to that in a minute… First, a quick roundup of last week’s action. Friday brought more bad news for U.S. shale oil producers. (More on this below in today’s Market Insight.) Reports Bloomberg:
“The number of rigs drilling for oil and gas in the U.S. is plunging toward the lowest level in more than 75 years of records… culminating in the collapse of almost 75 percent of the rig count.”

The fracking boom towns are now turning into ghost towns. The billions of dollars of investment (the industry has never been cash positive) have stopped flowing into the U.S. shale producers. Revenues (such as they are) have slowed to trickle on a cold day.
And in the tech sector, Yahoo is paying the price for its buying spree. It’s one of the 11 companies that, according to USA TODAY, “lost obscene sums” of money last year:
“There are 11 companies in the broad Russell 3000 index, including a whole host of energy companies like Apache but also industrial conglomerate General Electric and struggling online portal Yahoo, that have reported staggering net losses in the just-completed calendar year…
Each of these companies reported net losses of $4 billion or more last year – dwarfing even the impressive $1 billion net loss reported Thursday by struggling retailer Sears.”

Yahoo, monthly. The stock was a darling of the late 90s internet bubble and remains about 75% below its year 2000 peak (although it is up nearly 500% from its 2002/3 low, and more than 200% from its 2012 low) – click to enlarge.
Pile of Manure
But let us return to the War on Cash. It is far more sinister than you might realize. Several countries – such as Denmark, Sweden, and Norway – are already almost totally cashless.
Others, such as France, have banned cash transactions over certain amounts. There are even plans at the highest levels of the Indian government – right now one of the most cash dependent societies in the world – to “disincentivize” using cash.
Meanwhile, establishment economists and commentators – most notably Harvard economists Larry Summers and Kenneth Rogoff, Citibank chief economist Willem Buiter, Andy Haldane at the Bank of England, and Martin Wolf at the Financial Times – have come out in favor of a cashless society.
As we recently reported, Summers tells us it’s “time to kill the $100 bill.” And according to the New York Times, “Getting Rid of Big Currency Notes Could Help Fight Crime.”
Today, we dig a little deeper into this pile of manure to try to find out what it hides. And what a surprise! There is the Deep State – malodorous, malevolent, and malignant.

Summers, Rogoff, Buiter, Haldane and Wolf – a truly insufferable collection of statist bien pensants
Banning Ben Franklins
First, let us dispose – as we would a dirty diaper with an outstretched arm – of the notion that getting rid of Ben Franklins and other large denomination bills would somehow “fight crime.”
If you want to do a $100,000 cash deal now, you need a stack of $100 bills a little more than four inches high. Now suppose the $100 bill is no longer available. Does the drug dealer say to his client, “Whoa, I guess we can’t do business. I can’t be bothered to carry big wads of cash.”?
Does the crony defense contractor meet a member of the House Armed Services Committee in the parking garage and tell him, “I’m sorry, I just can’t get you the money. It won’t fit in the envelope.”? Does the prostitute tell her pimp: “I don’t work for 20s.”?
Don’t worry about the criminals. In Argentina, the backbone of the economy is the 100-peso note – worth only about $6. We have a place in Argentina. We’ve seen how it works. People use 100-peso notes for everything – from buying the morning paper to selling $1 million apartments.
They carry it around in paper bags (so as not to attract attention of thieves.) They stash it in safes. Stacks of it bulge from their pants pockets and sit on the counters of the black market money changers. A nuisance? Yes. A crime stopper? Are you kidding?
Drug sellers, prostitutes, hit men, terrorists, money launderers. They’re already hunted like criminals… and threatened with fines, jail, or death. Is the inconvenience of small denomination bills going to stop them?
Forget it. They’ll switch to smaller bills, foreign currencies, Bitcoin, gold, or something else. Block the use of convenient currency… and they’ll innovate.
A Savings “Tax”
How about the idea that banning cash will help the economy? With cash harder to come by, it will be easier for central bankers to impose a negative interest rate on your bank deposits. Without the option of holding your savings in physical currency, you’ll have no choice but to keep your money on deposit in the bank… and pay to save.
But a negative interest rate is just another tax… one that is imposed by employees of the banking industry cartel and that needs no vote in Congress. At a negative rate of 1%, you lose $10 for every $1,000 of savings. This is the same as a 1% “savings tax.”

The black hole of NIRP – ultimately, it’s just another tax
But hold on… Raising taxes does not normally cause people to spend money. It causes them to zip up their purses, not open them. Taking away your money leaves you with less of it. (Duh!) You have to cut back. And if you are saving for your retirement, a tax on your savings means you will have to save more (and spend less) of what you earn.
There is no evidence anywhere in the historical record of an economy helped by taking money away from people. The idea is so absurd it could only come from a PhD economist… or a scoundrel. But to fully understand it… we need to go back hundreds of years.
http://davidstockmanscontracorner.com/the-deep-state-malodorous-malevolent-and-malignant-is-coming-for-your-savings/
How The U.S. Government And HSBC Teamed Up To Hide The Truth From A Pennsylvania Couple
Mike Krieger
via Liberty Blitzkrieg blog
Mar. 3, 2016
The reason both the Democratic and Republican establishments are in full on panic mode about the rise of Donald Trump and Bernie Sanders is a deep seated fear that the plebs have finally woken up.
Democrats rail against big corporations, while Republicans rail against big government. This scheme has been used to successfully divide and conquer the public for decades while big government and big business successfully schemed to divert all wealth and power to an ever smaller minuscule segment of the population — themselves.
It took awhile, but the people are finally starting getting it and they are royally pissed off. One of the primary mechanisms for this historic elite theft has been the creation of a two-tiered justice system in which the rich, powerful and connected are never prosecuted for their criminality. Instead, the government actively protects them by pretending corporate entities commit crimes as opposed to individuals. Of course, this is impossible, but yet it’s how the government handles white collar crime. The Orwellian named “Justice Department” casually utilizes deferred prosecution agreements (DPAs), in which companies pay a little fine and the criminals themselves walk away with not just their freedom, but ill gotten monetary gains as well.
Nowhere is this most apparent than when it comes to the big banks. The individuals who work at these criminal cartels can literally do anything they want with total impunity. One of the most egregious examples of this was the $1.9 billion settlement arranged with HSBC for laundering Mexican drug cartel money and dealing with sanctioned countries. If you or I did this we’d be sitting in a concrete box eating porridge through a straw for the rest of our lives, but when “masters of the world” at big banks do it, the parent company just pays a slap on the wrist fine and life goes on. That’s how oligarch justice works.
Although the Department of Justice and HSBC thought the money laundering case was settled ancient history, a determined chemist from Pennsylvania is throwing a wrench into their plans and it could have major implications.
The Wall Street Journal reports:
WEST CHESTER, Pa.—When Dean Moore ran into roadblocks with a request for mortgage relief, he did what many people do: He sat down at his kitchen table to bang out an angry letter.
The letter has thrust Mr. Moore, a chemist, and his wife, Ann Marie Fletcher-Moore, a part-time bookstore manager, into a high-stakes battle over whether HSBC Holdings PLC must release a secret report on its compliance with a $1.9 billion money-laundering settlement.
A “secret” report. You’ve got to be kidding me.
The disclosure would be the first ever for this type of case and would shine a light on an increasingly common practice for banks accused of breaking the law. Instead of being prosecuted, banks typically enter into settlements under which they often agree to be overseen by monitors whose detailed judgments are kept secret. Judge Gleeson’s order has the potential to dial back that confidentiality, opening a new channel of information that prosecutors say could threaten the viability of such settlements in future cases.
If you don’t get by now that America is a banana republic, there’s little hope for you.
HSBC and Justice Department prosecutors have opposed the release, saying it wouldn’t do much to help Mr. Moore with his mortgage predicament. Judge Gleeson, in his order to unseal the report, said that was irrelevant.
Big banks and the U.S. government are simply 100% in bed together. Constantly scheming to prevent citizens from learning the truth.
The bank is appealing the ruling, but already it may be having an impact. HSBC disclosed last week that the January report by independent monitor Michael Cherkasky found instances of potential financial crime and had “significant concerns” about the bank’s pace of progress in complying with the money-laundering settlement.
A legitimate government that cared about the people would want the public to know this, but not the U.S. government.
The Moores say the experience has been surreal. The couple lives in this Philadelphia suburb with their four children, two dogs and a 15-year-old rabbit and had never spent much time in court other than for jury duty. They have nevertheless held their own against a phalanx of lawyers from the British bank and the Justice Department. A recent hearing in a Brooklyn federal court “was like ‘Law and Order,’” said Mrs. Fletcher-Moore, who is 50 years old.
HSBC admitted in its 2012 settlement that it failed to catch at least $881 million in drug-trafficking proceeds laundered through its U.S. bank and that its staff stripped data from transactions with Iran, Libya and Sudan to evade U.S. sanctions.
The mortgage was administered by HSBC, and the Moores say they wrote to the bank starting in 2008 asking it to temporarily lower the 7% interest rate. They said the lender appeared receptive, only for its representatives to misplace documents needed to complete their application for a loan modification several times.
Frustrated, the Moores researched the bank online last year and stumbled upon news of the money-laundering settlement and the monitor’s secret report. The Moores say they believe the report details faulty internal controls like those they encountered when trying to modify their loan.
If his ruling stands, it would be “the first time we get to see what happens after a bank settles a prosecution,” said Brandon Garrett, a professor at University of Virginia’s law school who has studied the monitor system.
Which is exactly what the U.S. government doesn’t want people to see.
HSBC and the Justice Department are still fighting to keep the report private and have appealed Judge Gleeson’s ruling to the Second Circuit Court of Appeals. An appeals court ruling could be months away. “I feel like a very small boat in a very large ocean,” Mr. Moore wrote at one point, in a letter responding to some of their arguments.
Just another day in the…

http://www.zerohedge.com/news/2016-03-02/how-us-government-and-hsbc-teamed-hide-truth-pennsylvania-couple
Central Bankers Admit that Central Banks Have Failed to Fix the Economy
Mar 3, 2016
Between 2008 and 2015, central banks pretended that they had fixed the economy.
In 2016, they’re starting to admit that they haven’t fixed much of anything.
The current head of the Bank of England (Mark Carney) said last week:
The global economy risks becoming trapped in a low growth, low inflation, low interest rate equilibrium. For the past seven years, growth has serially disappointed—sometimes spectacularly, as in the depths of the global financial and euro crises; more often than not grindingly as past debts weigh on activity ….
This underperformance is principally the product of weaker potential supply growth in virtually all G20 economies. It is a reminder that demand stimulus on its own can do little to counteract longer-term forces of demographic change [background] and productivity growth.
***
In most advanced economies, difficult structural reforms have been deferred [true, indeed]. In parallel, in a number of emerging market economies, the post-crisis period was marked by credit booms reinforced by foreign capital inflows [including from central banks themselves], which are now brutally reversing….
Since 2007, global nominal GDP growth (in dollars) has been cut in half from over 8% to 4% last year, thereby compounding the challenges of private and public deleveraging ….
Renewed appreciation of the weak global outlook appears to have been the underlying cause of recent market turbulence. The latest freefall in commodity prices – though largely the product of actual and potential supply increases – has reinforced concerns about the sluggishness of global demand.
***
Necessary changes in the stance of monetary policy removed the complacent assumption that “all bad news is good news” (because it brought renewed stimulus) that many felt underpinned markets [Zero Hedge NAILED it].
***
As a consequence of these developments, investors are now re-considering whether the past seven years have been well spent. Has exceptional monetary policy merely bridged two low-growth equilibria? Or, even worse, has it been a pier, leaving the global economy facing a global liquidity trap? Can more time be purchased? If so, at what cost and, most importantly, how would that time be best spent?
***
Despite a recent recovery, equity markets are still down materially since the start of the year. Volatility has spilled over into corporate bond markets with US high-yield spreads at levels last seen during the euro-area crisis. The default rate implied by the US high-yield CDX index is more than double its long-run average [background here and here]. And sterling and US dollar investment grade corporate bond spreads are more than 75bp higher over the past year.
Similarly, the former head of the Bank of England (Mervyn King) is predicting catastrophe:
Unless we go back to the underlying causes [of the 2008 crash] we will never understand what happened and will be unable to prevent a repetition and help our economies truly recover.
***
The world economy today seems incapable of restoring the prosperity we took for granted before the crisis.
***
Further turbulence in the world economy, and quite possibly another crisis, are to be expected.
***
Since the end of the immediate banking crisis in 2009, recovery has been anaemic at best. By late 2015, the world recovery had been slower than predicted by policymakers, and central banks had postponed the inevitable rise in interest rates for longer than had seemed either possible or likely.
There was a continuing shortfall of demand and output from their pre-crisis trend path of close to 15pc. Stagnation – in the sense of output remaining persistently below its previously anticipated path – had once again become synonymous with the word capitalism. Lost output and employment of such magnitude has revealed the true cost of the crisis and shaken confidence in our understanding of how economies behave [Right].
***
Almost every financial crisis starts with the belief that the provision of more liquidity is the answer, only for time to reveal that beneath the surface are genuine problems of solvency [We told you].
A reluctance to admit that the issue is solvency rather than liquidity – even if the provision of liquidity is part of a bridge to the right solution – lay at the heart of Japan’s slow response to its problems after the asset price bubble burst in the late 1980s, different countries’ responses to the banking collapse in 2008, and the continuing woes of the euro area.
Over the past two decades, successive American administrations dealt with the many financial crises around the world by acting on the assumption that the best way to restore market confidence was to provide liquidity – and lots of it.
Political pressures will always favour the provision of liquidity; lasting solutions require a willingness to tackle the solvency issues.
Former Federal Reserve chairman Alan Greenspan said today that the Dodd-Frank financial bill didn’t fix anything [d’oh!], that we’re in real trouble, and that he’s been pessimistic for a long time;
We’re in trouble basically because productivity is dead in the water…Real capital investment is way below average. Why? Because business people are very uncertain about the future.
The [Dodd-Frank] regulations are supposed to be making changes of addressing the problems that existed in 2008 or leading up to 2008. It’s not doing that. “Too Big to Fail” is a critical issue back then, and now. And, there is nothing in Dodd-Frank which actually addresses this issue.
***
I haven’t been [optimistic on the economy] for quite a while.
And the world’s most prestigious financial agency – called the “Central Banks’ Central Bank” (the Bank for International Settlements, or BIS) – has consistently slammed the Fed and other central banks for doing the wrong things and failing to stabilize the economy.
If the central bankers’ words aren’t clear enough for you, their actions reveal their desperation.
Art Berman Sees Oil Heading To $16, Will Lead To "Banking Bloodbath"
Mar 1, 2016
As Nate Hagens noted, "people think that the economy runs on money but it runs on energy," and as Art Berman details in the following interview how the current oil price collapse represents devaluation from over-investment in unconventional oil - and most commodities - because of cheap capital, and is simply a classic bubble. "Continued oil prices of $30 per barrel or less are the only reasonable path to higher growth and a balanced oil market," Berman contends, adding that he expects $16.50/bbl - "I think we're gonna get there." Berman concludes ominously, we're not going 'back' to anything - "Normal is over, and there is no new normal yet."
Full Art Berman interview below (via Macro Voices):(BELOW at END OF POST)
18:25 - OPEC will cut production in 2016
19:05 - OPEC’s objective is to kill shale drillers’ source of funding
19:30 - The idea that Iraq/Iran will cooperate with Saudi Arabia is laughable
22:30 - EIA/IEA numbers are estimates at best, and almost certainly wrong
24:00 - He doesn’t believe recent EIA figures saying consumption has fallen dramatically
24:40 - US production must drop in a more meaningful way before OPEC can affect crude price
27:00 - Baker Hughes Rig Count is only focused on by traders because it’s available data, not because it matters
29:00 - Regardless of rig count, regardless of what people think, the number of producing wells continues to increase!
31:30 - US production not necessarily in direct competition with Iranian production
33:15 - As long as storage numbers are 80% of capacity or more, prices will remain “crushed”
35:45 - Forget about the nonsense that you read in the WSJ about “the true breakeven price” for shale operators - the true breakeven price for the best operators in the 3 main US shale plays is $60-70/bbl
38:40 - These shale operators “have no money”
39:00 - If investors abandon shale company stock, their total assets decline and their debt is in trouble
40:45 - Pretty obvious to anyone who knows that this situation is going to crash in a big way, it’s just a question of when
40:55 - Similar situation to “The Big Short”
44:40 - Very few options beyond increasing Cushing storage capacity, which takes time
46:30 - Whiting Petroleum clearly out of money, made a terrible acquisition, and is stopping further drilling because they have no other option. They could care less about the shareholders and are acting out of desperation.
48:05 - Midwestern gasoline refineries cutting back on crude purchases as they don’t see sufficient demand
50:00 - $16.50/bbl - “I think we’re gonna get there”
52:35 - Capital providers clearly pulling back from investing in US tight oil projects
53:00 - Future investments in the Oil Sands are dead
54:05 - In the first half of 2016 there will be a wave of shale operator bankruptcies and defaults on bond payments, a collapse in the high yield bond market which could spill over into other markets, as well as further distress in the banking industry - “will be a bloodbath”
55:00 - 2016 shale operator bankruptcies could reach 50%
57:00 - Iran will not get back to 1970’s levels as they would like to suggest. Production levels will be far less.
58:45 - Libya is the wild card. If they ever get their civil unrest under control, they could bring 1.5MMbbl/day to market and “that would be a disaster(for oil prices)”
1:04:15 - We’re not going back to anything - “Normal is over, and there is no new normal yet”
Source: MacroVoices.com
* * *
And finally Art Berman's Presentation:
http://www.macrovoices.com/embedcode/MacroVoices-2016-02-25-Art-Berman.txt
"We're In Trouble": Alan Greenspan Delivers Stark Warning
Mar. 1, 2016
Were you wondering what Alan Greenspan thinks about the outlook for monetary policy across the globe?
Neither were we, but Bloomberg was and Tom Keene and Mike McKee got the “privilege” of sitting down with the “maestro” on Monday afternoon to discuss a variety of topics including NIRP, which Greenspan says “warps investment behavior.”
While he isn’t willing to go so far as to condemn negative rates as “dangerous,” he does say the global race to the proverbial Keynesian bottom is “counterproductive.”
As far as the US economy is concerned, Greenspan isn’t optimistic. “We’re in trouble basically because productivity is dead in the water…Real capital investment is way below average. Why? Because business people are very uncertain about the future.”
Well yes, they most certainly are. Of course were it not for “the Greenspan put” and decades of policy largesse we might not have ever had a financial crisis in the first place (David Stockman will tell you all about Greenspan’s role in creating the conditions we now find ourselves in).
As for whether Dodd-Frank has solved anything, Greenspan says no: "The regulations are supposed to be making changes of addressing the problems that existed in 2008 or leading up to 2008. It's not doing that. 'Too Big to Fail' is a critical issue back then, and now. And, there is nothing in Dodd-Frank which actually addresses this issue."
And finally, here’s the punchline.
Asked whether he’s optimistic going forward, Greenspan said this: "No. I haven't been for quite a while. And I won’t be until we can resolve the entitlement programs. Nobody wants to touch it. And that is gradually crowding out capital investment, and that's crowding out productivity, and it's crowding out the standards of living where do you want me to go from there."
Now if only he hadn't gotten us into this mess in the first place...
http://www.zerohedge.com/news/2016-03-01/were-trouble-alan-greenspan-delivers-stark-warning
Worst Global Economic Data In 4 Years Sparks Stocks Best Day In 6 Months
Mar 1, 2016
Worst global economy since 2012...

(extensive charts and graphs continue here;)
http://www.zerohedge.com/news/2016-03-01/worst-global-economic-data-4-years-sparks-stocks-best-day-6-months
The Great Corporate Earnings Fraud
Jim Quinn
The Burning Platform blog
Mar. 1, 2016
“What are the odds that people will make smart decisions about money if they don’t need to make smart decisions–if they can get rich making dumb decisions? The incentives on Wall Street were all wrong; they’re still all wrong.” ? Michael Lewis, The Big Short: Inside the Doomsday Machine
Corporate earnings reports for the fourth quarter are pretty much in the books. The deception, falsification, accounting manipulation, and propaganda utilized by mega-corporations and their compliant corporate media mouthpieces has been outrageously blatant. It reeks of desperation as the Wall Street shysters attempt to extract the last dollar from their muppet clients before this house of cards collapses.
The CEOs of these mega-corporations accelerated their debt financed stock buybacks in 2015 as stock prices reached all-time highs and are currently so overvalued, they will deliver 0% returns over the next decade. This disgraceful act of pure greed by the Ivy League educated leaders of corporate America to boost their own stock based compensation is reckless and absurd.
It is proof education at our most prestigious universities has produced avaricious MBAs following financial models and each other like lemmings going over the cliff. Proof of their foolishness is self evident after perusing the chart below. These intellectual giants evidently never learned the basic rule of buying low and selling high in order to make a profitable trade.
The previous all-time high in stock buybacks occurred in 2008 at the previous peak. That brilliant strategy led to 50% shareholder losses in a matter of months. No Board of Directors fired any CEO for these disastrous strategic blunders. These cowardly ego maniacs didn’t buy back any stock in 2009 and 2010 when they could have made a killing with valuations at decade lows. After the stock market recovered by 100%, these stooges then began borrowing and buying. It has now reached another all-time high crescendo.

Dividends and stock buybacks in 2015 topped $1 trillion for the first time according to S&P Capital IQ Global Markets Intelligence. As CEOs have borrowed billions to buyback their inflated overvalued stock, they have put the long-term sustainability of their firms at extreme risk.
When a dead retailer walking like Macy’s, which is seeing it’s sales fall and profits crater by 30%, announces a $1.5 billion stock buyback when it already is weighed down with $7 billion in debt, you realize the men running these companies have no common sense or concern for the long-term viability of their companies. They’ll get a golden parachute no matter how badly they screw the pooch.
The stock buyback scheme by corporate CEOs is just one of the devious methods used to cover-up the dramatic downturn in corporate profits. These titans of industry, their Wall Street heroin dealers, and their corporate propaganda outlets need cover while they abscond with more of the nations wealth, before pulling the rug out from beneath the American people once again.
The 2008 Wall Street created financial crisis will look like a walk in the park compared to what’s coming down the pike now. We now have a bond bubble, stock bubble, housing bubble, commercial real estate bubble and central banker confidence bubble all poised to pop simultaneously. The negative interest rate and banning of cash schemes will be dead on arrival, driving a stake into the heart of the Fed vampire.
It’s become perfectly clear to me over the last few weeks the deception, misdirection, spin, and outright accounting fraud being used to hide the horrific financial results of S&P 500 companies has been orchestrated by the corporations, Wall Street “analysts” and the likes of cheerleaders like CNBC.
When “dead retailer walking” J.C. Penney reported their fourth quarter results last week the stock immediately soared 15%. The Wall Street propaganda machine was declaring turnaround complete. Modest positive comp store sales after five years of double digit declines were proof J.C. Penney was back. I went to the company press release and no matter how hard I searched, they never mentioned their Net Income. They blathered on about EBITDA and adjusted earnings per share, but not a peep about the actual GAAP Net Income.
Once I was able to access their Income Statement I realized why. Their completed turnaround resulted in a $131 million 4th quarter loss, almost $100 million higher than last year’s loss. They finished their turnaround year with a loss of more than a half BILLION dollars. This company will be on the retail scrap heap of history in a couple years, but the Wall Street fleecing machine tells its muppet clients to buy, buy, buy. And the lemmings do as they are told.
The other blatant manipulation and spin is headline after headline stating one company after another beat expectations. What you are not told is expectations at the beginning of the quarter were 20% higher than they were on the day they reported. The highly paid 30 year old MBA “analyst lemmings” are told by the companies to reduce earnings expectations as the quarter progresses.
Sometimes they pre-announce earnings will fall by 20% to $0.45 per share, then three weeks later announce actual results of $0.46 per share, therefore beating expectations. This game is getting long in the tooth. Corporate revenues have been falling for a number of quarters, and they have run out of accounting reserves to make the numbers. So they move on to plan C.
If you can’t make the numbers work, just fake the numbers and call them “adjusted”. So when a corporate CEO opens 50 retail stores that turn out to be dogs and is eventually forced to close the stores and fire 10,000 employees, they just call those one time charges and ignore the $50 million loss when reporting the results. Heads the CEO wins, tails the shareholders lose. Wall Street reports a beat, and the clueless investors believe the lies. It’s all fun and games until the next financial crisis hits, recession sweeps across the land, and the fraud, deception, and lies are revealed.
Even the billionaire oligarch crony capitalist Warren Buffett addressed this despicably flagrant flaunting of basic accounting principles to mislead shareholders in his annual letter last week:
It has become common for managers to tell their owners to ignore certain expense items that are all too real. “Stock-based compensation” is the most egregious example. The very name says it all: “compensation.” If compensation isn’t an expense, what is it? And, if real and recurring expenses don’t belong in the calculation of earnings, where in the world do they belong?
Wall Street analysts often play their part in this charade, too, parroting the phony, compensation-ignoring “earnings” figures fed them by managements. Maybe the offending analysts don’t know any better. Or maybe they fear losing “access” to management. Or maybe they are cynical, telling themselves that since everyone else is playing the game, why shouldn’t they go along with it. Whatever their reasoning, these analysts are guilty of propagating misleading numbers that can deceive investors…. When CEOs or investment bankers tout pre-depreciation figures such as EBITDA as a valuation guide, watch their noses lengthen while they speak.
Buffett’s words are borne out in the chart below. Based on fake reported earnings per share, the profits of the S&P 500 mega-corporations were essentially flat between 2014 and 2015. Using real GAAP results, earnings per share plunged by 12.7%, the largest decline since the memorable year of 2008. Despite persistent inquiry it is virtually impossible for a Wall Street outsider to gain access to the actual GAAP net income numbers for all S&P 500 companies. With almost $500 billion of shares bought back in 2015, the true decline in earnings is closer to 15%.
Someone Isn't "Buying" This Rally: The "Smart Money" Sells For Five Consecutive Weeks As Buybacks Soar
Mar. 1, 2016
Many are trying to put their finger on what has precipitated today's breakout rally.
On one hand you have Reuters, saying that it is due to economic data which was so poor it "spurred stimulus hopes"...

... and then you have the sober voices who say it was all Gartman's doing, who as we reported today, after flopping bullish on Friday, flipped back to bearish overnight as we noted first thing this morning in a warning to the bears in "Today's Rally Explained: Gartman Is Again "Selling The Markets Short" Just Two Days After Turning Bullish."
But no matter what unleashed today's algo buying spree, one thing is clear: someone has to be buying and someone has to be selling into what, Investech yesterday explained, is the latest bear market rally.
Thanks to Bank of America we know the answer to both.
It turns out that the three groups that make up the so-called smart money, hedge funds, BofA's institutional clients as well its private clients, have been selling aggressively every week. In fact, as BofA's Jill Hall explains, "last week, during which the S&P 500 climbed 1.6%, BofAML clients were net sellers of US stocks for the fifth consecutive week, in the amount of $1.5bn. This was the biggest weekly outflow since mid-December.
Hedge funds, institutional clients, and private clients alike were net sellers last week, led by hedge funds. All three groups are also now net sellers on a cumulative basis year-to-date (again, led by hedge funds). Net sales were chiefly in large caps last week, though small caps also saw outflows. Mid-caps have seen inflows for ten of the last twelve weeks, and as we recently noted, have seen the most consistent buying by our clients over the last several years despite being crowded and expensive.
This is summarized in the charts below:


Ok, we know the sellers. So who were the buyers? The answer is well-known:
Buybacks by our corporate clients accelerated last week, and year-to-date are tracking above levels we saw over the same period last year. The four-week average trend for buybacks by corporate clients suggests a pick-up in overall buybacks in 4Q relative to 3Q. Buybacks have been picking up again in 2016 (Chart 24)

In other words, buybacks are on pace to surpass buyback records, and since the debt issuance pipeline has to be unclogged or else risk the failure of hundreds of billions in bond bond refinancings in the coming months not to mention the collapse of the bond-buyback pathway, companies have scrambled to put a "risk on" mood on the market by repurchasing their stock, so that these same companies can issue more debt, so that they can buyback even more debt in the future.
In other words, buybacks are on pace to surpass buyback records, and since the debt issuance pipeline has to be unclogged or else risk the failure of hundreds of billions in bond bond refinancings in the coming months not to mention the collapse of the bond-buyback pathway, companies have scrambled to put a "risk on" mood on the market by repurchasing their stock, so that these same companies can issue more debt, so that they can buyback even more debt in the future.
http://www.zerohedge.com/news/2016-03-01/someone-isnt-buying-rally-smart-money-sells-five-consecutive-weeks-buyback-soar
The Two-Party Illusion
Mar 1, 2016
by Jeff Thomas
via InternationalMan.com
“There is nothing which I dread so much as a division of the republic into two great parties, each arranged under its leader, and concerting measures in opposition to each other. This, in my humble apprehension, is to be dreaded as the greatest political evil.” - John Adams
The Great Illusion of the two-party system is that it allows the voter a choice – usually between a liberal and a conservative government. The reality is that, whichever party wins the election, the government is, in truth, a totalitarian one. The “choice” is a mere distraction from the true objective.
Recently, an American college student, Justin Snyder, commented on his choice for his country’s next president and his reasons for it. Mister Snyder said, in part,
"I support Hillary Clinton for president … When you add up her knowhow, leadership, and experience, it's clear that Hillary Clinton is a perfect fit to be the commander-in-chief of the largest military the world has ever seen … The thing is, we've been trying the free market thing for centuries. All we have to show for it is a super wealthy class of people who run the country. What we need is someone to represent the common man, and that someone is Hillary Rodham Clinton.”
Mister Snyder has done quite well in absorbing the modern liberal party line, one that both advances itself on the concept of collectivism, yet reverses itself on its position just two generations ago that war is an evil concept, promoted by conservatives in an effort to control the world.
His comments are not unusual, and that’s what makes them significant. He’s a modern, educated, effectively indoctrinated liberal. His political counterpart is a modern, educated, effectively indoctrinated conservative. Together, they comprise the backbone of governmental dominance over a people: different party, same blind acceptance of political party dogma.
John Adams had it right in his 1780 letter to Jonathan Jackson, as quoted above. He understood that the old method of thought control – that of kings ordering their vassals what to believe – had had its day. It had never been fully effective, as the vassal was free to decide whether he believed the king. But, as early as 1780, the future would belong to those politicians who were skilled in giving the public “A” and “B” choices.
People need to believe that they have a choice. Interestingly, though, they seem to be content with only two choices. A skilled politician therefore limits the number of choices to two and, today, this is the way it’s done in most “advanced” countries. Whether it’s Democrat vs. Republican, or Tory vs. Labour, there are two dominant parties. Each is represented by a group of individuals seeking to gain or maintain public office.
Initially, in order to sell the two-party concept to voters, it’s important for each party to have a philosophical identity. These two identities would seem to need to be based on opposing primary principles or ideologies, such as a free market system vs. collectivism, or empire-building warfare vs. a commitment to peace.
The US did, indeed, follow this route in developing its own primary sports teams, the Democrats and the Republicans. And, along the way, it learned that the public can be best manipulated if they are blindly devoted to either one team or the other. (Those in the red T-shirts detest those in the blue, and vice versa.)
Once this blind devotion has been achieved, it becomes possible to dispense with the extreme polarity of principles and ideology. As stated above, only two generations ago, there was a “collectivism and peace” party and a “free market and empire” party in the US. What they had in common, however, was that both required an increasingly larger government to support its objectives.
Today, the US political system has evolved to the point that the principles and ideology are disappearing. Today, Democrats fully accept and even encourage overseas aggression. This has been achieved through the illusion of “terrorism.” Similarly, the Republicans have watered down their commitment to a free market system through the soma of ever-widening entitlements.
No longer is it necessary that the two dogmas are polar opposites. They can only be five degrees apart from each other, yet each team of supporters fully believes his team is morally right and the other team is morally wrong. Meanwhile, they’re both headed toward the same warfare/welfare end. And of course, both teams fully accept the concept that an ever-expanding government role is necessary in achieving these ends.
But how is it possible that the principles and ideologies have been virtually erased? After all, the very idea of principles is that they are not based on popularity, but on inner conviction. Well, truth be told, the great majority of people have no real moral compass at all; no real inner sense of convictions. Their convictions can be manipulated in such a way that the portion of the brain that wishes to deal with convictions can be redirected into areas that are of little consequence.
On the surface of it, this seems like a bold and even radical statement, yet, as we can readily see, as long as never-ending debates are maintained over the less vital issues, such as abortion rights, gay rights, etc., a people can be distracted away from primary principles. Therefore, the government has the ability to create the illusion that a two-party system exists when, in truth, as the caption below states,
“VOTING: It’s deciding which criminal gets to steal everything you have.”

The concept of a government as a body of individuals that are chosen by election to represent the voters is a good one, but it’s not a concept that’s shared by those who are elected. Those who are elected almost unanimously see the concept as one in which the rulers are determined. They have no illusion about representation, although they do understand that they must give the impression to voters that they see themselves as representatives. Rulers seek to rule. All other concerns are secondary.
Over time, those elected will look for every opportunity to increase their own power (both politically and economically). Consequently, the longer a governmental system exists in a given country, the more it will deteriorate toward tyranny.
At some point, there is, in almost every country, a rebellion of some sort that causes a reset – a return to a more democratic structure where a greater level of representation once again takes place. Then the deterioration, inexorably, begins anew. This is why Thomas Jefferson was so fervent that, every so often, a revolution is essential.
It should be pointed out that the US is not alone in this deterioration. In all fairness, many other countries are in a similar state. Increasingly, people in these countries recognise that conditions are becoming tyrannical. Yet, most hold out the hope that the next election will somehow magically result in a return to basic freedoms. This will not be the case. Deterioration is baked in the cake. Regardless of the candidate, regardless of the party, regardless of the country, the outcome will be the same.
But, as stated previously, the deterioration process is a very long one and, at any given time in history, there are countries that are not so far along in the process. A bright future does indeed exist, but it lies not in the hope of a reversal by political leaders. It lies in choosing one’s domicile – one where basic freedoms remain.
With $1.8 Trillion In Debt Maturing This Year, Two Big Problems Emerge
02/29/2016
One of the big problems with the artificial equity rally of the past 7 years is that virtually all of its has come on the heels of a historic splurge in stock buybacks: after all even Goldman recently admitted that buybacks have been the sole source of stock buying in recent years.
This in itself would not be so troubling if it weren't for the source of funds used to finance these relentless stock repurchases. Amazingly, if one nets out all other sources and uses of S&P500 corporate cash, virtually every dollar in buybacks has been funded by a dollar of new debt, as Socgen showed several months ago.

To frequent readers, none of this should come as a surprise: we warned about not only the arrival of the buyback bonanza as long ago as 2012, but that the endgame would one that ends in tears for everyone involved.
Now, many years later, the mainstream media is catching up.
In a piece overnight, the WSJ writes that "low rates alone aren't enough to make it easy to pay off a loan. Many companies may find that out the hard way, especially as high-yield debt markets show signs of strain lately."
U.S. companies went on a borrowing binge in recent years. Nonfinancial corporations owed $8 trillion in debt in last year's third quarter, according to the Federal Reserve, up from $6.6 trillion three years earlier. As a share of gross value added - a proxy for companies' combined output - corporate debt is approaching levels hit in the financial crisis's aftermath.
Actually corporate debt has long since surpassed levels hit in the financial crisis's aftermath as we first showed months ago:

What the WSJ does get right, however, is the big picture:
Because those stock buybacks helped reduce companies' total shares outstanding, earnings per share got a boost. Indeed, absent the past three years' share-count reductions, S&P 500 earnings per share would have been 2% lower in the fourth quarter than what companies are reporting, according to S&P Dow Jones Indices.
What it also gets right is something else we warned about back in April 2012, namely that in the age of ZIRP, when hurdle rates are non-existent, the best capital allocation option for CFOs is shareholder friendly activity such as M&A, dividends and of course, buybacks, especially if their own equity-linked compensation rises as a result:
The major reason companies plowed money into buybacks rather than capital spending was that, in a low-growth environment, the returns from investing in expansion didn't seem as attractive as in the past. This is a big part of why companies were able to borrow cheaply: In a low-growth, low-inflation environment, investors were willing to accept lower returns on corporate bonds than if the economy was moving at a more rapid clip.
The rest is history: "most of the debt increase came from bond issuance, as nonfinancial companies took advantage of the lowest rates on corporate bonds since the mid-1960s. That is a plus as companies in many cases extended the maturity of their debt and lowered borrowing costs."
The negative: Rather than investing the funds they raised back into their businesses, companies in many cases bought back stock instead. That was something that many investors welcomed, but it may have come with future costs that they didn't fully appreciate."
Again, a mistake, because it was not "in many cases": it was in all cases. See the first chart again if confused.
But what is more important is that the WSJ correctly hints at what the real issue now that the buyback binge is over and the time to pay the piper has arrived, especially in a rising rate environment:
The sticking point is that in a low-growth environment, paying down debt also may be harder. Especially because companies weren't putting the money they borrowed into capital investments, which provide cash flows to help service debt. The stock they bought back won't do that for them. Even if this doesn't present an immediate problem for all companies given how they refinanced debt to longer maturities, it could be a long-term drag on earnings.
Actually, it is a problem... or rather two.
In a report earlier today, Bloomberg looked at the biggest hangover from this epic debt issuance spree, and found the first big problem, or rather first 9.5 trillion problems: that is how much debt the corporate buyback binge will cost companies over the next 5 years as the debt matures. And clearly, since corporations do not have access to this much funds, they will have to roll it over and refinance it.
As Bloomberg writes, this wave of debt coming due through 2020 is bigger than previous five-year schedules of debt maturities in 2013, 2014 and 2015, according to Standard & Poor’s data. It includes about $2.3 trillion of junk-rated debt, with about $418 billion of that rated B- or lower. And it peaks in 2020, with $2.1 trillion of debt coming due, which is greater than the peaks of the most recent previous maturity walls.
U.S. companies account for $4.1 trillion of the debt coming due through 2020, while European issuers are responsible for $3.7 trillion, S&P data show. More than half of all the debt coming due belongs to nonfinancial corporations.
The real issue, however is the near-term maturities, of which there are $1.8 trillion in 2016 alone, of which $570 billion are US-based Investment Grade maturities.

Bloomberg also hints at the second big problem, one which we discussed extensively at the end of 2015 following the first debt fund gates and liquidations, and especially one week ago when we documented the collapse of the CLO bid: the disappearance of virtually all demand from the primary bond market, most certainly in the junk space, and gradually, in investment grade as well.
If investors don’t return to their carefree ways of lending, global companies will be in for a rude shock. All that money that came so cheaply in the recent past will actually have to be paid back at some point. It’s not just a merry-go-round of lending. The buck must eventually stop with them.
Alas, as Citi's Stephen Antzcak showed in a report released late yesterday, investors are not coming back "to their carefree ways of lending." Quite the opposite.
Here are the big picture bullet points:
Overview — So far this year the volume of primary market activity has deviated from consensus expectations. But there were bigger surprises, in our view, including the extent to which IG primary market activity has been sensitive to volatility.
Skittishness in the IG Primary Market – The IG primary market saw roughly 75 no-go days over the past 12 months. This looks worse than even the ’08-’09 episode. There’s a lot of paper that “must” print in the period ahead…where will it price if we’re in a stretch of “no go” days?
VIP Only Access in HY – HY activity has slowed to a drip, and it seems only the best-in-class HY names are able to garner interest. Will more issuers gain access as volatility ebbs?
Similar Story in Leveraged Loans – Leveraged loan supply has sputtered overall, and most of the supply has been “event-driven.” As in HY, will we see issuers regain access to loan financing?
Odd: it is "skittishness" when there are no bid in the primary market; did Citi call it "stupidity" or "serenity" when Petrobras 100 year bonds were 5x oversubscribed last June, leading to unprecedented losses just a few months later? In any case, here are the details:
First, investors seem to be more skittish than usual with regard to the primary market, and the primary market responds quickly and dramatically when volatility rises. As noted above, this was evident in the IG market earlier this month when we saw 6 consecutive days with absolutely no new supply.
Second, this investor skittishness has spread from the trouble spots (i.e., energy and basics) to the broader market, particularly in HY and loans. This may not be a problem yet as companies have termed out liabilities (Figure 3, Figure 4), but the extent of access certainly bears monitoring.
Yes, many companies do have termed out liabilities, except for those who have $1.75 trillion maturing in the next 10 months.
Meanwhile, there is a clear buyer's strike which despite the S&P500 being less than 10% off its all time highs, continues with only sporadic intermissions:
it is not just junk bonds where the buyers are stepping away: it is increasingly investment grade, where if one excludes the AB InBev mega deal things are rapidly slowing down. Here is Citi:
On the surface at least, it appears that the IG new issue market has been chugging along at a relatively healthy clip, albeit with higher new issue concessions. By Feb 25th, we’ve already seen $200bn of new deals come to market – that’s 14% ahead of the pace set over the same period in ’15, which was a record breaking year in its own right. With that said, one could make the case that it’s the InBev M&A-driven megadeal that drove the growth in supply (issuance ex-ABIBB is 12% lower YoY).
To our minds though, it’s the increased irregularity of the new issue flows that’s concerning, particularly since we may have something on the order of $570bn of maturities to get refinanced by year-end. Throw in the M&A pipeline, and it’s a large number to push through a stop-and-go primary market.
But for the real horror, look nowhere else than the junk bond space:
Across credit, it’s the HY supply that took the biggest turn over the last 12 months. So far this year HY supply is down ~75% compared to this point last year. Only a meager $12bn via 21 deals were completed, which are basically Lehman-era levels (Figure 7). Aside from the headline volumes though, there are a few other concerning features of the recent supply:
Extraordinarily concentrated use of proceeds: HY issuance this year is almost entirely attributable to M&A, an activity that is very visible and generally has a set timeline. Very little supply is attributable to any other use of proceeds (Figure 8). Again, this may not be a major problem in the near-term, but obviously will be as time passes and if conditions don’t change.

Here is the best visual of the total carnage in the primary junk bond market:

Keep in mind that hundreds of billions in junk bonds are coming due over the few years in the US alone: absent this freeze in the primary issuance market thawing fast, bond yields will continue rising in a feedback loop, forcing management teams to issue debt with draconian terms, as they scramble to find any buyers.
To be sure, there is demand, but one has to pay handsomely for it, case in point Solera, which as we reported last week, is the subject of one of last year's largest leveraged buyouts, has been struggling to raise money even with Goldman as underwriter.
There was some good news moments ago, however, when the bond issue for the Solera LBO finally priced. The bad news: it did so at a whopping 11.5% yield...
PRICED: SOLERA $1.73B 8NC3 AT 95 TO YIELD 11.47%
... effectively repricing the entire junk bond market between 50% and 100% higher.
Which is, ironically enough, not the worst news - as Citi notes, only a select few "VIP" companies will be able to refinance regardless of the yield; for most other companies, the refi market sill simply stay shut and the upcoming maturities will lead straight to bankruptcy, without passing go.
The only possible bailout? A full and unconditional Fed relent, with Yellen going back to square one, not just lowering rates, but also unleashing more QE. Because as we have said since day one, ever since the last crisis, absolutely nothing has been fixed and instead constant Fed intervention merely allowed the can to be kicked.
And now the market is about have a rude awakening confirming just this, at which point it will have only one option: crash the market, and force Yellen out of her shell, unleashing another massive Fed easing program.
At that moment the ball will be in Yellen's corner and her choice will be simple: will she go down in Fed history as simply the Chairman who was wrong, and was "forced" to abort the Fed's first rate hike cycle in nearly a decade, or will she go down not only in history, but also in flames, and take the so-called market, Keynesian economics and monetary theory, as well as the entire U.S. economy, down with her?
The Long History of Government Meddling In The American Marketplace
Feb 29, 2016
by Mike Holly
via The Mises Institute
Although the causes of economic crises recurring throughout US history and often spreading worldwide can’t be proven using empirical means, oppressive government regulations favoring special interests in relevant industries have preceded every crisis.
Typically, cronyism involves support of politicians in exchange for regulations denying others the freedom to compete with the moneyed interests (e.g., monopolies). Less competition leads to higher costs and lower quality. It reduces economic growth, jobs, wages, innovation, and productivity. Attempts to control economic growth through government spending and/or manipulating interest rates (e.g., stimulate growth with low rates) generally leads to more severe crises.
None of these things are recent phenomena, but can be found again and again throughout American history.
Mercantilism
After the Revolutionary War, when the agrarian economy was beginning to industrialize, politicians pursued British-style mercantilism, including colonialism, against natives and regulations blocking competition in banking and manufacturing. Financial panics and depressions resulted under a national bank in 1792 and from 1819–21 and state-regulated banks from 1837–43 and 1857–59.
The Civil War was a dispute between Republicans representing manufacturers in the North that blocked free trade with import tariffs against Europe, and Democrats representing agricultural plantations in the South that refused to replace slavery with mechanization using the North’s high-cost goods.
Monopolization
The “Gilded Age of Capitalism” shifted the economy from agriculture to industry led by “robber barons” who lobbied mostly Republicans. The government helped create railroad monopolies with low-interest loans, land grants, and special frontier privileges. The railroads formed a conglomerate that monopolized much of the rest of the economy by favoring large over small customers (e.g., Rockefeller’s Standard Oil over farmers), large suppliers (e.g., Carnegie Steel), and big banks (e.g., J.P. Morgan).
Both railroads and banking (with both national and state banks) were implicated in the severe financial panics from 1873–78 and 1893–97, occurring during the Long Depression of 1873–96, and another panic in 1901. Banking regulation led to the panic in 1907.
During the Progressive Era, the US used regulation to form many of today’s monopolies. From 1906 to 1910, Republicans led efforts to create state-regulated electricity and natural gas utility monopolies, and the Seven Sisters oil and physician oligopolies. In 1913, Democrats sanctioned the telephone monopoly and founded the Federal Reserve banking monopoly (i.e., which regulates the banks). After World War I, the Fed raised interest rates which led to the depression of 1920–21, which bankrupted many companies and led to manufacturing oligopolies, including in the automotive industry.
Thanks to these new frontiers in a regulated economy, by the 1920s, only 200 corporations controlled over half of all US industry and the richest 1 percent of the population owned 40 percent of the nation's wealth. As in recent times, the Fed responded by providing easy credit at low interest rates, which led to increased consumer and business debt, uneconomic and risky investments, and inflated assets, including stock prices (further increasing wealth disparity). After the Fed tried to raise interest rates, the result was the Great Stock Market Crash of 1929.
Nationalization
During the 1930s, the crash led to the Great Depression, the worst financial crisis in US history, and then spread from the world’s largest economy globally, albeit with less severity abroad. Democrats, led by President Roosevelt (FDR) and supported by bankers, agriculture, oil, and labor, tried to redistribute wealth by limiting competition through government takeovers, including trucking, airline, and housing industries, and restricting the supply of food and oil. This led to continued global depression and World War II, which was financed with debt.
Finally, the post-war boom or “Golden Age of Capitalism” saw a dismantling of wartime regulations and growing opportunities especially in manufacturing (like China today). During global rebuilding, the US became the world’s economic leader with about 4 percent annual growth, even with increasing interest rates, decreasing debt, and high taxes. Although wealth disparity was historically low, Democrats increased regulation of necessities, leading to today’s high costs.
FDR had taken money from taxpayers to subsidize home loans at low interest rates including guarantees from the Federal Housing Administration (FHA) since 1934, and securitization by the Fannie Mae secondary mortgage monopoly since 1938 (and Democrats added Freddie Mac to form a duopoly in 1970). After the war, the subsidies led to unsustainable demand for more expensive and larger homes, urban sprawl, and a shortage of affordable housing.
FDR had also taken money from taxpayers to subsidize favored farm crops, which discouraged alternative crops. After 1946, Democrats increased subsidies leading to inflated prices for farmland. Since 1973, the US has subsidized food overproduction leading to dumped exports that retard agricultural and economic development in the developing world and uneconomical bio-fuels protected by tariffs against Brazilian ethanol (until 2012). FDR had led support for the nationalization of oil industries (e.g., Mexico), and military spending to defend dictators in oil-rich countries (e.g., Saudi Arabia).
In 1965, Democrats led nationalization of about half of health care purchasing through Medicare and Medicaid. These programs, and later Obamacare, subsidized increased demand while the supply of doctors and hospitals has been restricted. The resulting health care crisis led to skyrocketing costs nearly triple those of other developed countries.
Psuedo-Deregulation
The dreaded stagflation of the 1970s is considered tied for the second worst financial crisis in US history. The Fed responded to inflation by raising interest rates, leading to the Great Recession of the early 1980s, which led to the Savings and Loan Crisis, and spread as the Latin American Debt Crisis. Since then, the Fed has been lowering rates overall.
Meanwhile, politicians claimed to be trying to increase cost efficiency through privatization of public industries, and foster competition through partial deregulation of private industries. Worldwide, politicians allowed the monopolists to write the rules, including preferential bargain sales to cronies, which led to even nastier deregulated monopolies.
Deregulation was limited mainly to common carrier industries, including airlines in 1978, trucking in 1980, telecommunications in 1996, and electricity and natural gas utilities during the 1990s, and also banking in 1999. For example, states allowed utilities to design rigged trading schemes, gain preferential access to transport lines, and sell assets to affiliates for pennies on the dollar. Deregulation declined after manipulations led to the California Energy Crisis of 2000.
Corporatism
After the energy crises and bursting of the internet bubble in 2000, big business Republicans and big government Democrats practiced corporatism. The US House Budget Committee explains: “In too many areas of the economy — especially energy, housing, finance, and health care — free enterprise has given way to government control in partnership with a few large or politically well-connected companies.”
In 2003, regulations led to increased ethanol production from corn, but after that led to the 2007–08 Food Crisis, growth was stopped by mandates that the fuel be made from expensive-to-process cellulose.
Meanwhile, George W. Bush promoted home loans securitized through the Fannie and Freddie duopoly and the Fed’s big banks, while encouraging the Fed to lower interest rates, leading to a bubble in home ownership and prices. Soon after the Fed started raising rates, the bubble burst leading to the 2007–09 Subprime Mortgage Crisis, 2007–08 Financial Crisis (considered tied for the second worst financial crisis in US history), 2008–10 Automotive Crisis, and 2008–12 Global Recession.
In 2010, Dodd Frank gave politicians more oversight over the Fed’s big banks, increasing influence peddling, and risks of crises. The Fed has been loaning trillions of dollars at low interest rates to the big banks. Lower rates can encourage financial engineering, like mergers, which allow bankers and corporate executives to bleed profits from large corporations, who receive preferential tax treatment, especially abroad. Since 1998, the financial sector has spent over $6 billion lobbying Congress.
The Bank for International Settlements, or so-called “bank of central bankers,” warns another global debt crisis is coming, and the debt-trap is now even worse than before 2007. The US has led many nations to continue to lower interest rates and accumulating private and public debt. Now, a slowing economy could make the debt toxic and lead to a financial crisis that would be hastened as the Fed raises rates. The Bank warns: “It is unrealistic and dangerous to expect that monetary policy can cure all the global economy’s ills.”
Obamacare could allow bureaucracies to control patient treatments and prices, while lobbied by the industry. Since 1998, medical interests have spent over $6 billion lobbying Congress.
The Free Market Solution
Today, there is no party that favors true privatization or free markets. Republicans favor monopolization, while claiming support for free markets and blaming the Democrat’s high taxes and regulations for crises. Democrats favor nationalization, while blaming non-existent free markets for crises. Meanwhile, many Americans appear to be embracing the regulatory nationalism of crony capitalist Donald Trump or the democratic socialism of Bernie Sanders.
The solution, however, is simply to take as much power as possible out of the control of corruptible politicians and their special interest supporters.
The Central Bankers' Greatest Blunder Yet: Negative Rates = Deleveraging
Feb. 28, 2016
In a world which has long since crossed the monetary twilight zone of negative rates, and which is spiraling ever deeper into NIRP, below we present some quite fascinating observations on debt, NIRP and how the latter leads to the deleveraging of the former, and thus encourages global deflation - something which in retrospect will be (and in many cases already has been) seen as a central bank fatal flaw, and confirmation said central bankers have zero understanding of the process they have unleashed.
Negative rates = deleveraging
Negative interest rates on developed world sovereign bonds could reduce debt burdens and may be a market solution to overleveraging
While the side effect of extreme money creation is inflation, the side effect of extreme debt creation is deflation
We argue that the need for further deleveraging may be a reason why negative interest rates persist in sovereign bond markets
Bonds and Deleveraging
While conventional theory suggests that central banks set base interest rates and that negative rates are a result of low inflation and slow economic growth, we suggest there may be an alternative explanation. Drawing on historical and cultural analogies, we view negative rates as a possible market response to the growing levels of debt and inequality in income and wealth.
In April last year, Switzerland became the first country to issue a 10-year sovereign bond at a negative yield. By the end of 2015, about a third of newly issued eurozone sovereign bonds came with a negative yield. Investors who buy these bonds and hold them to maturity will receive less than they put in and the issuer will ultimately pay back less than borrowed. Through this mechanism, we believe that negative interest rates can be a useful tool for deleveraging.
We recognise that the challenge to this view is that the objective of this policy has been to encourage even more leverage; the case of the Swedish housing market comes to mind. The majority of the countries with negative yields on their government bonds have high levels of either government or private debt (or in some cases both). Historically, one would expect government yields to go up to discourage the issuance of more debt. This is not happening now. Why? We suggest that, precisely because of the high level of debt and the need to deleverage, nominal yields in those countries have become more and more negative to encourage the issuance of more debt and slowly roll down the existing debt stock.
This suggests the market may be indicating there is too much debt.
But this has an implication for the creation of new money, which is essential for the normal functioning of the economy. Most of the money creation in the developed world is done by the private banking system through issuing loans. If there is no demand for new debt, the money creation process stalls. In other words, while under the gold standard our money creation was constrained by the availability of gold, in the current “fiat” monetary system, we cannot issue new money without the issuance of new debt. However, the system after 1971 was much more flexible than the metallic standard before because, as long as the economy was expanding, the banks could always find someone willing to borrow from them and thus increase the money supply.
Nevertheless, there is a natural limit to how much debt an economy can sustain. The time after the financial crisis of 2008 coincided with ever decreasing rates of growth and, as a result, not only could the banks not find people to lend to (thus money supply growth slowed down) but people started deleveraging (which caused total liquidity to contract – see Figure 12).
The US, and by extension most of the developed world post 2008, was in a very similar situation to where it was for most of the nineteenth or the early twentieth centuries, i.e. a deflationary environment characterised by intense progress (in our case we are starting to finally see the benefits of the Internet) and the inability to boost the money supply and thus create inflation.
Figure 12. Total US liquidity decreased after the 2008 crisis

It is this economic necessity and the mathematical impossibility of paying interest continuously which has created the present situation of negative interest rates: in our view the market has found a way to keep the monetary system going but this time without the risk of ever increasing debt.
In the past, we used to deal with too much debt either using market forces, like growth and inflation, or non-market forces, like debt jubilees, debt restructurings or excessive seigniorage. History is full of examples which reinforce the notion that putting an unbearable burden on debtors would ultimately send the whole economy into a depression. Debt jubilees were very common in Mesopotamia, for example, where, by some accounts there were around thirty episodes of general debt cancellations from 2400 to 1400 BC.
In 1819, as agriculture prices dropped, US state governments imposed moratoria on farmers’ debt payments and some debt was even completely forgiven. During the Great Depression, the US government, through the Home Ownership Loan Corporation, helped struggling homeowners by sometimes substantially lowering their mortgage payments. “One of the largest transfers of wealth (from creditors to debtors) in the history of the world”, however, happened when the US government broke off the gold standard in 1933. This was equivalent to restructuring its debt as, by removing the gold clause in US Treasury securities and devaluing the dollar, creditors’ claims were cut by more than 40%.
None of these options was used after the Great Recession of 2008. In addition, the developed world economies seem unable to generate growth and inflation sufficient to offset the rise in debt.
Without a policy response, the market is taking the matter in “its own hands” by starting to reduce the level of debt (in present value terms) via negative yields on sovereign bonds.
23.5% Recession Probability In Next 6 Months
by Wayne Duggan
Feb. 26, 2016
Global economic growth concerns, particularly in emerging markets, have weighed on the S&P 500 so far in 2016 and have led to speculation that the United States could be on the verge of a recession. In a new report, Wells Fargo analyst John Silvia discussed the factors impacting the firm’s various recession prediction models.
Although Wells Fargo’s official Probit model puts recession risk at only 23.5 percent in the next six months, the firm also monitors seven additional models, which estimate recession probability based on a number of different sectors of the U.S. economy.
Currently, the highest risk indicated by any of the eight models is 76.2 percent (based on IP, S&P 500 Index and the CRB Index) and the lowest risk is only 3.6 percent (based on yield spreads). Overall, the average of the eight models indicates a 37.3 percent recession risk.
“Given that recession probabilities based on our official model and the average of all models are somewhat elevated relative to the past few years, it is not wise to dismiss recession risk,” Silvia cautioned.
Traders that believe that Wells Fargo’s models are underestimating the likelihood of recession should consider the SPDR Gold Trust (ETF) (NYSE: GLD) and the iPath S&P 500 VIX Short Term Futures TM ETN (NYSE: VXX).
http://finance.yahoo.com/news/wells-fargo-sees-23-5-184749816.html
Why A Hedge Fund Manager Who Made A Killing From Subprime Is Buying Bitcoin
FEb.26.2016
Long before "The Big Short's" Michael Burry was a household name for his insight into the upcoming subprime crisis of 2006-2007, there were many others among them John Paulson, Kyle Bass, and Corriente Advisors' Mark Hart. Just like Bass, Mark is another Texas-based hedge fund manager who correctly predicted, and profited from, the subprime crisis. He is also an expert on China, and in fact, just last month in the aftermath of the recent Chinese devaluation which roiled markets, he said that "China should weaken its currency by more than 50 percent this year."
In fact, it was Hart who (alongside ex-PBOC advisor Yi Yongding) first proposed the idea of the one-off devaluation that promptly afterwards become the conventional expectation for this weekend's G-20 summit in Shangai. To wit:
Hart believes that the Chinese crawling devaluation is an error as it carries with its the latent threat of much more devaluation in the future, thus encouraging even more outflows, which in turn forces China to sell even more reserves, which destabilizes the economy even further, forcing even more devaluation and so on.
Instead, a one-off devaluation would allow policy makers to “draw a line in the sand” at a more appropriate level for the yuan, easing pressure on China’s foreign-exchange reserves and removing an incentive for capital outflows, according to Hart, who’s been betting against the currency since at least 2011. He adds that China should devalue before its $3.3 trillion hoard of reserves shrinks much further, he said, because the country can still convince markets it’s acting from a position of strength.
According to Hart, while a devaluation this year would be “jarring” and may initially accelerate capital outflows, it would ultimately put China in a stronger position. He said the country could explain the move by saying it would put the yuan at a level more reflective of market forces and allow the currency to catch up with declines in international peers.
As we said one month ago, "Hart is correct, and China will have to pick one option: either a sharp devaluation, or failing that, debt defaults: the current course of gradual CNY debasement will only results in an acceleration in capital outflows until ultimately China's $3 trillion rainy day fund is whittled away to nothing (and as a reminder, according to some estimate just a little over $1 trillion in it is actually liquid assets)."
And while we explained that Hart's "devaluation" trade consists of buying Yuan puts, according to a recent interview he gave to Raoul Pal RealVision, he has also put another trade on alongside his FX deval: buying bitcoin.
Why bitcoin?
The same reason we gave back on September 2, 2015 when Bitcoin was trading at $215 in a post titled "China Scrambles To Enforce Capital Controls (Which Is Great News For Bitcoin)" and long before the topic of China's capital controls, and their circumvention, became a routine topic of conversation. As we explained simply, with Chinese capital controls increasingly more strict, the local population, which was nearly $25 trillion in deposits in local banks, will rush to transfer these massive amount of savings offshore, and will end up using bitcoin to do it. This is specifically what we said:
... while China is doing everything in its power to not give the impression that it is panicking, the truth is that it is one viral capital outflow report away from an outright scramble to enforce the most draconian capital controls in its history, which - as every Cypriot and Greek knows by now - is a self-defeating exercise and assures an ever accelerating decline in the currency, which authorities are trying to both keep stable while also devaluing at a pace of their choosing. Said pace never quite works out.
So what happens then: well, China's propensity for gold is well-known. We would not be surprised to see a surge of gold imports into China, only instead of going to the traditional Commodity Financing Deals we have written extensively about before, where gold is merely a commodity used to fund domestic carry trades, it ends up in domestic households. However, while gold has historically been the best store of value in history and has outlasted every currency known to man, it is problematic when it comes to transferring funds in and out of a nation - it tends to show up quite distinctly on X-rays.
Which is why we would not be surprised to see another push higher in the value of bitcoin: it was earlier this summer when the digital currency, which can bypass capital controls and national borders with the click of a button, surged on Grexit concerns and fears a Drachma return would crush the savings of an entire nation. Since then, BTC has dropped (in no small part as a result of the previously documented "forking" with Bitcoin XT), however if a few hundred million Chinese decide that the time has come to use bitcoin as the capital controls bypassing currency of choice, and decide to invest even a tiny fraction of the $22 trillion in Chinese deposits in bitcoin (whose total market cap at last check was just over $3 billion), sit back and watch as we witness the second coming of the bitcoin bubble, one which could make the previous all time highs in the digital currency, seems like a low print.
Yes, bitcoin may be slowly but surely leaving the domain of the libertarian fringe, but in exchange it is about to be embraced as the most lucrative and commercial "blockchained" way to capitalize on what may soon become the largest capital outflow in history...
Two months later the value of bitcoin rose by more than 100%, but what was delightfully amusing to us was attempts by the self-appointed guardians of monetary wisdom to explain the move not as one of Chinese capital flight but because of some tiny, alleged Chinese Ponzi scheme. Apparently in the mainstream media if one can't predict what happens, one tries to explain why something happened... and gets that wrong too. Because if bitcoin's surge was only due to some two-bit Russian scammer exposed four months ago, it would be back at $215 if not lower, instead of trading at $432 as of this moment.
What really happened is what we said happened, and here is Mark Hart confirming precisely that. Here is the excerpt from an interview he gave to Raoul Pal's RealVision:
Bitcoin is interesting to me as a route for capital flight. I am not opining on the long-term viability of bitcoin - I do think there is something there - but I am long bitcoin specifically to capture capital flight from China.
But this is where it gets really interesting: if one wants to bet on a massive Chinese devaluation (which is coming, the only question is when) one can simply short the Yuan as so many hedge funds have done in the past 2 months only to find that by "fighting the PBOC" they are gambling not only with their AUM, but their professional careers due to not only the unlimited downside of their trades, but to the substantial leverage involved in such FX trades.
Furthermore, relentless interventions by a belligerent Chinese central bank in recent weeks have shown that even as the Yuan will ultimately devalue, and dramatically at that, the PBOC will do everything in its power to crush the "hated" speculators, among whom such brand names as George Soros, along the way by inspiring sudden, violent and massive surges in the currency, in the vein of the Bank of Japan circa 2011.
So what is one trade that can be put on to bet on further Chinese devaluation (or outright economic collapse) with limited downside, with unlimited upside, and one which is guaranteed to be profitable if and when the local Chinese depositor herd gets out of Yuan en masse after the next 10%, 20%, 50% or more devaluation and rushes into bitcoin? Simple: do precisely what we said in September, and precisely what Corriente's Mark Hart is saying now: buy bitcoin, because once the Chinese buying frenzy is unleashed, and $25 trillion in deposits scramble to be packed into a product with a $6.5 billion current market cap (but only when the price of a bitcoin is $430; the market cap does rise to $25 trillion if every bitcoin is worth $1.6 million) one thing will happen: the price of bitcoin will soar exponentially.
http://www.zerohedge.com/news/2016-02-26/why-hedge-fund-manager-who-made-killing-subprime-buying-bitcoin
Blow Your Brains Out, GOP
Seriously, I dare you.
Erickson is hardly alone. Bill Kristol has mused about starting a new political party if Donald Trump wins the Republican nomination. It’s almost impossible to imagine George Will or Kevin Williamson supporting Trump. Glenn Beck declared, “I know that I won't go to the polls. I won't vote for Hillary Clinton and I won't vote for Donald Trump. I just won't. And I know a lot of people that feel that way.”
Glenn Beck isn't a "Republican." He's a wild-eyed five-alarm nut who used to do reasonable reporting on real issues. When he started wrapping his head in tinfoil back a few years ago with his "series" on all sorts of various conspiracies he alleged were behind this and that in America the only people he had left were those who hung their hat on his claimed religious beliefs.
But now he's losing even that group as the last few days have seen evidence of outright insanity displayed on his show featuring paranoid delusional rants.
Here's reality: Nobody owns the Republican Party, or for that matter any political party. Those who vote a given ticket are the party, whether you like it or not.
Oh sure, the "establishment" can steer, and it does. It can cajole or even threaten, and it both can and does. But in the end a party without voters is a bunch of dudes and dudettes in suits sequestered in a building blowing money like an addled Hollywood actor tosses lines of coke on the glass-topped table for his favorite cadre of hookers.
The effect is about the same too; they feed their own paranoia, waste enormous amounts of money and ultimately their heart explodes, leaving them dead.
The Republican Party has not been "conservative" for a very long time. Conservatives do not allow the government to run trillion dollar deficits, but this Republican Party has.
Conservatives do not fund government agencies that unlawfully spy on Americans and then perjure themselves in front of Congress, but this Republican Party has.
Conservatives do not allow a Secretary of State to run her own email server exposing national secrets and get away with lying about it before Congress without bringing an immediate criminal referral and a contempt citation, but this Republican Party has.
Conservatives definitely do not allow any branch of the government to give and sell weapons, including man-portable missiles, to terrorists and then try to cover that up by letting an Ambassador be murdered while stranding those few members of our armed forces that were there resulting in their death as well, but this Republican Party has.
These are not "conservatives", they are traitorous bastards, all of whom deserve to be in the dock, not in the Halls of Congress. They defile said body each and every day, smearing the walls with excrement by their mere presence.
I do not know whether Trump will change much of this, or any of it for that matter.
But what I do know is that if the so-called "establishment" is scared of him then that means there's a decent chance they will be expelled from said halls and public life, and as far as I'm concerned the only thing I'd like better than that is if an asteroid were to land on all of their heads five minutes hence.
In this I'm obviously not alone, or Trump wouldn't keep winning primaries and caucuses.
Beware, GOP establishment. You've committed crimes too, both through malfeasance and misfeasance, and if the people take back their government you might find that you'd prefer to pull a Bud Dwyer than meet Lady Justice and her newly re-balanced scales.
http://market-ticker.org/akcs-www?post=231160
"There’s A Feeling Of Bits Of Ice Cracking All At Once" - This Is The 'Big New Threat' To Oil Prices
Feb.26.2016
One week ago, we reported that even as traders were focusing on the daily headline barrage out of OPEC members discussing whether or not they would cut production (they won't) or merely freeze it (at fresh record levels as Russia reported earlier today) a bigger threat in the near-term will be whether the relentless supply of excess oil will force Cushing, and PADD 2 in general, inventory to reach operational capacity.
As Genscape added in a recent presentation, when looking specifically at Cushing, the storage facility is virtually operationally full (at 80%) with just 4-5 more months at current inventory build left until the choke point is breached, and as we have reported previously, storage requests for specific grades have already been denied.
Goldman summarizes the dire near-term options before the industry as follows:
The large builds in gasoline and crude stocks have brought PADD 2 storage utilization near record high levels. While the recent decline in Midcontinent refining margins should help avoid breaching storage capacity, by finally bringing gasoline back into deficit, this will likely only exacerbate the build in crude inventories in coming months and should require further weakness in PADD2 crude prices to spread this build to the USGC. Weaker gasoline demand/exports, or higher margins/runs or finally resilient crude imports/production, could create binding storage issues beyond the intermittent Cushing WTI cash price weakness observed so far, which would require another large leg lower in crude prices to shut production in the Midcontinent and Canada. As we have argued, this continued testing of storage constraints should keep price and margin volatility elevated.
However, while the threat from overproduction on soaring crude inventories, or in other words "supply", has been extensively documented, far less has been said about another just as big problem: "demand", or the potential supply-chain bottleneck that will hit the moment refiners finds themselves flooded with too much unwanted product, in turn telling producers they have to turn oil back simply because they have no more capacity.
Is this possible? It's already happening.
As the WSJ reports in a piece titled "The Big New Threat to Oil Prices: A Glut of Gasoline", refineries in the U.S. Midwest are losing their thirst for oil, posing a new risk for the battered crude market. The Midwest accounts for nearly a quarter of the crude processed in the U.S. and is home to shale producers that have few other outlets for their oil. But refiners there are already swimming in gasoline and other fuel, forcing them to cut back production until the excess can be worked off.
In other words, not enough intermediate demand in the supply-chain with the result the same as oversupply: more crude oil is available in the market, worsening a glut that has been undermining oil prices for the past year and a half. As the WSJ adds, "with U.S. crude inventories at the highest level in more than 80 years, some storage hubs have little room left to store oil."
This means that storage hubs are now being hit on both sides: from excess production in a global market oversupplied by 3 million barrels daily, and from collapsing demand by the refiners for whom operating at current prices has become uneconomical. The result is that refinery production capacity, while already running at record levels for this time of the year, has tumbled from 98.2% a month ago to just 92.9% last week.
This drop is significant because, as the WSJ explains, it marks the first time several refineries in the region have opted to reduce activity for economic reasons— a marked change after more than a year of refiners processing as much crude as possible.
Here is the problem illustrated: gasoline stocks are literally off the charts in terms of the past 10 year min-max range:


... while gasoline demand is well within its past decade range:

Which means refining production has no choice but to decline, which is precisely what it is doing. Three examples:
CVR Refining LP is among the companies that have scaled back. The company said recently that it reduced runs at its 70,000-barrels-a-day refinery in Wynnewood, Okla., by as much as 10,000 barrels a day. “It doesn’t make sense to process something when you’re not making anything on it,” Chief Executive Jack Lipinski said during a Feb. 18 earnings call.
HollyFrontier Corp. said Wednesday that it has trimmed production at refineries in Kansas and New Mexico due to lower margins.
PBF Energy Inc. Chief Executive Tom Nimbley said during a conference call on Feb. 11 that the industry “turned the dials to make more gasoline” in the last quarter of 2015 and overshot demand. “The gasoline is not going to the consumer,” he said. “It’s going into a tank.”
The first immediate consequence of overproduction are dropping margins as refiners try to sell their product into a glutted market, and sure enough refining margins are lower throughout the country this year, including in the Gulf Coast region, where more than 50% the country’s refining capacity is concentrated. But refiners there have more choices when it comes to buying crude oil and can substitute cheaper options if they become available. And they can put fuel on tankers to sell overseas if supplies build up too much.
In other areas, there are fewer viable options: recent cutbacks have been enough to nudge gasoline prices higher in the Midwest, though it’s still cheap in some places: Gas was selling for as low as $1.11 a gallon on Wednesday in Granite Falls, Minn., according to Gasbuddy.com. Gasoline futures for March delivery rose 4.6% on Wednesday to $1.0104 a gallon, up from a seven-year low hit earlier this month.
Which again brings us to the most important commercial hub in the US, located in the heart of the Midwest in Cushing, Oklahoma.
"Many industry players and analysts think refiners will ramp up production after spring maintenance and they expect activity to pick up in the summer as cheap gasoline spurs Americans to take more road trips. But for producers in the Midwest and Canada, any decline in Midwest refining activity is worrisome. The region is home to the crucial oil storage hub at Cushing, Okla.—the delivery point for the U.S. oil futures contract."
Sellers in the futures market can either deliver physical crude or buy futures to offset their obligations. A lack of storage space can force buyers out of the market and supplies in Cushing are at their highest level ever. Analysts warn U.S. oil futures could fall further as Cushing nears full capacity.
This is precisely what we have been warning about for months, or as Paul Horsnell, global head of commodities research at Standard Chartered puts it, "There’s a feeling of various bits of ice cracking all at once" in the oil market, with both crude-oil and gasoline inventories at extremely high levels... People are worried about a short-term issue, particularly in the U.S., particularly at Cushing."
The good news is that we are likely very close to the worst case scenario playing out: refiners are unlikely to start buying more crude in the coming weeks. Instead, many will begin seasonal maintenance ahead of the busy summer-driving season. That could leave some oil producers scrambling to find places to store their output. Prices in some regions might have to drop sharply to justify the cost of shipping the oil to where it can be stored.
Which means there are just two options: find some undiscovered storage, or hope demand picks up.
On the first, there is always hope: “we’ll just look for every other nook and cranny throughout North America to stuff crude oil into,” said Andy Lipow, president of consulting firm Lipow Oil Associates in Houston. “The market is just not going to like it."
However, it is the second that is the biggest wildcard: refiners profit on the difference between oil prices and fuel prices. Oil prices have dropped 70% since mid-2014 to around $32 a barrel currently, but robust demand for gasoline kept prices at the pump from falling as quickly last year, boosting refiner margins. However, analysts question whether demand will increase strongly this year, especially given broader concerns about sluggish economic growth.
Which brings us to the punchline: on a four-week average basis, U.S. gasoline demand fell in January compared with the year before, according to Energy Information Administration estimates.
This despite the alleged increase in US consumer purchasing power or the so-called "tax-savings" from low gasoline prices, which should have boosted overall gasoline demand.
It has not.
Which is why with the market having debated the supply issue for over a year, and overanalyzed the OPEC and non-OPEC supply question to death, what virtually nobody has discussed is the just as important demand side of the equation, perhaps because nobody dares to admit the obvious: the much needed rebound in demand is just not there.
If that is indeed the case, expect a sharp, violent move lower in the price of oil in the coming weeks as the fundamental oil reality finally catches up with the imaginary world of stop-hunting, momentum-igniting, algorithmic daytraders.
http://www.zerohedge.com/news/2016-02-26/there’s-feeling-bits-ice-cracking-all-once-big-new-threat-oil-prices
"Peak Stupidity" - Where We Go From Here
Submitted by Thad Beversdorf via FirstRebuttal.com
Feb. 26, 2016
So I’m currently teaching applied financial modeling at Marquette University in the beautiful blue collar town of Milwaukee, WI; home of the Harley, the (Miller) High-Life and SummerFest. It’s a great town and a great school. A few years ago the business college brought in a pretty savvy guy called David Krause who then started a program called AIM, where the top finance students actually manage more than $2M. Because of the program’s success US News & World Report ranked Marquette’s finance program 21st in the nation this year. Not bad for a small Jesuit school in the midwest.
Now I mention this because after 15 years in banking, teaching financial modeling has forced me to reacquaint myself with some of the basic tenets of markets and valuation. Such things tend to get lost in the midst of “getting the deal done” and chasing paper profits. This re-acquaintance process has been quite illuminating for me and I thought perhaps for others too.
A reminder of what the market actually represents is a good place to start. The stock market is simply an asset with some intrinsic value based on an expectation of future free cash flows to equity holders. Those cash flows are generated from revenues less costs of the underlying companies that make up the market. Let’s use the Wilshire 5000 Full Price Cap Index as the proxy market for this discussion as it is the broadest measure of total market cap for US corporations. It’s level actually represents market capital in billions.

So the market has put a valuation on those expected future cash flows to equity holders (as of today) at around $19.7T (a 55% increase from Jan of 2012) down from around $22.5T (a 77% increase from Jan of 2012) at the market peak last summer. So let’s take a look at the growth in cash flows of US corporations over that same period.
We should expect to find a growth pattern in free cash flows similar to the above growth pattern in the overall market valuation (the Wilshire is a statistically large enough sample to be representative of total US corporations). Let’s have a look…

The above chart depicts corporate free cash flows (blue line) indexed to 100 in Jan 2012. It is obtained by taking the BEA’s Net Cash Flow with IVA and CCAdj adding back depreciation and net dividends and subtracting net capex. (The actual definitions of these can be found here.)
What we find is that while the current valuation of expected future free cash flows to equity holders (i.e. market cap of Wilshire) has increased by some 55% since the end of 2011, the actual free cash flows of US corporations have only increased by 4%.
This becomes a very difficult fact to reconcile inside the classroom. Why would market participants be baking in so much growth when the actual data simply doesn’t support it?
Well there are plenty of potential explanations. For instance, rarely are investors rational. While buy low and sell high is rational investing behaviour, often market euphoria comes at the market top right before a major sell off, leading to a buy high and sell low strategy. Another reason is that the Fed has been providing a free put to all investors for the past 7 years essentially significantly reducing naturally occurring risk factors. But whatever the reason this dislocation between expected and realized growth begs the question, how long can it last? So let’s explore this issue.
Below is a longer term growth chart of the Wilshire vs US corporate free cash flows to equity holders both indexed to 1995 (i.e. 1995 = 100).

And so over the past 20 years we’ve seen this same type of dislocation three times. That is, we see expectations of growth far exceeding actual growth of free cash flows to equity holders. In the previous two dislocations we reached a peak dislocation (peak stupidity) followed by a reversion to reality (epiphany) where expected growth moves back in line with actual growth. Let’s have a closer look at specific indicators as to when the epiphany takes place.

The last two bubbles began their burst when medium term moving average of free cash flows dropped to zero. We see the very same pattern occurring presently. Today we appear to have just passed the peak stupidity inflection point as seen in the two charts above.
But let’s be sure not to ignore the technical patterns, so let’s do some charting. If we look to volatility and price level patterns between our current market and the last bubble cycle (credit crisis) we find incredible similarities.

The above chart depicts weekly high vs low intra-week price spreads and price level. What we find is that at this point in the last bubble cycle we had a period of reduced volatility (small green box in 08) that followed a period of increased volatility as the market slowly rolled over. Today’s bubble is just entering that period of reduced volatility following the period of increased volatility as the market rolled over.
And so what should we expect from here?
Well the fundamental charts above suggest we have significantly overvalued growth expectations and historically those over-inflated expectations can drop very sharply back in line with actual growth. So from a fundamentals perspective we should expect a significant drop in overall valuations (i.e. market cap).
And from a technical perspective, if we are in fact following the previous bubble cycle pattern (which we seem to be), we should expect a nice bounce in price level from the recent lows (to perhaps somewhere between 2000 – 2030) accompanied by relative calm before an explosion of volatility and a market price plunge that sends us into the next crisis sometime around May (give or take).
Happy trading!
http://www.firstrebuttal.com/a-blended-fundamental-and-technical-perspective-on-where-we-go-from-here/
The FBI’s Demand For An Apple Backdoor—-A Blatant and Dangerous Attack On The Constitution
By Jake Anderson at Anti Media
February 25, 2016
The FBI versus Apple Inc. An unstoppable force meets an immovable object — the feverish momentum of American technocracy accelerating into the cavernous Orwellian entrenchment of the surveillance state. You thought the patent wars were intense? The ‘Battle of the Backdoor’ pits one of America’s most monolithic tech conglomerates against the Department of Justice and, ultimately, the interests of the national security state. And this case is likely only the opening salvo in what will be a decades-long ideological war between tech privacy advocates and the federal government.
On its face, the case boils down to a single locked and encrypted iPhone 5S, used by radical jihadist Syed Rizwan Farook before he and his wide Tashfeen Malik killed 14 people in San Bernardino on December 2nd. The DOJ wants Apple to build a backdoor into the device so that it can bypass the company’s state of the art encryption apparatus and access information and evidence related to the case.
At least, that’s the premise presented to the public. As we are learning, the FBI and the federal government have a far more comprehensive end-game in mind than merely bolstering the prosecution of this one case.
Whistleblower Edward Snowden tweeted last week that “crucial details [of the case] are being obscured by officials.” Specifically, he made the following trenchant points:

Now, the Wall Street Journal has confirmed that there are actually 12 other iPhones the FBI wants to access in cases that have nothing to do with terrorism. According to an Apple lawyer, these cases are spread all across the country: “Four in Illinois, three in New York, two in California, two in Ohio, and one in Massachusetts.”
With each of these cases, the FBI’s lawyers cite an 18th-century law called All Writs Act, which they say is the jurisprudence needed to force Apple to comply and bypass their built-in proprietary encryption methods. Is it any wonder the only case the public hears about is the one that involves terrorism?
While law enforcement authorities claim these 12 additional cases are evidence that encryption has become a major hindrance to investigations across the country, privacy advocates say it is, conversely, evidence that national security is not the only factor at play in the government’s desire to circumvent encryption. This is further evidenced by the fact that the government has been pressuring Apple to create iPhone backdoors since long before the San Bernardino attack.
Rather, information privacy advocates like the Electronic Frontier Foundation (EFF) say the push for bypassing encryption — specifically, compelling Apple to build a backdoor operating system — involves a large-scale campaign to use the threat of terror to overreach their legal authority, breaching civil liberties in the process. We saw this in the wake of 9/11, when NSA’s PRISM program conscripted Google, Microsoft, and Facebook in a covert data mining campaign to collect metadata from American citizens.
The EFF says the Apple case is part of an ongoing pattern of the state using the threat of terrorism as a Trojan horse to get backdoor access to citizens’ smartphones:
“The power to force a company to undermine security protections for its customers may seem compelling in a particular case, but this week’s order has very significant implications both for technology and the law. Not only would it require a company to create a new vulnerability potentially affecting millions of device users, the order would also create a dangerous legal precedent. The next time an intelligence agency tries to undermine consumer device security by forcing a company to develop new flaws in its own security protocols, the government will find a supportive case to cite where before there were none.”
The DOJ deployed talking heads to all the media outlets to make the specious argument that what they’re asking for doesn’t really constitute a backdoor. The fact of the matter is, they are asking for a court to mandate that Apple work for the government (which, some have argued, creates a 13th amendment violation as well as privacy concerns) in weakening their own security and creating access to a locked, encrypted device. This is a backdoor, and virtually all tech experts agree that they are dangerous.
Nate Cardozo explained on the PBS NewsHour:
“Authoritarian regimes around the world are salivating at the prospect of the FBI winning this order. If Apple creates the master key that the FBI has demanded that they create, governments around the world are going to be demanding the same access.”
Computer programming expert and Libertarian Party presidential candidate John McAfee tried to call the FBI’s bluff last week by offering to take apart the San Bernardino iPhone and help the government extract the data they want without building a backdoor. He made the rounds on major media outlets as well, warning of the dangers of complying with the Justice Department.
McAfee says the FBI is “asking every owner of an iPhone to make their phone susceptible to bad hackers and more importantly foreign enemies of the United States like China.”
Meanwhile, this week, Facebook founder Mark Zuckerberg offered intellectual solidarity with Apple’s CEO Tim Cook, while Bill Gates took a more moderate stance on the issue, suggesting privacy advocates were overreacting. Gates later backslid from this position and lent his support to Apple.
It’s also worth pointing out that the FBI’s own mistakes during the investigation of the San Bernardino shooting may the reason they now need Apple’s help. According to Truthdig,
“The FBI reportedly asked San Bernardino County officials to tamper with the iCloud account of one of the suspected shooters in last December’s attack, in an effort that ultimately failed — making it impossible to know if there were other ways of recovering encrypted information without taking Apple to court.”
Apple’s brand is on the line, too. Previously hailed as a data security juggernaut among smartphone manufacturers, a judicial order to build a backdoor would compromise their status in a market in which uncompromised encryption is becoming rarer by the day.
The stakes couldn’t be higher. As noted by The Pontiac Tribune, if the FBI prevails in this case, the ramifications won’t be limited to smartphones. It will set a precedent for the government legally conscripting any and every entity they desire for the purposes of citizen surveillance and metadata collection.
http://theantimedia.org/just-found-real-reason-fbi-wants-backdoor-iphone/
The Impending $400 Billion “Prime”Fund Exodus From Commercial Paper Market Has Banks In Its Crosshairs
Liz McCormick & Cordell Eddings
by Bloomberg Business
February 25, 2016
Banks and other companies that have seen borrowing costs rise in the past year are about to feel more pressure in a $1 trillion market for short-term IOUs.
Investors are poised to pull as much as $400 billion from U.S. money-market funds that buy such debt, known as commercial paper, JPMorgan Chase & Co. predicts. The looming exodus, a consequence of steps to make money markets safer after the financial crisis, is set to accelerate before October. That’s when Securities and Exchange Commission rules take effect mandating that so-called institutional prime funds, among the main buyers of commercial paper, report prices that fluctuate. Traditionally, those funds have stuck to $1 per share.
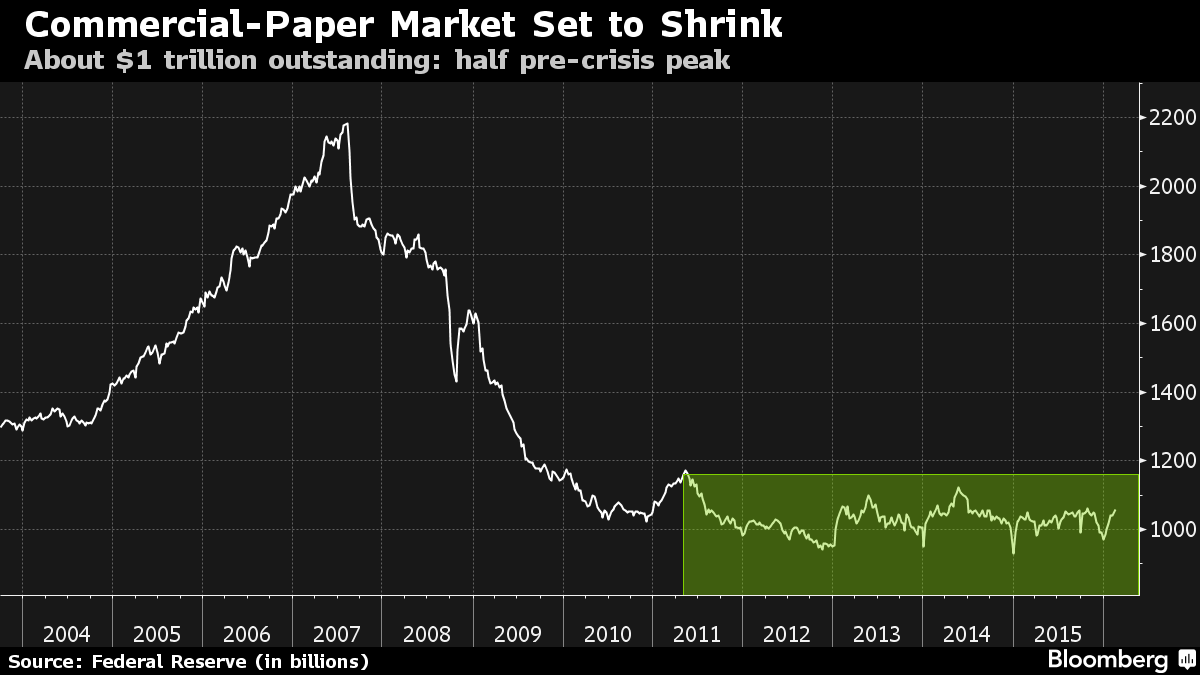
Wall Street strategists say investors may already be shifting from prime funds to those focused on government debt, which will keep a fixed share price. The diminished appetite for commercial paper is a potential headache for banks and other issuers, which saw the cost of the IOUs climb to an almost four-year high in recent weeks. The companies use the instruments for everything from loans to payrolls.
Commercial-paper “issuers will either have to find other investors to fill in the gap, or may have to raise the rate they are offering to get additional interest,” said Gregory Fayvilevich, an analyst in the fund and asset management group at Fitch Ratings in New York.
Next Wave
The move by investors is the next big wave of cash to leave prime funds because of the new rules. It would come on top of about $250 billion of assets that U.S. money-fund companies have already converted over the last year from prime funds to those that only hold government securities like Treasury bills. The SEC measures will force institutional prime funds to tell clients daily whether their investments gained or lost value.
The money-market industry’s changing landscape has already lifted companies’ short-term borrowing costs: Rates on six-month commercial paper reached the highest above Treasury bills since 2012 this year as demand waned relative to government debt. The six-month Treasury bill rate was about 0.45 percent, compared with 0.82 percent on similar-maturity commercial paper.

Financial firms’ short-term debts, including commercial paper, certificates of deposit and time deposits, make up U.S. prime funds’ biggest holdings. Bank of Tokyo-Mitsubishi UFJ Ltd., Credit Agricole SA, Sumitomo Mitsui Bank Corp., Royal Bank of Canada and DNB Bank ASA comprise the top five issuers of this debt held by the funds,according to Crane Data LLC.
Longer maturities and more diversification are part of the answer at Credit Agricole CIB, said Oskar Rogg, head of Treasury for the Americas in New York. “We certainly do have a lot with prime funds. But in terms of our relative dependence on that for funding our core assets,” it isn’t high.
Diversified Approach
Mitsubishi UFJ has also diversified the way it raises funds, including by acquiring foreign-currency deposits, according to Kazunobu Takahara, a spokesman in Tokyo. Sumitomo Mitsui plans to keep commercial paper as an option and aims to prioritize foreign-currency financing, said Takafumi Sasaki, a Tokyo-based spokesman.
Sandra Nunes at Toronto-based RBC and Even Westerveld at Oslo-based DNB declined to comment.
Issuers have other options as money-fund demand for commercial paper dwindles, including the market for repurchase agreements, where they borrow cash temporarily using securities as collateral, according to Joseph Abate, a money-market strategist at Barclays Plc in New York.
Banks are finding it more expensive to borrow across all maturities. Their average borrowing costs on longer-term debt are near the highest in more than two years, according to Bank of America Merrill Lynch indexes. Slowing economic growth is fostering concern that global central banks will keep interest rates low, crimping financial firms’ profits.
Swelling Holdings
With fund companies converting or closing prime offerings, the industry’s holdings of government securities have swelled. Taxable money-funds’ investments in government obligations rose to $1.47 trillion as of the end of January, from $1.18 billion in February 2015, according to Crane.
Estimates vary for the size of the next wave, when investors yank cash from prime funds. JPMorgan projects it will reach about $400 billion this year, while Barclays anticipates about $300 billion.
Peter Crane, president of the Westborough, Massachusetts-based firm that tracks the industry, expects that only about $250 billion will leave prime funds, because he predicts investors will still favor the higher rates on those products and given his expectation that net asset values of prime funds will remain stable. Institutional prime funds’ seven-day yield was 0.21 percent as of Jan. 31, compared with 0.1 percent for government funds, Crane data show.
‘High Demand’
Even at the lower amount that Crane predicts, the flow of funds may push up borrowing costs on commercial paper relative to Treasury bill rates, which have crept up from near zero after the Federal Reserve’s December liftoff.
“Government securities will be in high demand, depressing the yields there, and the demand for credit instruments will be smaller,” said Peter Yi, Chicago-based director of short-term fixed income at Northern Trust Corp., which manages $875 billion. “As that happens, we’re forecasting spreads between commercial paper rates and government securities to widen.”
The SEC joined the Fed and the Treasury Department in moving to buttress money funds following the collapse of the $62.5 billion Reserve Primary Fund after bets on Lehman Brothers Holdings Inc. debt soured. The fund’s failure triggered a run on other money funds and brought the market for commercial paper, worth $1.76 trillion at the time, to a standstill. The market has since shrunk to about $1.1 trillion, with U.S. money funds holding about $380 billion, Crane data show.
The new regulations give investors a bundle of incentives to dump prime funds. In addition to forcing institutional prime funds’ net asset values to float daily based on underlying holdings, the rules will also allow the funds — for both retail and institutional holders — to take steps such as temporary fees on withdrawals to reduce runs.
The commercial paper market may shrivel by an additional 15 percent, according to Abate at Barclays.
He had originally expected the migration of money to take place next quarter. But with global financial-market turmoil sparking concern over the health of banks and traders trimming bets on Fed rate increases, investors may have little reason to wait, he said.
“The market is going to contract and yields are going to get higher,” he said.
http://www.bloomberg.com/news/articles/2016-02-23/the-400-billion-money-fund-exodus-with-banks-in-its-crosshairs
Do Americans Live In A False Reality Created By Orchestrated Events?
Paul Craig Roberts
Feb. 25, 2016
Most people who are aware and capable of thought have given up on what is called the “mainstream media.” The presstitutes have destroyed their credibility by helping Washington to lie—“Saddam Hussein’s weapons of mass destruction,” “Iranian nukes,” “Assad’s use of chemical weapons,” “Russian invasion of Ukraine,” and so forth. The “mainstream media” has also destroyed its credibility by its complete acceptance of whatever government authorities say about alleged “terrorist events,” such as 9/11 and Boston Marathon Bombing, or alleged mass shootings such as Sandy Hook and San Bernardino. Despite glaring inconsistencies, contradictions, and security failures that seem too unlikely to be believable, the “mainstream media” never asks questions or investigates. It merely reports as fact whatever authorities say.
The sign of a totalitarian or authoritarian state is a media that feels no responsibility to investigate and to find the truth, accepting the role of propagandist instead. The entire Western media has been in the propaganda mode for a long time. In the US the transformation of journalists into propagandists was completed with the concentration of a diverse and independent media in six mega-corporations that are no longer run by journalists.
As a consequence, thoughtful and aware people increasingly rely on alternative media that does question, marshall facts, and offers analysis in place of an unbelievable official story line.
The prime example is 9/11. Large numbers of experts have destroyed the official story that has no factual evidence in its behalf. However, even without the hard evidence that 9/11 truthers have provided, the official story gives itself away. We are supposed to believe that a few Saudi Arabians with no technology beyond box cutters and no support from any government’s intelligence service were able to outwit the massive surveillance technology created by DARPA (Defense Advanced Research Projects Agency) and NSA (National Security Agency) and deal the most humiliating blow to a superpower ever delivered in human history. Moreover, they were able to do this without the President of the United States, the US Congress, and the “mainstream media” demanding accountability for such a total failure of the high-tech national security state. Instead of a White House led investigation of such a massive security failure, the White House resisted for more than one year any investigation whatsoever until finally giving in to demands from 9/11 families that could not be bought off and agreeing to a 9/11 Commission.
The Commission did not investigate but merely sat and wrote down the story told to it by the government. Afterwards, the Commission’s chairman, co-chairman, and legal counsel wrote books in which they said that information was withheld from the Commission, that the Commission was lied to by officials of the government, and that the Commission “was set up to fail.” Despite all of this, the presstitutes still repeat the official propaganda, and there remain enough gullible Americans to prevent accountability.
Competent historians know that false flag events are used to bring to fruition agendas that cannot otherwise be achieved. 9/11 gave the neoconservatives, who controlled the George W. Bush administration, the New Pearl Harbor that they said was necessary in order to launch their hegemonic military invasions of Muslim countries. The Boston Marathon Bombing permitted a trial run of the American Police State, complete with shutting down a large American city, putting 10,000 armed troops and SWAT teams on the streets where the troops conducted house to house searches forcing the residents out of their homes at gunpoint. This unprecedented operation was justified as necessary in order to locate one wounded 19 year old man, who clearly was a patsy.
There are so many anomalies in the Sandy Hook story that it has generated a cottage industry of skeptics. I agree that there are anomalies, but I don’t have the time to study the issue and come to my own conclusion. What I have noticed is that we are not given many good explanations of the anomalies. For example, in this video made from the TV news coverage, https://www.youtube.com/watch?v=xaHtxlSDgbk the video’s creator makes a case that the person who is the grieving father who lost his son is the same person outfitted in SWAT clothes at Sandy Hook following the shooting. The person is identified as a known actor. Now, it seems to me that this is easy to test. The grieving father is known, the actor is known, and the authorities have to know who the SWAT team member is. If these three people, who can pass for one another, can be assembled in one room at the same time, we can dismiss the expose claimed in this one video. However, if three separate people cannot be produced together, then we must ask why this deception, which raises questions about the entire story. You can watch the entire video or just skip to the 9:30 mark and observe what appears to be the same person in two different roles.
The “mainstream media” has the ability to make these simple investigations, but does not. Instead, the “mainstream media” calls skeptics “conspiracy theorists.”
There is a book by Professor Jim Fetzer and Mike Palecek that says Sandy Hook was a FEMA drill to promote gun control and that no one died at Sandy Hook. The book was available on amazon.com but was suddenly banned. Why ban a book?
Here is a free download of the book: http://rense.com/general96/nobodydied.html I have not read the book and have no opinion. I do know, however, that the police state that America is becoming certainly has a powerful interest in disarming the public. I also heard today a news report that people said to be parents of the dead children are bringing a lawsuit against the gun manufacturer, which is consistent with Fetzer’s claim.
Here is a Buzzsaw interview with Jim Fetzer: https://www.youtube.com/watch?v=f-W3rIEe-ag If the information Fetzer provides is correct, clearly the US government has an authoritarian agenda and is using orchestrated events to create a false reality for Americans in order to achieve the agenda.
It seems to me that Fetzer’s facts can be easily checked. If his facts check out, then a real investigation is required. If his facts do not check out, the official story gains credibility as Fetzer is one of the most energetic skeptics.
Fetzer cannot be dismissed as a kook. He graduated magna cum laude from Princeton University, has a Ph.D. from Indiana University and was Distinguished McKnight University Professor at the University of Minnesota until his retirement in 2006. He has had a National Science Foundation fellowship, and he has published more than 100 articles and 20 books on philosophy of science and philosophy of cognitive science. He is an expert in artificial intelligence and computer science and founded the international journal Minds and Machines. In the late 1990s, Fetzer was asked to organize a symposium on philosophy of mind.
For an intelligent person, the official stories of President Kennedy’s assassination and 9/11 are simply not believable, because the official stories are not consistent with the evidence and what we know. Fetzer’s frustration with less capable and less observant people increasingly shows, and this works to his disadvantage.
It seems to me that if the authorities behind the official Sandy Hook story are secure with the official story, they would jump on the opportunity to confront and disprove Fetzer’s facts. Moreover, somewhere there must be photographs of the dead children, but, like the alleged large number of recordings by security cameras of an airliner hitting the Pentagon, no one has ever seen them. At least not that I know of.
What disturbs me is that no one in authority or in the mainstream media has any interest in checking the facts. Instead, those who raise awkward matters are dismissed as conspiracy theorists.
Why this is damning is puzzling. The government’s story of 9/11 is a story of a conspiracy as is the government’s story of the Boston Marathon Bombing. These things happen because of conspiracies. What is at issue is: whose conspiracy? We know from Operation Gladio and Operation Northwoods that governments do engage in murderous conspiracies against their own citizens. Therefore, it is a mistake to conclude that governments do not engage in conspiracies.
One often hears the objection that if 9/11 was a false flag attack, someone would have talked.
Why would they have talked? Only those who organized the conspiracy would know. Why would they undermine their own conspiracy?
Recall William Binney. He developed the surveillance system used by NSA. When he saw that it was being used against the American people, he talked. But he had taken no documents with which to prove his claims, which saved him from successful prosecution but gave him no evidence for his claims. This is why Edward Snowden took the documents and released them. Nevertheless, many see Snowden as a spy who stole national security secrets, not as a whistleblower warning us that the Constitution that protects us is being overthrown.
High level government officials have contradicted parts of the 9/11 official story and the official story that links the invasion of Iraq to 9/11 and to weapons of mass destruction. Transportation Secretary Norman Mineta contradicted Vice President Cheney and the official 9/11 story timeline. Treasury Secretary Paul O’Neill has said that overthrowing Saddam Hussein was the subject of the first cabinet meeting in the George W. Bush administration long before 9/11. He wrote it in a book and told it on CBS News’ 60 Minutes. CNN and other news stations reported it. But it had no effect.
Whistleblowers pay a high price. Many of them are in prison. Obama has prosecuted and imprisoned a record number. Once they are thrown in prison, the question becomes: “Who would believe a criminal?”
As for 9/11 all sorts of people have talked. Over 100 police, firemen and first responders have reported hearing and experiencing a large number of explosions in the Twin Towers. Maintanence personnel report experiencing massive explosions in the sub-basements prior to the building being hit by an airplane. None of this testimony has had any effect on the authorities behind the official story or on the presstitutes.
There are 2,300 architects and engineers who have written to Congress requesting a real investigation. Instead of the request being treated with the respect that 2,300 professionals deserve, the professionals are dismissed as “conspiracy theorists.”
An international panel of scientists have reported the presence of reacted and unreacted nanothermite in the dust of the World Trade Centers. They have offered their samples to government agencies and to scientists for confirmation. No one will touch it. The reason is clear. Today science funding is heavily dependent on the federal government and on private companies that have federal contracts. Scientists understand that speaking out about 9/11 means the termination of their career.
The government has us where it wants us—powerless and disinformed. Most Americans are too uneducated to be able to tell the difference between a building falling down from asymetrical damage and one blowing up. Mainstream journalists cannot question and investigate and keep their jobs. Scientists cannot speak out and continue to be funded.
Truth telling has been shoved off into the alternative Internet media where I would wager the government runs sites that proclaim wild conspiracies, the purpose of which is to discredit all skeptics.
http://www.paulcraigroberts.org/2016/02/24/do-americans-live-in-a-false-reality-created-by-orchestrated-events-paul-craig-roberts/
Survey Reveals Business Is Trusted More Than Government Around The World
Niall McCarthy
Forbes Contributor
Feb. 25, 2016
Edelman’s 2016 Trust Barometer has revealed that people in most countries around the world trust the business sector more than their governments. Mexico has the most pronounced disparity out of the 28 countries surveyed with 76 percent of people trusting business compared to a mere 32 percent trusting the government. Such a deep-founded lack of trust in the authorities should come as little surprise considering the country’s high rate of drug-related violence, corruption scandals and high poverty levels.
The trust gap is similar in Brazil but narrows considerably in India where business edges the government by a few percentage points. In the United States and Great Britain, people also have more trust in the business sector than the government. In a small group of countries, however, the government comes first for trust. People in China, Russia and South Korea all had more faith in the government than in business according to Edelman.
link the the Edleman Trust Barometer; http://www.edelman.com/insights/intellectual-property/2016-edelman-trust-barometer/

"Credit Risk Is Growing," FDIC Warns As Loss Provisions Jump $3.8 Billion In 3 Months
02/24/2016
On Tuesday, we got the answer (or at least a partial answer) to the question we posed last month when we asked the following: “How long before the impairments and charges currently targeting smaller firms finally shift to the bigger ones? And how underreserved is JPMorgan for that eventuality?”
We were of course referring to JPMorgan’s exposure to America’s dying oil patch where a rash of defaults and bankruptcies are just around the corner once the bevy of cash flow negative producers see their credit facilities cut by 10-20% when RBL is reevaluated in April.
What prompted us to ask specifically about JPMorgan’s exposure was the fact that in Q4, the bank did something it hasn’t done in 22 quarters: it increased loan loss provisions.

That very likely had to do with the worsening prospects for its energy book where O&G exposure is a whopping $44 billion against which the bank said yesterday it will now provision an exra $500 million in Q1 of 2016. That brings total provisions against JPMorgan's energy exposure to $1.3 billion, or around 3%. Of the total $44 billion in energy exposure, $19 billion is HY or, junk.

Of course that's just one bank. What we don't know is what the breakdown looks like for other large, systemically important institutions, nor do we have any idea what the granular data is for the banking sector is as a whole.
What we do know, however, is that when you look out across 6,182 FDIC-insured institutions, provisions have been on the rise for six consecutive quarters and they jumped sharply in Q4, rising $3.8 billion in total.

"Some of the increase in loss provisions is attributable to stress in the energy sector," the FDIC said, adding that "there are signs of growing credit risk, particularly among loans related to energy and agriculture."
Yes, "particularly" there. Given the fact that banks habitually put off setting aside adequate reserves in order to "smooth" out earnings, one wonders what the Q4 numbers would have looked like had provisions been appropriately large. And that raises the next question: what will Wall Street's earnings look like when postponing the inevitable is no longer possible?
http://www.zerohedge.com/news/2016-02-24/credit-risk-growing-fdic-warns-loss-provisions-jump-38-billion-3-months
Has The Market Crash Only Just Begun ? (video)
Universa Investments President and CIO Mark Spitznagel discusses the volatile markets. Prudential Fixed Income's Michael Collins also speaks on "Bloomberg ‹GO›." (Source: Bloomberg)
http://www.bloomberg.com/news/videos/2016-02-17/has-the-market-crash-only-just-begun
The FOMC's Lawless Nature
Karl Denninger
Feb. 20, 2016
I refuse to entertain any sort of discussion on a so-called "Convention of States" or anything similar until and unless I see The Rule of Law mean something once again.
The Federal Reserve is one of the most-flagrant examples of an institution that willfully, intentionally, publicly and repeatedly violates black letter law on a daily basis and yet nobody is arrested, charged, jailed, nor does Congress even amend or threaten to pull their charter if they don't cut it out.
In this post, I focus on the inflation-targeting portion of the Federal Open Market Committee’s (FOMC) broader mandate of promoting maximum employment, stable prices and moderate long-term interest rates, and why I dissented on the proposed amendments to the “Statement of Longer-Run Goals” at the FOMC’s January 2016 meeting.
The FOMC has an inflation target of 2 percent, which it made explicit four years ago in its January 2012 “Statement on Longer-Run Goals and Monetary Policy Strategy.”
The admission of intentional violation of the law is right there in the first two paragraphs. A 2% inflation rate means that over the space of 30 years a cumulative rise in prices of 81% occurs.
That is, quite-obviously, not "stable."
It is one thing to have a realized rate of inflation that does not end in "stable prices", since the Fed Mandate is to promote stable prices. That is, they probably could argue that their intent was stable prices but failed; that would be a failure to perform but not a violation of the law so long as it wasn't intentional.
But to state an intent to violate the law, and I remind you that the Fed Charter is not a suggestion, it is law, without drawing an immediate response in the form of either direct enforcement or Congressional action to force compliance is outrageous.
A law that is not evenly enforced, or enforced at all, is not law. It doesn't even rise to the level of "suggestion" as it is instead a cudgel used only against those who are deemed "lesser" by those in power.
To be blunt nobody has a duty to obey any alleged "law" so long as such a political system is in place that a law can be passed a literal one hundred years ago that is then serially, repeatedly, continually and openly violated without consequence adhering to those who not only violate same but publicly proclaim their intent to do so.
That the people of this nation have up until now tolerated such abuse is extraordinary, but nobody should believe that this tolerance will be permanent or that when it finally fails what replaces it will be in any way orderly or reasonable because history says that it almost-never is.
http://market-ticker.org/akcs-www?post=231133
The US Economy Has Not Recovered And Will Not Recover
Paul Craig Roberts
02/19/2016
The US economy died when middle class jobs were offshored and when the financial system was deregulated.
Jobs offshoring benefitted Wall Street, corporate executives, and shareholders, because lower labor and compliance costs resulted in higher profits. These profits flowed through to shareholders in the form of capital gains and to executives in the form of “performance bonuses.” Wall Street benefitted from the bull market generated by higher profits.
However, jobs offshoring also offshored US GDP and consumer purchasing power. Despite promises of a “New Economy” and better jobs, the replacement jobs have been increasingly part-time, lowly-paid jobs in domestic services, such as retail clerks, waitresses and bartenders.
The offshoring of US manufacturing and professional service jobs to Asia stopped the growth of consumer demand in the US, decimated the middle class, and left insufficient employment for college graduates to be able to service their student loans. The ladders of upward mobility that had made the United States an “opportunity society” were taken down in the interest of higher short-term profits.
Without growth in consumer incomes to drive the economy, the Federal Reserve under Alan Greenspan substituted the growth in consumer debt to take the place of the missing growth in consumer income. Under the Greenspan regime, Americans’ stagnant and declining incomes were augmented with the ability to spend on credit. One source of this credit was the rise in housing prices that the Federal Reserves low inerest rate policy made possible. Consumers could refinance their now higher-valued home at lower interest rates and take out the “equity” and spend it.
The debt expansion, tied heavily to housing mortgages, came to a halt when the fraud perpetrated by a deregulated financial system crashed the real estate and stock markets. The bailout of the guilty imposed further costs on the very people that the guilty had victimized.
Under Fed chairman Bernanke the economy was kept going with Quantitative Easing, a massive increase in the money supply in order to bail out the “banks too big to fail.” Liquidity supplied by the Federal Reserve found its way into stock and bond prices and made those invested in these financial instruments richer. Corporate executives helped to boost the stock market by using the companies’ profits and by taking out loans in order to buy back the companies’ stocks, thus further expanding debt.
Those few benefitting from inflated financial asset prices produced by Quantitative Easing and buy-backs are a much smaller percentage of the population than was affected by the Greenspan consumer credit expansion. A relatively few rich people are an insufficient number to drive the economy.
The Federal Reserve’s zero interest rate policy was designed to support the balance sheets of the mega-banks and denied Americans interest income on their savings. This policy decreased the incomes of retirees and forced the elderly to reduce their consumption and/or draw down their savings more rapidly, leaving no safety net for heirs.
Using the smoke and mirrors of under-reported inflation and unemployment, the US government kept alive the appearance of economic recovery. Foreigners fooled by the deception continue to support the US dollar by holding US financial instruments.
The official inflation measures were “reformed” during the Clinton era in order to dramatically understate inflation. The measures do this in two ways. One way is to discard from the weighted basket of goods that comprises the inflation index those goods whose price rises. In their place, inferior lower-priced goods are substituted.
For example, if the price of New York strip steak rises, round steak is substituted in its place. The former official inflation index measured the cost of a constant standard of living. The “reformed” index measures the cost of a falling standard of living.
The other way the “reformed” measure of inflation understates the cost of living is to discard price rises as “quality improvements.” It is true that quality improvements can result in higher prices. However, it is still a price rise for the consumer as the former product is no longer available. Moreover, not all price rises are quality improvements; yet many prices rises that are not can be misinterpreted as “quality improvements.”
These two “reforms” resulted in no reported inflation and a halt to cost-of-living adjustments for Social Security recipients. The fall in Social Security real incomes also negatively impacted aggregate consumer demand.
The rigged understatement of inflation deceived people into believing that the US economy was in recovery. The lower the measure of inflation, the higher is real GDP when nominal GDP is deflated by the inflation measure. By understating inflation, the US government has overstated GDP growth.
What I have written is easily ascertained and proven; yet the financial press does not question the propaganda that sustains the psychology that the US economy is sound. This carefully cultivated psychology keeps the rest of the world invested in dollars, thus sustaining the House of Cards.
John Maynard Keynes understood that the Great Depression was the product of an insufficiency of consumer demand to take off the shelves the goods produced by industry. The post-WW II macroeconomic policy focused on maintaining the adequacy of aggregate demand in order to avoid high unemployment. The supply-side policy of President Reagan successfully corrected a defect in Keynesian macroeconomic policy and kept the US economy functioning without the “stagflation” from worsening “Philips Curve” trade-offs between inflation and employent. In the 21st century, jobs offshoring has depleted consumer demand’s ability to maintain US full employment.
The unemployment measure that the presstitute press reports is meaningless as it counts no discouraged workers, and discouraged workers are a huge part of American unemployment. The reported unemployment rate is about 5%, which is the U-3 measure that does not count as unemployed workers who are too discouraged to continue searching for jobs.
The US government has a second official unemployment measure, U-6, that counts workers discouraged for less than one-year. This official rate of unemployment is 10%.
When long term (more than one year) discouraged workers are included in the measure of unemployment, as once was done, the US unemployment rate is 23%. (See John Williams, shadowstats.com)
Fiscal and monetary stimulus can pull the unemployed back to work if jobs for them still exist domestically. But if the jobs have been sent offshore, monetary and fiscal policy cannot work.
What jobs offshoring does is to give away US GDP to the countries to which US corporations move the jobs. In other words, with the jobs go American careers, consumer purchasing power and the tax base of state, local, and federal governments. There are only a few American winners, and they are the shareholders of the companies that offshored the jobs and the executives of the companies who receive multi-million dollar “performance bonuses” for raising profits by lowering labor costs. And, of course, the economists, who get grants, speaking engagements, and corporate board memberships for shilling for the offshoring policy that worsens the distribution of income and wealth. An economy run for a few only benefits the few, and the few, no matter how large their incomes, cannot consume enough to keep the economy growing.
In the 21st century US economic policy has destroyed the ability of real aggregate demand in the US to increase. Economists will deny this, because they are shills for globalism and jobs offshoring. They misrepresent jobs offshoring as free trade and, as in their ideology free trade benefits everyone, claim that America is benefitting from jobs offshoring. Yet, they cannot show any evidence whatsoever of these alleged benefits. (See my book, The Failure of Laissez Faire Capitalism and Economic Dissolution of the West.)
As an economist, it is a mystery to me how any economist can think that a population that does not produce the larger part of the goods that it consumes can afford to purchase the goods that it consumes. Where does the income come from to pay for imports when imports are swollen by the products of offshored production?
We were told that the income would come from better-paid replacement jobs provided by the “New Economy,” but neither the payroll jobs reports nor the US Labor Departments’s projections of future jobs show any sign of this mythical “New Economy.”
There is no “New Economy.” The “New Economy” is like the neoconservatives promise that the Iraq war would be a six-week “cake walk” paid for by Iraqi oil revenues, not a $3 trillion dollar expense to American taxpayers (according to Joseph Stiglitz and Linda Bilmes) and a war that has lasted the entirety of the 21st century to date, and is getting more dangerous.
The American “New Economy” is the American Third World economy in which the only jobs created are low productivity, low paid nontradable domestic service jobs incapable of producing export earnings with which to pay for the goods and services produced offshore for US consumption.
The massive debt arising from Washington’s endless wars for neoconservative hegemony now threaten Social Security and the entirety of the social safety net. The presstitute media are blaming not the policy that has devasted Americans, but, instead, the Americans who have been devasted by the policy.
Earlier this month I posted readers’ reports on the dismal job situation in Ohio, Southern Illinois, and Texas. In the March issue of Chronicles, Wayne Allensworth describes America’s declining rural towns and once great industrial cities as consequences of “globalizing capitalism.” A thin layer of very rich people rule over those “who have been left behind”—a shrinking middle class and a growing underclass. According to a poll last autumn, 53 percent of Americans say that they feel like a stranger in their own country.
Most certainly these Americans have no political representation. As Republicans and Democrats work to raise the retirement age in order to reduce Social Security outlays, Princeton University experts report that the mortality rates for the white working class are rising. The US government will not be happy until no one lives long enough to collect Social Security.
The United States government has abandoned everyone except the rich.
In the opening sentence of this article, I said that the two murderers of the American economy were jobs offshoring and financial deregulation. Deregulation greatly enhanced the ability of the large banks to financialize the economy. Financialization is the diversion of income streams into debt service. When debt service absorbs a large amount of the available income, the economy experiences debt deflation. The service of debt leaves too little income for purchases of goods and services and prices fall.
Michael Hudson, who I recently wrote about, is the expert on finanialization. His book, Killing the Host, which I recommended to you, tells the complete story. Briefly, financialization is the process by which creditors capitalize an economy’s economic surplus into interest payments to themselves. Perhaps an example would be a corporation that goes into debt in order to buy back its shares. The corporation achieves a temporary boost in its share prices at the cost of years of interest payments that drain the corporation of profits and deflate its share price.
Michael Hudson stresses the conversion of the rental value of real estate into mortgage payments. He emphasizes that classical economists wanted to base taxation not on production, but on economic rent. Economic rent is value due to location or to a monopoly position. For example, beachfront property has a higher price because of location. The difference in value between beachfront and nonbeachfront property is economic rent, not a produced value. An unregulated monopoly can charge a price for a service that is higher than the price that would bring that service unto the market.
The proposal to tax economic rent does not mean taxing you on the rent that you pay your landlord or taxing your landlord on the rent that you pay him such that he ceases to provide the housing. By economic rent Hudson means, for example, the rise in land values due to public infrastructure projects such as roads and subway systems. The rise in the value of land opened by a new road and in housing and commercial space along a new subway line is not due to any action of the property owners. This rise in value could be taxed in order to pay for the project instead of taxing the income of the population in general. Instead, the rise in land values raises appraisals and the amount that creditors are willing to lend on the property. New purchasers and existing owners can borrow more on the property, and the larger mortgages divert the increased land valuation into interest payments to creditors. Lenders end up as the major beneficiaries of public projects that raise real estate prices.
Similarly, unless the economy is financialized to such an extent that mortgage debt can no longer be serviced, when central banks lower interest rates property values rise, and this rise can be capitalized into a larger mortgage.
Another example would be property tax reductions and legislation such as California’s Proposition 13 that freeze in whole or part the property tax base. The rise in real estate values that escape taxation are capitalized into larger mortgages. New buyers do not benefit. The beneficiaries are the lenders who capture the rise in real estate prices in interest payments.
Taxing economic rent would prevent the financial system from capitalizing the rent into debt instruments that pay interest to the financial sector. Considering the amount of rents available to be taxed, taxing rents would free production from income and sales taxation, thus lowering consumer prices and freeing labor and productive capital from taxation.
With so much of land rent already capitalized into debt instruments shifting the tax burden to economic rent would be challenging. Nevertheless, Hudson’s analysis shows that financialization, not wage suppression, is the main instrument of exploitation and takes place via the financial system’s conversion of income streams into interest payments on debt.
I remember when mortgage service was restricted to one-quarter of household income. Today mortgage service can eat up half of household income. This extraordinary growth crowds out the production of goods and services as less of household income is available for other purchases.
Michael Hudson and I bring a total indictment of the neoliberal economics profession, “junk economists” as Hudson calls them.
http://www.zerohedge.com/news/2016-02-19/us-economy-has-not-recovered-and-will-not-recover
Has The Market Crash Only Just Begun?
zerohedge.com
02/19/2016
Having successfully called the market's retreat in the fall of 2015, Universa's Mark Spitznagel is not taking a victory lap as he warns Bloomberg TV that "the crash has only just begun."
Investors are facing the most binary "let's make a deal" market in history in Spitznagel's view: choose Door #1 to bet on Keynesianism, central planners, and monetary interventionism; or Door #2 to bet on free markets and natural price discovery.
"There is massive cognitive dissonance here," Spitznagel explains as history teaches us that door #2 is the right choice... but it's not possible to do that today as investors have been coerced to choose door #1, but when door #1 is slammed open "we will see that dreaded black swan monster."
That is what is going on right now:
"Investors want to go with The Fed when it's working - like David Zervos... the problem is, when do you know that it is not working?"
"At some point this stops working..."
"the market is going through a resolution process, transitioning from the cognitive dissonance of Door #1 to the harsh reality of Door #2... if everyone were to change doors at the same time, that is a market crash... it can't be done in a non-messy way."
Must watch reality check behind the smoke and mirrors we call markets... (we note Mark's excellent analogy starting at around 3:10)
http://www.zerohedge.com/news/2016-02-19/has-market-crash-only-just-begun
The World's Top Performing Hedge Fund Just Went Record Short, Explains Why
zerohedge.com
02/12/2016
Last month, in our latest profile of the $2.8 billion Horseman Capital, we said that not only has that fund which some have called the "most bearish in the world" generated tremendous returns almost every single year since inception (except for a 25% drop in 2009 after returning 31% during the cataclysmic 2008), but more notably, it has been net short - and quite bearish on - stocks ever since 2012. In that period it has consistently generated low double-digit returns, a feat virtually none of its competitors have managed to replicate. In fact, its performance has put it in the top percentile of all hedge funds in recent years.
Furthermore, in a year most other hedge funds would love to forget, the fund "crushed it", with a 20.45% return for 2015 and 5.6% in the tumultuous month of December.
Today, we got Horseman's latest numbers and they are a doozy: in what was one of the worst Januarys in stock market history, the fund returned a whopping 8%, putting it in the 99%+ percentile of returns for the month (and the year).

Indeed, "crushing it" is hardly new to Horseman: it has been doing so for four years in a row, and not surprisingly, 2015 was its best year since 2008. 2016 is starting off just as good as the prior year.

How did Horseman generate another month of phenomenal returns? In its own words:
This month strong gains came from the short equity book, in particular from the automobile, real estate and EM financials sectors while the long portfolio incurred a loss.
This is what Horseman's sector allocation looks like as of this moment:
Headlines were made last year by the clampdown of the Chinese authorities on the Macau casinos, who had been allowing Chinese residents to move their winnings out of China. However, despite the clampdown and the following fall in casino revenues by some 34% in 2015 (source: Macau's Gaming Inspection and Coordination Bureau), capital outflows have continued via other channels.
Imports from Hong Kong to China jumped 64% year on year in December, but the same numbers released in Hong Kong showed a 0.9% increase (sources: China and Hong Kong customs data). This could be explained by the practice of over-invoicing of Chinese imports from Hong Kong with trading partners that agree to inflate the cost of goods before a letter of credit is issued.
Chinese companies were involved in foreign acquisitions worth a total of $656bn last year and already this year, four of the biggest cross-border deals have involved Chinese groups bidding for US and European assets worth $61.7bn in total (source: FT).
Over the past few years Chinese companies have issued a large amount of US dollar denominated debt (see Russell Clark’s market note entitled ‘Spotting property Bubbles in East Asia’), in 2015 they sold a total of $60.3 billion worth of dollar-denominated bonds, more than six times the 2010 figure (source: Thomson Reuters data). In August last year, as China’s monetary authorities gave the signal that the Renminbi was not immune to devaluations, companies started to reduce their dollar exposure. Recently China SCE Property Holdings Limited said that it would redeem its $350 million senior note due 2017, while another real estate company, SUNAC China Holdings Limited said it had completed the redemption of its dollar note due next year.
China’s currency reserves declined by $420bn over the past 6 months and in January they plunged by $99.5bn (source: PBOC). The fund maintains a short exposure to sectors exposed to a renminbi devaluation such as luxury brands and Chinese property developers, and to other Asian currencies that would also have to devalue, such as the Korean Won and Singapore dollar.
In other words, another adherent to the "China will blow up" philosophy, which it may, however unlike Kyle Bass and a cohort of other China-bearish hedge funds, Horseman is instead betting on select Chinese sector shorts, as well as China's currency devaluation although not by shorting the Yuan, and instead is bearish on the Won and the SGD.
What was the fund most bearish on? Pretty much everything, but a few sectors in particular:

However, what is most remarakable about the hedge fund, is that while it has maintained its gross exposure, as of January 31, the fund's net short exposure has risen to a whopping 76%, an all time high, even for one of the world's most bearish hedge funds.

Finally or those seeking to glean some wisdom from the Horseman's inimitable Chief Investment Manager, Russell Clark, here is his latest letter.
* * *
My wife and I went see to the “The Big Short” the other day. It was certainly very amusing, and explained difficult financial concepts well. I will put it up there in my top three finance based films, along with “Trading Places” and “Margin Call”. I found Margin Call to be the least appreciated of these films, and yet for me most closely matches up to life in an investment bank in the 21st century.
For those that have not seen it, the film centres on a junior risk analyst, who discovers that the potential losses on the bank’s holding of mortgage assets were larger than its market capitalisation. He immediately informs his colleagues, who then pass it onto senior management. One of the recurring themes of the movie, is that the junior low paid staff are all maths and excel spreadsheet gurus, and the upper management are luddites. The junior risk analyst shows his excel model to management, and is constantly told “You know I don’t like these spreadsheets, just tell me what’s going on”. The analyst is eventually introduced to the Chairman of the Board, who asks him to “please, speak as you might to a young child. Or a golden retriever. It wasn't brains that brought me here; I assure you that.”
If you were unfamiliar with the world of finance, you would think this grossly unfair. The brainboxes of the world toil endlessly, while their know-nothing bosses take home the big bucks. However, I think this is wrong. As the Chairman of the Board elaborates, the reason he earns the big bucks is, “I'm here for one reason and one reason alone. I'm here to guess what the music might do a week, a month, a year from now. That's it. Nothing more.” The music in this case would be market prices.
The crux of the matter is that anyone telling you what the market is doing now, what the value of something is now, is providing you a freely available commodity; even if, in the cases of some derivative products, you need to be a rocket scientist to be able to give a valuation today. The real value add in markets is to be able to see what future values might be; that is to live in the future, not in the present.
I spend most of my time, while looking at current prices, thinking about and trying to live six months to one year in the future. Thinking about what will be the reaction to what is happening now, and then thinking about what that means future prices might look like. Generally that has worked well for me.
What I can see now is that US growth is slowing, and that the market is likely to price in reduced monetary tightening.
This should lead to a weaker dollar. This makes shorting Europe and Japan very appealing. Theoretically, this should make commodities and emerging markets (‘EM’) attractive, particularly if you are of the view that US dollar strength is the reason emerging markets and commodities have been so weak. However, I think we have chronic oversupply of commodities, and real financial issues in China that cannot be resolved easily. This makes commodity related areas very unattractive, despite the prospect of renewed monetary easing by the Federal Reserve. Furthermore, the reaction to reduced tightening by the Federal Reserve, would almost certainly be more easing by every other central bank in the world. But as we have seen recently with both the ECB and BOJ, monetary activism is not always effective.
I also worry about the prospects of a trade war, as populism becomes the new normal in politics globally. The future for me is now more uncertain than at any time I can remember. Or to fully quote the Chairman of the Board from Margin Call, “I'm here to guess what the music might do a week, a month, a year from now. That's it. Nothing more. And standing here tonight, I'm afraid that I don't hear - a - thing. Just... silence.”
Your fund remains long bonds, short equities.
http://www.zerohedge.com/news/2016-02-12/one-worlds-top-performing-hedge-funds-just-went-record-short-explains-why
One Of The Biggest High Frequenecy Traders Warns Of Potential Market "Catastrophe"
02/04/2016
Back in April 2009, we wrote what may be the first seminal article predicting the failure of capital markets as a result of widespread predatory high frequency trading and fragmented market structure when we laid out "The Incredibly Shrinking Market Liquidity, Or The Upcoming Black Swan Of Black Swans." Several years later, and countless flash crashes, we have been proven right, however one thing is missing: "the catastrophe" that finally wakes up people to the dangers of all the individual things we have warned about over the years.
Today, we are one step closer to that day, when none other than the head of one of the biggest high-frequency trading companies, Mark Gorton of Tower Research, warned that there are several faultlines in the structure of increasingly electronic, automated financial markets that could lead to a “catastrophe” in the long run, according to the FT.
To be sure, Mark Gorton, has a clear conflict of interest: being one of the largest HFT members himself, with his company dominating program trading on the NYSE with his Latour Trading subsiiary, the founder and head of Tower Research Capital argued that exchanges have become far more efficient with the advent of more computerised markets, but "cautioned that increasing complexity brought new dangers that needed to be mitigated."
In other words, don't blame the HFTs, blame the markets, which is to be expected from a person who will be out of a job if HFT is banned.
He further adds that "The recent evolution of markets from manual to electronic trading has had huge benefits and investors save money every day due to the lower cost of trading. But electronic trading brings with it a number of new risks, and we need to continue to strengthen the resiliency of electronic markets," Mr Gorton told the Financial Times.
What keeps Gorton up at night? The short answer: the lack of safeguards at exchanges to prevent HFT firms like his from dragging the whole thing down:
The high-frequency trader is particularly concerned over the lack of risk controls at exchanges, which he said constituted a “large hole in the middle of the system that needs to be filled”.
HFT outfits and investment groups that use algorithmic strategies say they have a latticework of different safeguards to prevent ultra-fast computerised strategies from running haywire, which has been further reinforced after one high-profile market maker, Knight Capital, imploded in 2012 after losing $10m a minute in a 45-minute electronic trading rampage.
Regulators and bourses such as the New York Stock Exchange and Nasdaq have introduced a clutch of reforms and firebreaks in recent years — especially in the wake of a “flash crash” in 2010 that underscored how automated markets have become — such as circuit-breakers when stocks or markets fall by a certain amount.
Nonetheless, exchange-level risk controls remain “limited at best” and should assume there will inevitably be glitches, bugs and errant trading algorithms that could cause problems in the wider market, according to Mr Gorton.
Glitches from algorithms, he forgot to add, such as the one Tower uses each and every day to scalp and frontrun billions of trades in order flow.
However, his warning, conflicted as it is, is spot on: the market will crash again, it is only a matter of time, simply because the HFTs have captured market regulators so well, nobody has any idea what is going on any more: “We need a regulatory framework that assumes that any single system in the market will fail and insures that we have multiple redundant levels of checks that can catch failures in other parts of the system,” he said.
What is Gorton's suggestion?
Mr Gorton highlighted in particular the lack of a centralised position-tracking mechanism for the US stock market, the need to refine and synchronise market circuit-breakers between highly correlated markets, such as cash equities and futures, and the absence of clarity over what it takes for trades to be declared invalid.
In other words, focus on the symptoms, shutting down markets when things go haywire, not the underlying cause, which as we have said since 2009 is simple: broken markets, designed to benefit just one group of traders.
Exchanges can in certain cases cancel trades when there is “clearly erroneous execution”. Usually this happens automatically when someone tries to trade at a clearly illogical price, but bourses are given more latitude in times of extreme turbulence.
For HFT that help make markets by trading constantly at lightning speed, that can be problematic as it “creates a situation where market participants are forced to pull back during times of extreme stress due to uncertainty about their positions due to potential trade breaks, and this weakness can contribute to a crash in the future”, Mr Gorton said.
While electronic, computer-driven markets have been a boon to investors, some of these holes should be addressed, the former Credit Suisse trader and electrical engineer said.
“We’re creeping in the right direction, but unless we proactively address these issues, sometime in the next several decades we are going to experience a catastrophe due to runaway computerised trading,” Mr Gorton said.
One question remains, the biggest one: why come public with this warning, which even the most naive traders can between the lines on? The answer is simple - as we have predicted long before the Sarao debacle, once the next big crash happens, everyone will be looking for the scapegoat, and one will be readily available: the same market parasites who have long abused the broken market on the way up, getting rich beyond their wildest dreams, will be those blamed for everything that went wrong on the way down, if only to deflect from the farce that central bankers have unleashed upon capital markets: the High Frequency Traders. And judging by this FT piece, they now know it very well...
http://www.zerohedge.com/news/2016-02-04/one-biggest-high-frequenecy-traders-warns-potential-market-catastrophe
The Return Of Crisis
by Chris Martenson
Monday, February 8, 2016
Suddenly banks everywhere are in deep, deep trouble
Financial markets the world over are increasingly chaotic; either retreating or plunging. Our view remains that there’s a gigantic market crash in the coming future -- one that has possibly started now.
Our reason for expecting a market crash is simple: Bubbles always burst.
Bubbles arise when asset prices inflate above what underlying incomes can sustain. Centuries ago, the Dutch woke up one morning and discovered that tulips were simply just flowers after all. But today, the public has yet to wake up to the mathematical reality that over $200 trillion in debt and perhaps another $500 trillion of un(der)funded liabilities really cannot ever be paid back under current terms. However, this fact is dawning within the minds of more and more critical thinkers with each passing day.
In order for these obligations to be reset to a reality-based level, something has to give. The central banks have tried to modify the phrase “under current terms” by debasing the currency these obligations are written in via inflation. Try as they have, though, they’ve been unable to create the sort of "goldilocks" low-level inflation that would slowly sublimate that massive pile of debt into something more manageable.
Wide-spread inflation has not happened. Why not? Because they've failed to note that plan of handing all of their newly printed money to a very wealthy elite -- while a socially popular thing to do among the cocktail party set -- simply has concentrated the inflation to the sorts of assets the monied set buys: private jets, penthouse apartments, fine art, large gemstones, etc. So yes, their efforts produced price inflation; just of the wrong sort.
Even worse, all the central banks have really accomplished is to assure that when the deflation monster finally arrives it will be gigantic, highly damaging and possibly uncontrollable. I'll admit to being worried about this next crash/crisis because I imagine it will involve record-setting losses, human misery due to lost jobs and dashed dreams, and possibly even the prospect of wars and serious social unrest.
Let me be blunt: this next crash will be far worse and more dramatic than any that has come before. Literally, the world has never seen anything like the situation we collectively find ourselves in today. The so-called Great Depression happened for purely monetary reasons. Before, during and after the Great Depression, abundant resources, spare capacity and willing workers existed in sufficient quantities to get things moving along smartly again once the financial system had been reset.
This time there’s something different in the story line: the absence of abundant and high-net energy oil. Many of you might be thinking “Hey, the price of oil is low!” which is true, but only momentarily. Remember that price is not the same thing as net energy, which is what's left over after you expend energy to get a fossil fuel like oil out of the ground. As soon as the world economy tries to grow rapidly again, we’ll discover that oil will quickly go through two to possibly three complete doublings in price due to supply issues. And those oil price spikes will collide into that tower of outstanding debt, making the economic growth required to inflate them away a lot more expensive (both cost-wise and energetically) to come by.
With every passing moment, the world has slightly less high-net energy conventional oil and is replacing that with low-net energy oil. Consider how we're producing less barrels of production in the North Sea while coaxing more out of the tar sands. From a volume or a price standpoint right now, the casual observer would notice nothing. But it takes a lot more energy to get a barrel of oil from tar sands. So there's less net energy which can be used to grow the world economy after that substitution.
Purely from a price standpoint, our model at Peak Prosperity includes the idea that there’s a price of oil that’s too high for the economy to sustain (the ceiling) and a price that’s too low for the oil companies to remain financially solvent (the floor). That ceiling and that floor are drawing ever closer. When we reach the point at which there’s not enough of a gap between them to sustainably power the growth our economy currently is depending on, there’s nothing left but to adjust our economic hopes and dreams to more realistic -- and far lower -- levels.
When this happens most folks will undergo a "forced simplification" of their lifestyles (as well as their financial portfolios), which they will experience as disruptive and emotionally difficult. That's not fear-mongering; it's just math. (And it's the reason why we encourage developing a resilient lifestyle today, to insulate yourself from this disruption, as well as be able to enter the future with optimism.)
Too Much Debt
Our diagnosis of the fatal flaw facing the global economy and its financial systems has remained unchanged since before 2008. We can sum it up with these three simple words: Too much debt.
The chart below visualizes our predicament plainly. It has always been mathematically impossible (not to mention intellectually bankrupt) to expect to grow one's debt at twice the rate of one's income in perpetuity:

All but the most blinkered can rapidly work out the fallacy captured in the above chart. Sooner or later, borrowing at a faster rate than income growth was going to end because it has to. Again, it's just math. Math that our central planners seem blind to, by the way -- all of whom embrace "More debt!" as a solution, not a problem.
Despite being given the opportunity to re-think their strategy in the wake of the 2008 credit crisis, the world’s central banks instead did everything in their considerable power to create conditions for the most rapid period of credit accumulation in all of history:
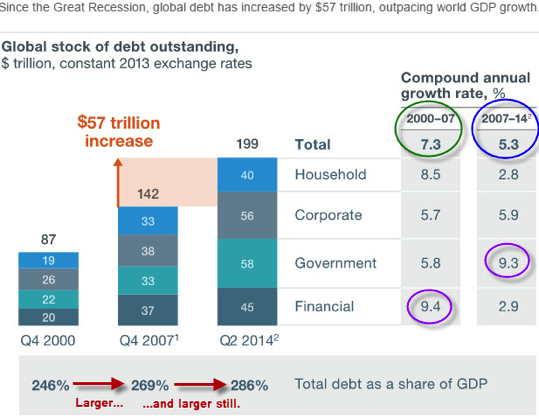
Lesson not learned!
The chart's global debt number is only larger now, somewhere well north of $200 trillion here in Q1 2016. But consider, if you will, that entire world had ‘only’ managed to accumulate $87 trillion in total debt by 2000 (this is just debt, mind you, it does not include the larger amount of unfunded liabilities). Yet governments then managed to pour on an additional $57 trillion just between the end of 2007 and the half way point of 2014, just seven and half short years later.
Was this a good idea? Or monumental stupidity? We’re about to find out.
My vote is on stupidity.
Banks In Trouble
In just the first few weeks of 2016, the prices of many bank stocks have suddenly dropped to deeply distressed territory. And the price of insurance against default on the bonds of those banks is now spiking.
While we don't know exactly what ails these banks -- and, if history is any guide, we probably won’t find out until after this next crisis is well underway -- but we can tell from the outside looking in that something is very wrong.
In today’s hyper-interconnected world of global banking, if one domino falls, it will topple any number of others. The points of connectivity are so numerous and tangled that literally no human is able to predict with certainty what will happen. Which is why the action now occurring in the banking sector is beginning to smell like 2008 all over again:
Gundlach Says 'Frightening' Seeing Financial Stocks Below Crisis
Feb 5, 2016
DoubleLine Capital’s Jeffrey Gundlach said it’s “frightening” to see major financial stocks trading at prices below their financial crisis levels.
He cited Deutsche Bank AG and Credit Suisse Group AG as examples in a talk outlining bearish views at a conference in Beverly Hills, California, on Friday. Both banks fell this week to their lowest levels since the early 1990s in European trading.
“We see the price of major financial stocks, particularly in Europe, which are truly frightening,” Gundlach said. “Do you know that Credit Suisse, which is a powerhouse bank, their stock price is lower than it was in the depths of the financial crisis in 2009? Do you know that Deutsche Bank is at a lower price today than it was in 2009 when we were talking about the potential implosion of the entire global banking system?”
This time it looks like the trouble is likely to begin in Europe, where we’ve been tracking the woes of Deutsche Bank (DB) for a while. But in Italy, banks are carrying 18% non-performing loans and an additional double digit percentage of ‘marginally performing' or impaired loans. Taken together, these loans represent more than 20% of Italy's GDP, which is hugely problematic.
The Italian banking sector may have upwards of 25% to 30% bad or impaired loans on the books. That means the entire banking sector is kaput. Finis. Insolvent and ready for the restructuring vultures to take over.
On average, in a fractional reserve banking system operating at a 10% reserve ratio, when a bank's bad loans approach its reserve ratio, it's pretty much toast. By 15% that's pretty much a certainty. By 20% you just need to figure out which resolution specialist to call. At 25% or 30%, you probably should pack a bag and skip town in the dead of night.
This handy chart provides some of the context for Europe more broadly. I’ve highlighted everything from Europe in yellow, showing how the banks there currently top the list of awfulness:

The extreme weakness in European financial shares, combined with other factors, is dragging down Europe’s stock market dramatically. The decline has now wiped out all of 2015’s market gains and has broken convincingly below the neckline (yellow line, below) of a typical “Head & Shoulders” formation:
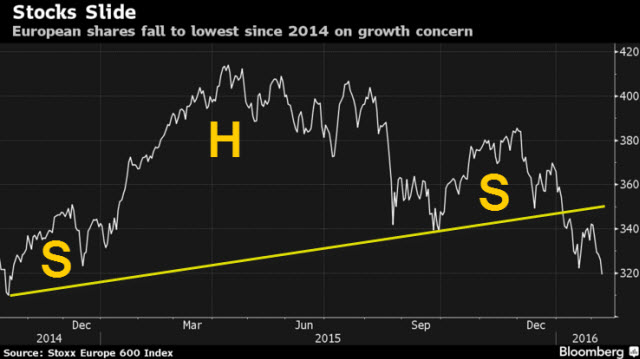
Since the beginning of the year, the stock prices of these select banks are down (as of COB Friday 2/5/16):
DB -28.3%
Credit Swiss -29.9%
MS -22.6%
C -22.0%
Barclays -21.7%
BAC -21.2%
UBS -20.3%
RBS -19.6%
Those are pretty hefty losses over a short period of time, and that’s meaningful. While the headline equity indexes are managing to keep their losses minimized, these bellwether stocks from the critical finance sector are stampeding out the back door.
And when I say ‘critical’, I mean in the sense that a hefty amount of the overall earnings within the S&P 500 and other major stock indexes were fraudulent profits were derived from the banks feeding on central bank thin-air money and front-running central bank policy.
What's there to worry about? Well, just pick something. It could be a combination of headwinds conspiring to drag down bank earnings from here. Take your pick: reduced trading and M&A revenue, and lower profits from ridiculously flat yield curves and negative interest rates.
However, we have to include the possibility that No more bailouts are coming. Why not? Mainly because it would be politically incendiary at this moment to even try such a thing. Public resentment of the banks is high all over the world, and in the US specifically, there’s an election primary that is hinging for the Democrats on Wall Street coziness. Maybe the markets are pricing that in?
Or it could be that these banks have been playing with fire (again) and got burned (again). We know for sure that a number hold a boatload of junk debt from the energy sector that will need to be written off. And we suspect many are staring at losses from writing too many derivative contracts that have turned against them.
But It Gets Worse; A Lot Worse
If only the greatest near-term risks were limited to the bad actions of the banks. But that's sadly not the case.
The collapse in the price of oil has been vicious, but it's likely not done. The oil patch has morphed into a capital-destruction zone for many drillers and as we have been warning all last year, the fallout is going to be worse than we can imagine. And it's just getting underway.
In Part 2: The Breakdown Has Begun, we lay out our prediction for the terrifying wave of defaults that will swamp the energy sector soon, as well as the many, many related industries that service it. Avoiding losses during this period will be the key priority. And precious metals will regain their role as a preferred save-haven asset class -- a victory long-suffering bullion holders should cheer.
We are now in the chaos management phase of this story. Take care to make smart choices now. Your future prosperity depends on it.
http://www.peakprosperity.com/blog/96701/return-crisis
"Confidence Is Lost": Fred Hickey Says "Bear Market Will Last Until QE4"
02/10/2016
Fred Hickey, editor of the widely read investment newsletter «The High-Tech Strategist», warns of more trouble to come for stocks and spots bright investment opportunities in the gold sector.
Around the globe financial markets are in turmoil. For Fred Hickey that doesn’t come as a surprise. The outspoken editor of the investment newsletter “The High-Tech Strategist” predicted towards the end of 2014 that the US stock market would fall when the Fed stops its stimulus program QE3. Since January, especially equities in the Nasdaq Composite index are getting clubbed. For the contrarian investor with a longtime experience in the IT industry this fits the classical behavior of a bear market. Mr. Hickey warns that stocks will fall further and recommends to buy gold and shares of gold miners.
Mr. Hickey, the bumpy ride on the stock markets continues. How dangerous is the situation?
We’re in a bear market. Technically, we’re not in a bear market yet, but bear markets are a process where it takes time to batter investor confidence and break it down. Bear markets start off as “healthy corrections” or just as sell-offs that turn into corrections. Only later do they reveal themselves. One could compare this process to a boxing prize fight. In the first round the eventual loser – which would be the US stock market investors – is dancing around the ring and is really excited after several rounds of gains. But as the US economy starts to break down and the stock market starts to fall off without QE and mutual fund outflows grow, the fighter starts taking a lot of body blows and weakens. We saw that process occur all of last year. Stocks fell for the first time in six years and we’ve seen many market segments get hit hard, whether it’s energy, materials or transportation stocks. So last year was the breaking down process and now, since the beginning of 2016, it’s been a rough time.
How will this boxing fight go on?
As the bear market process continues fewer and fewer stocks remain aloft. One by one they fall and investors crowd into a smaller and smaller number of favorites which look like they’re invincible. This classic herding behavior has happened as long as I have been watching markets. At the beginning of the bear market in 1973, for example, investors crowded into tech stocks like Polaroid, Kodak and IBM. The same thing happened with Microsoft, Intel and Compaq in the early bear market of 1990. The next time we saw the market break in 2000 investors crowded into Cisco Systems, Sun Microsystems and EMC. Similarly, as the market started breaking down in October 2007 we had Apple, Research in Motion, Amazon and Google. They were even called the “four horsemen” and were still holding up months later after the market had already started to weaken. But finally, the knockout blow comes and even those stocks aren’t immune. In fact, they fall harder and faster than the rest of the market because they’ve held up before.
Last year, we’ve seen that very same pattern with the so called FANG stocks Facebock, Amazon, Netflix and Google. Some of those shares are now under heavy pressure. Does that mean we’re already near the knockout round?
Some of those stocks like Amazon and Netflix more than doubled last year in an overall market that was down. What’s interesting now is that some of these FANG stocks like Amazon and Netflix are even leading the market down. Also, biotech stocks are getting killed. These equities were all ridiculously overpriced and now the confidence is being lost. It’s hard to know when exactly the knockout blow comes. But we’re certainly well into the bear market when such stocks start to break down like this.
How can you be sure about that? Maybe this is just another temporary setback like the one at the end of August.
There are always rallies in bear markets. For instance, back in 2008 I counted six rallies over 1000 points in the Dow Jones Industrial. They are typically very sharp. Most of them are short but some can last for a while. We had several rebounds that lasted one month. But I also do know that in the later stages of a bear market these rallies begin to last only a day or two. It gets very violent before the bottom. This bear market will continue which means we’re headed lower with rallies in between until the Federal Reserve is forced to come in and start QE4.
At which point will the Fed step in?
The problem for investors is it won’t happen very soon. In December, the Fed sold everyone that the economy is improving so that they could raise interest rates. But the economy wasn’t strong. In fact, industrial production was in a recession and the ISM manufacturing index dropped to 48, indicating a contraction. Almost every time that happened in the past it lead to a recession in the US. Also, prices for oil, iron ore, copper and basically all commodities collapsed last year and continue to drop this year. And you see the high yield market getting crushed. That only happens in recessions typically. In the past, all of that would have indicated that the Fed would have been cutting rates, not raising them.
So how long can the Fed afford to stay on the sidelines?
The question is how much damage and how much blood is going to be on Wall Street. The problem for the Fed is that it’s going to be difficult to reverse course right away because it just raised rates in December. Not only did the policy makers raise rates, they indicated that they were going to hike rates all over this year and four times more in 2017. So they have to save their face and they’re probably digging in their heels there which means investors are at risk for more losses.
Will markets rally once again when the Fed reopens the spigot?
Ultimately that’s what’s going to happen. But in my opinion the Fed is completely dangerous. It’s the most dangerous entity out there. The policy makers are the ones who are causing much of the problems we have today. We have inflated asset prices and that’s favorable on the upside. But when they come down the pain is twice as hard. And ultimately it affects confidence. It’s not sustainable when you have valuations too high. It creates all sorts of malinvestments in the economy and ultimately all of those become unwound.
That painful process seems to happen in the energy sector. Why are investors so nervous about the drop in oil prices?
In its typical optimism, Wall Street wants to blame all the problems on oil. Wall Street wants you to believe that if oil prices stabilize the stock market will stabilize, too. But oil is not the problem. It’s just a symptom of a severe disease. The real problem is too much debt and too many bad government policies. The oil price has collapsed because the Fed and other central banks around the world pushed interest rates down to zero. That encouraged new investments in energy production and in other commodity production whether it’s steel, copper or whatever. We’re overproducing everything now as a result of the zero percent interest rates.
How about malinvestments in your field of special expertise, the tech sector?
When you have easy money it encourages technology companies to invest in some of what they call the “growth areas”. Since there isn’t a lot of growth in PCs, smartphones, tablets and other areas they all crowded into the cloud business. I’ve been talking about that for some time. At one point around eighty companies were piling into the cloud space from every area of technology. We had all of the telecom companies like AT&T, Verizon and Centurylink piling in. We had IBM, Hewlett-Packard, Dell, Apple and all of those companies piling in. And then we had the social media companies and Google and Amazon. All those companies were building cloud capacity at the same time.
What are the consequences of that?
Everybody was building too much capacity. What we see now is that cloud demand isn’t growing fast enough and it hits the wall. It was the same thing with the fiber optic and hosting capacity build-up in 2000: You had people’s imagination running wild with easy money and it ended in an enormous amount of capacity. The same problem we have now with cloud capacity. So in the last few months of 2015 and since the start of this year we’ve seen a lot of companies drop out of the race. Hewlett-Packard dropped out and so did Dell. CenturyLink, Verizon and several others are trying to sell their cloud businesses. Also, Apple and Google slashed capex. And I believe Amazon has too much capacity, too. In fact, they had to do over fifty price cuts.
Is this going to be as bad as the burst of the dotcom bubble?
The early 2000s were pretty special. There was a total collapse. All the malinvestments, all the overvaluations were concentrated in the technology world. This time, the problems are much broader: We had too much fracking capacity build-up, too much steelmaking capacity, too much of everything around the world - including in the technology world where we had this bubble of capacity build-up in cloud computing.
In the commodity sector, the build-up of overcapacities is also related to the fast growing demand out of China. How important is China for the tech sector?
China is very important because it is either the largest or the second largest end market for most technology products. For PCs and smartphones, China is the number one consumer and for autos as well. Now China has a lot of problems. It lifted growth around the world coming out of the last recession and to do so, it piled on debt from $8 trillion to $30 trillion. Now, the only way out seems to be devaluation of its currency which will cause problems for other countries that compete with China. Also, many of the emerging markets are selling to China and they have accumulated an enormous amount of debt, too. Debt was the problem in 2007 and, around the world, all we have done is increase the debt. In the US, the government increased its debt from $8 trillion in 2007 to almost $19 trillion. This is what zero percent interest rates, negative interest rates and money printing do: They encourage even more bad behavior by governments. Instead of getting the correction that needed to occur, we’ve only made it worse.
So what does China’s slowdown mean for the tech sector?
It’s going to have an effect on the technology markets. That’s a problem. And then there are bad news from other parts of the world as well, like Latin America. Brazil is in recession. Also, Japan, despite all of the money printing attempts, is back in recession. Japan is one of the top economies in the world and we’ve seen that PC sales have absolutely collapsed there. Europe is muddling through but that’s only because they have the benefit of a lower Euro right now. The US is a little better but clearly weakening. All that doesn’t make for a good outlook for the technology world and there doesn’t seem to be anything that could turn it around.
What’s the impact on earnings? As of now, most big tech companies have reported their results for the fourth quarter.
I’m not surprised that there have been a lot of warnings from the Apple world. You have to understand, Apple is a giant with $235 bn. in revenue last year and the tentacles are wide. It’s mostly a hardware company and two times the size of Hewlett-Packard, the largest computer company in the world. So when Apple is in trouble, it’s a huge drag on all of the suppliers. I call them the “Apple Dumplings” and there are many of them.
In fact, Apple’s numbers were one of the big disappointments in this earnings season.
The bad news has only just begun. People wanted iPhones with a bigger screen and Apple was very slow to bring those out. But when they did, there was a great hunger in their customer base for the iPhone 6 and the iPhone 6 Plus. At the same time Apple was rolling out those phones, it brought in the last major carrier that hadn’t been carrying iPhones. That was China Mobile with 800 to 900 million subscribers. So that led to the mother of all upgrade cycles and Apple’s numbers were enormously inflated. Now, here we are a year later and Apple is going to have extremely difficult comparisons. The fourth quarter numbers were disappointing, but the first quarter numbers are going to fall apart.
And what about the long term outlook?
Apple hasn’t brought out a really new product in years. They had some failures: Apple TV hasn’t gone anywhere and Apple Pay has been very slow. The Apple Watch has been a huge disappointment. There is tremendous amount of competition and they have overpriced the product. They want to bring out an Apple car in 2019 but there is no chance of that happening. Maybe they can bring it out many years later at best. The company has become primarily a smart phone company and that even more so over the past few years. That’s a problem because the smartphone market has matured. Even in China, the market has grown only 1% last year. And when a market in technology products gets saturated, prices start to drop and margins contract. That’s a permanent slowdown which the analysts haven’t really accounted for yet. The smartphone market becomes essentially another PC market – and that’s not a good thing as we have witnessed over the last ten years or more.
What does that mean for Apple shares. The stock has already lost more than 20% in the past twelve months.
I think Apple will fall, but it has the support of its dividend. So its decline will be limited. It’s the suppliers that are going to get killed. Stocks like Skyworks Solutions, Cirrus Logic, Qorvo, Avago and NXP Semiconductors that doubled, tripled or quadrupled in the prior year leading up to the introduction of the iPhone 6. Those stocks have all broken down and they will continue to fall since I think that even when the iPhone 7 is introduced, it won’t be a leap in technology. There won’t be the kind of pent up demand like there was for the iPhone 6.
So where do you spot opportunities for investors?
We’re still in a money printing environment. I don’t believe the central banks are willing to let the free market forces correct. The correction will be so painful and it will prove that their Keynesian policies were wrong. As a result, we are going to get more money printing, debasing of currencies and even deeper negative interest rates – and that’s the best environment possible for gold. Also, because the gold price fell so hard in the last few years, we had no malinvestments in the gold mining sector in contrast to the energy space or in the cloud business. In fact, gold supply from mining is expected to fall this year. At the same time the demand in countries like China, Russia and India remains robust. That’s why I expect gold to rally this year and the secular bull market in gold to resume.
Even when stocks are in a bear market?
When the world’s stock markets come down, gold typically goes up. In the US for example, gold took off when the stock market broke in 2000. It went on a 13 year run whereas it was a lost decade for stocks. Same thing in the 1970s: There was a big bull market in gold and it was a very bad period for stocks. Just look at China today. The Shanghai Composite is down almost 50% since June of 2015 and the Chinese real estate market is collapsing. So what are investors going to do? Well, you go into gold in those circumstances. So if the central bankers keep debasing, we will see multi thousand dollar levels for the price of gold.
How are you positioned for this rally?
You have to be patient. But when gold lifts off the mining stocks will be even greater. Right now, gold mining stocks trade at multi decade lows relative to the price of gold. These are levels that even people who have been in the industry for a long time have never seen before. So the mining stocks would have to triple to just attain average levels relative to the price of gold. Therefore, what I have been doing this year and last year is to capture the downside of technology stocks through put options. I have been taking those gains and putting them into the mining stocks. I think that’s going to be the biggest payoff that I have ever seen.
Which are your top picks in the gold mining sector?
My favorite pick has remained the same for a while: Agnico Eagle Mines. They are managed so well and there are no concerns about them going under. Last year was a terrible year for the gold miners in general. Despite that, the stock of Agnico Eagle actually went up a little bit. Another nicely conditioned company is Detour Gold. And then there are the battered ones. Among them, I like New Gold, Goldcorp and Alamos Gold. But obviously, you can’t put all your money into mining stocks and into gold. Therefore, it makes sense to have a good amount of cash at this point to take advantage of the decline that occurs in the stock market. Because if the Federal Reserve launches QE4, that will likely lead to another upleg in stocks, and you want to be able to take advantage of that.
http://www.fuw.ch/article/were-certainly-well-into-a-bear-market/
"It's Worse Than 2008": CEO Of World's Largest Shipping Company Delivers Dire Assessment Of Global Economy
zerohedge.com
02/10/2016 12:10 -0500
Earlier today, it was highlighted the rather abysmal results reported by Maersk, the world’s largest shipping company.
To the extent the conglomerate is a bellwether for global growth and trade, things are looking pretty grim. Maersk Line - the company's golden goose and the world's largest container operator - racked up $182 million in red ink last quarter and the outlook for 2016 isn't pretty either. The company now sees demand for seaborne container transportation rising a meager 1-3% for the year.
“The demand for transportation of goods was significantly lower than expected, especially in the emerging markets as well as the Group’s key Europe trades, where the impact was further accelerated by de-stocking of the high inventory levels,” the company said, in its annual report.
Just how bad have things gotten amid the global deflationary supply glut you ask?
Worse than 2008 according to CEO Nils Andersen who last November warned that “the world’s economy is growing at a slower pace than the International Monetary Fund and other large forecasters are predicting.” Here’s what Andersen told FT:
“It is worse than in 2008. The oil price is as low as its lowest point in 2008-09 and has stayed there for a long time and doesn’t look like going up soon. Freight rates are lower. The external conditions are much worse but we are better prepared.”
As FT goes on to note, “capacity in the container shipping industry increased 8 per cent in 2015” despite the fact that Maersk only sees global trade growing at between 1% and 3% in 2016.
Imports to Brazil, Europe, Russia, and Africa are all falling, Andersen warned. The company's business, Andersen says, is suffering from a "massive deterioration." That, you can bet, will likely lead to a "massive deterioration" in Maersk's shares, which took a substantial hit on Wednesday in the wake of the quarterly and annual results.

Through it all, Andersen is attempting to strike an upbeat tone: "We are very strongly placed not only to get through this period but benefit from it. We are quite enthusiastic about it," he said.
Check back in six months to see how "enthusiastic" Andersen is once he realizes the slump in global growth and trade is no longer cyclical but has in fact become structural and endemic.
|
Followers
|
0
|
Posters
|
|
|
Posts (Today)
|
0
|
Posts (Total)
|
158
|
|
Created
|
10/25/15
|
Type
|
Free
|
| Moderators | |||
| Volume | |
| Day Range: | |
| Bid Price | |
| Ask Price | |
| Last Trade Time: |


