 News
News  Market Data
  Discover
Support: 888-992-3836
Copyright © 2023 InvestorsHub Inc.


Register for free to join our community of investors and share your ideas. You will also get access to streaming quotes, interactive charts, trades, portfolio, live options flow and more tools.
DEF.V Defiance Silver Corp (TSXV:DEF)
Near term Silver ***Producer*** Mexico
Defiance Silver Corp. (DEF:TSX.V) is a near term silver producer engaged in the acquisition, exploration and development of advanced projects in Mexico.
Defiance has two significant projects in the Zacatecas silver district in Central Mexico. The 200tpd Santa Gabriela processing plant is in the process of being refurbished.
The newly acquired San Acacio mine has an NI 43-101 Indicated resource of over 18 M oz of Ag.
With these two projects working in conjunction, Defiance is set up to be a silver producer in the near term, as well as becoming one of the districts dominant silver producer.
Share Statistics - As of Dec 31, 2012
Avg Vol (3 month)3: 6,770
Avg Vol (10 day)3: 9,900
Shares Outstanding5: 21.80M
Float: 12.67M
Escrow Shares: 1,170,000
Net Shares: 20,627,749
Inside ownership 22%
Market cap: 6m (@.29)
Board - http://investorshub.advfn.com/Defiance-Silver-Corp-TSXV-DEF-22659/
Disclosure - I own shares in this company
Happy New Year!
Kiwi
.
Very nice!...sounds like you grabbed yourself a little slice of heaven...Fun, sun, sand, and surf. That's the life!!! I'm glad for you :)
Hi Susan,
Yes I did finally get back to Cartagena Col., SA. Was able to go windsurfing for about 2 months last winter. It was great.
Well hello stranger:)
How've you been?
Nice charts...Thanks for tossing them up.
Say, did you get yourself back to SA yet?
Hi jakes_dad,
That's had quite a nice run of late, hasn't it? Thanks for the chart.
FYI...
EWI is offering a freebie week...
http://www.elliottwave.com/freeweek/ffs-nov-2009/default.aspx?code=36890
US Dollar Index
....The DX hit the lower trendline today at just below DX75, but the STU has been watching for a throw-under and sharp reversal at DX74.50. The great thing about the pattern the DX is in, the ending diagonal, is it is clearly a terminal pattern and will be followed by a reversal up. The only question is when. The throw-under and reversal would be a classic indicator of when, but is hasn't happened, and need not to end the pattern. The closing wedge shape is clear, albeit could run for a while before still.
Gold has formed a triangle, the penultimate pattern, indicating another (and final) thrust up is about to occur in gold. Probably the spike down in the Dollar and run-up in gold occur around the same time. So watch gold first to give advance warning of the Dollar Bottom......
http://yelnick.typepad.com/yelnick/2009/10/we-may-have-just-topped.html
This Past Week In Gold
Jack Chan
www.simplyprofits.org
November 8, 2008
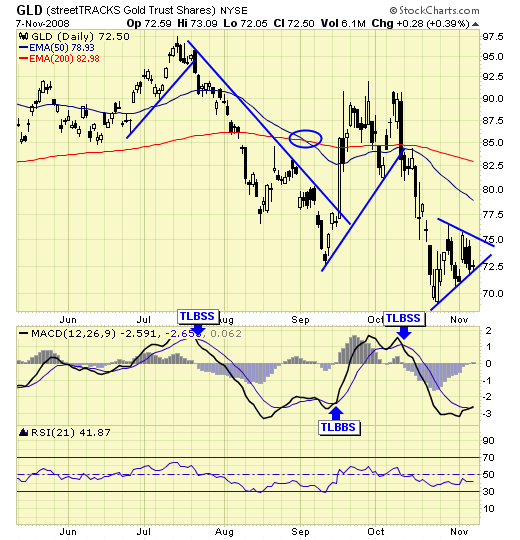
GLD - on sell signal.
A triangle consolidation is in progress.
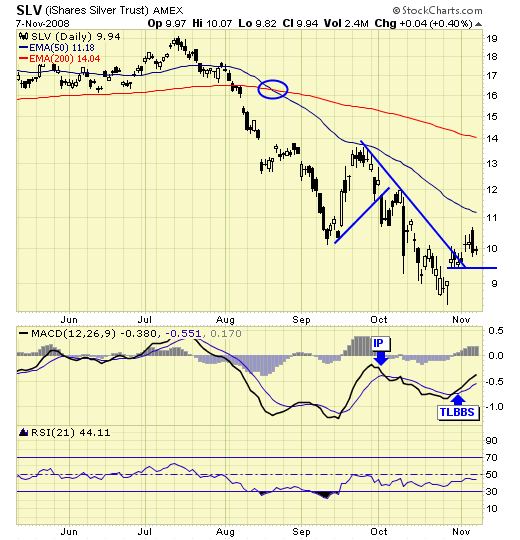
SLV - on buy signal.
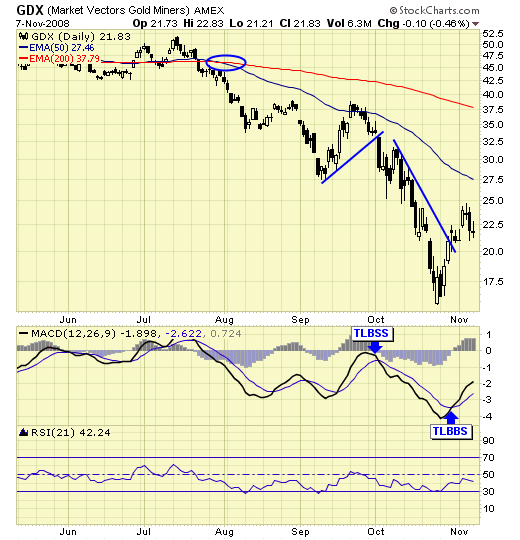
GDX - on buy signal.
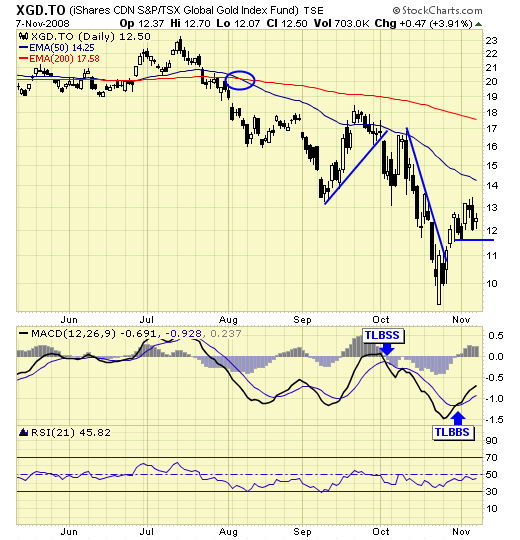
XGD.TO - on buy signal.
Summary
Only GLD remains on a sell signal, and with the triangle consolidation, we could see one final spike to a new low. A lower low on the metals with higher lows in gold stocks would be a positive divergence and we can become aggressive buyers in the sector.
********
Disclosure
We do not offer predictions or forecasts for the markets. What you see here is our simple trading model which provides us the signals and set ups to be either long, short, or in cash at any given time. Entry points and stops are provided in real time to subscribers, therefore, this update may not reflect our current positions in the markets. Trade at your own discretion.
A few Kondratieff Cycle links:
http://kondratyev.com/reference/theory_explained.htm
http://www.kondratieffwinter.com/kw_wave.html
http://faculty.washington.edu/krumme/207/development/longwaves.html
http://faculty.washington.edu/modelski/IPEKWAVE.html
http://www.comstockfunds.org/screenprint.cfm?newsletterid=1388
http://www.thelongwaveanalyst.ca/cycle.html
http://www.datacomm.ch/dbesomi/Links/links-16.html
http://www.safehaven.com/searcharticles.cfm
http://www.whiskeyandgunpowder.com/Archives/2005/20050713.html
Kondratiev wave
http://en.wikipedia.org/wiki/Kondratiev_wave

Witches are hexy
Maund On Gold & Silver
Clive Maund
August 9, 2008
Gold Market Update
A week of dramatic developments ended with the dollar surging to 6-month highs and silver crashing an important support level and plunging. Gold, however, did not break below its important $850 support level, although as we shall see this certainly does not mean it won't soon.
On its 1-year chart we can see that there has been no real panic selloff yet in gold, whose decline thus far from its July peak has been modest and measured compared to that of gold and silver stocks, but if the $850 support level gives way we can expect it to plunge into a selling climax that should terminate the decline. How far would it likely drop? - probably to the $800 - $825 area where there is continuing support arising from the triangular trading range of November and December last year, and also arising from the proximity of the 300-day moving average near which gold has found support on its bigger reactions throughout its bull market. How likely is it to break the $850 support? - very likely for 3 reasons: one is that the dollar has broken out above an important resistance level and appears to be headed higher short-term despite already being extremely overbought, another is that silver has just crashed a strong support level and gone into a near-vertical descent, and finally Precious Metals stocks are heading precipitously lower towards targets at 280 on the HUI index and 125 on the XAU index.
On the 1-year chart for the dollar index we can see how it spiked dramatically late last week. Technically, the reason for this was that it had succeeded in breaking clear above its 200-day moving average and in overcoming the lower resistance level shown towards and around 75. There are several important points to note regarding this development. One is that the size of this move implies follow through to the upside towards the next resistance level shown on the chart, which would probably precipitate a breakdown by gold as described above, but at the same time the entire steep advance including the sharp gain late last week is and will be regarded as a final "blowoff" move that should mark the end of the uptrend that began in mid-July. This is hardly surprising as the dollar is already way out on a limb here, extremely overbought and climbing up through up steeply falling long-term moving averages, hardly conditions that usually result in a sustainable rally.
On the Precious Metals stock index charts we have witnessed breakdowns from Head-and-Shoulders tops leading to precipitous declines. On the HUI index chart shown here we can see that the downside target for the H&S pattern is the strong support shown in the 275 area. Right now the index is extremely oversold on all short-term oscillators, and it is therefore rather difficult to picture it dropping as far as that. However, a breakdown by gold below $850 could easily trigger such a further drop, and the almost insanely oversold condition that would then exist would provide a MAJOR OPPORTUNITY to load up with the better gold and silver stocks, as this should be the bottom. In trying to buy stock on an intraday plunge below 300 on the HUI index, we would be trying to catch the low, which is worth attempting as the reversal hammer that is likely to end this selloff can be expected to involve a big daily range, but remember there is no law saying that the index has to drop this low before it turns up - we could be at the low right now. If we are, we are likely to see a reversal hammer on Monday.
Silver Market Update
The silver support level in the $16.00 - $16.50 area finally buckled on Friday in the face of the dollar spike leading to a rapid plunge that has taken the price below its 300-day moving average. We can see this development on the 1-year chart, and how it has opened up the risk of a continued decline to the next support level in the $14 area. Although the dollar is already entering extremely overbought territory that is expected to lead to a reversal soon, there is room for it to continue to advance short-term, which would likely lead to gold following suit and crashing its support, and silver dropping back to the $14 area. That said we should keep in mind that it is already deeply oversold and near its 300-day moving average, and could reverse to the upside at any time, in sync with a dollar reversal to the downside.
If silver drops to the $14 area as expected over the short-term it will be viewed as a strong buy as this should mark the end of the downtrend. This would be expected to coincide with Precious Metals stocks bottoming out as signified by the HUI index dropping to the 280 area and the XAU index dropping to the 125 area.
Clive Maund, Diploma Technical Analysis
support@clivemaund.com
www.clivemaund.com
Copiapo, Chile, 9 August 2008
No responsibility can be accepted for losses that may result as a consequence of trading on the basis of this analysis.

"Life is not measured by the number of breaths we take,
but by the moments that take our breath away."
Oil Market Update
Clive Maund
support@clivemaund.com
August 10, 2008
We have had the heavy correction in oil predicted in the last Oil Market update which was posted in mid-July, with the pendulum rapidly swinging from extremely overbought to extremely oversold. On the 3-year chart for Light Crude, the correction looks quite normal. Before it set in oil was wildly overbought with a huge gap having opened up between its 50 and 200-day moving averages, this gap being a key factor leading us to conclude that a major correction was imminent. The MACD indicator had also been riding at extreme levels for weeks, which was another important factor calling for a reversal. Now this indicator has plunged to its lowest level for years as speculators have rushed for the exits, a level that equals the most extreme reading attained during the uptrend, showing that selling has been way overdone - and although the price could retreat a little further short-term, we are now probably very close to a reversal. On the chart we can see that the price is now approaching the strong support at the lower boundary of the uptrend channel in force from early 2007 and also support in the vicinity of its 200-day moving average. These important supporting factors coupled with the deeply oversold condition should lead to a reversal to the upside soon.

On the 6-month chart for Light Crude we can see that while the price pattern has certainly not signalled that the downtrend is over yet, there are factors in play suggesting that it does not have much further to run, and should end soon, if not immediately. There are 2 things in particular that are worthy of note. One is that the downtrend appears to be taking the form of a bullish Falling Wedge. It is too early to be sure at this point, but if the tentative lower channel line drawn on the chart is correct it is showing a gradual diminution of selling pressure over time, which would seem to be the case, for as we can see the MACD histogram is creeping back towards the zero line, despite the continuing losses. It is thus reasonable to conclude, given that oil stocks, which appear to have bottomed, tend to do so ahead of oil itself, that although oil may drop a little more more it is close to bottoming and is likely to do so in the $110 area.

Despite the fact that they have been and are making mountains of money, oil stocks have dropped substantially over the past several months. This is because the market is always discounting future (foreseeable) developments 6 to 9 months down the road, and, unsettled by the heavy declines in the broad stockmarket earlier in the year, investors have been looking ahead to somewhat lower profits resulting from recession and lower oil prices. The fact remains however that oil companies have been making gargantuan windfall profits out of the recent boom in oil prices, and have built up massive "war chests", which will scarely be dented by backhanders to their pals in the Republican Party. Bearing this in mind, it should be clear that with oil having now corrected back heavily as oil stocks had anticipated, the stage is set for a new uptrend to develop. On the 3-year chart we can see how the OIX index has dropped back across its broad long-term uptrend channel to its lower boundary where it is logical and reasonable to expect it to find support and turn up again. That it is finding support towards this uptrend line is evident from the fact that the rate of decline is now slowing. The overbought extreme attained in May has been followed by an even more oversold extreme just a couple of weeks ago, as shown by the MACD indicator at the bottom of the chart.

There are many interesting features to observe on the 6-month chart for the OIX oil index. After a minor reaction late in February and the first part of March, a strong "bull hammer" marked the reversal that led to the following powerful uptrend, which terminated with a fine example of a bearish "shooting star" candlestick in May. The index then formed an intermediate top above its 50-day moving average before breaking down below a clear line of support (now resistance) at the 920 level leading to the recent plunge. It became critically oversold by late last month, as shown by the extremely low MACD reading, leading to a slowing in the rate of decline. Now it appears to be marking out an intermediate base area with downside momentum clearly having slowed considerably. A bullish Falling Wedge pattern is now evident on the chart, although it is too early to be sure of this, but if this is what it is we can expect a strong reversal to the upside soon, and recent candlestick action is decidedly bullish, with several long lower shadows demonstrating the underlying demand snapping at oil stocks when they dip - doubtless only too happy to buy from the clowns who are bailing out, probably with heavy losses. On Friday a bullish hammer candlestick appeared on the chart, the low of which may be very close to the bottom for this cycle.

Oil stocks are believed to have bottomed, or to be very close to bottoming, and to be presaging an imminent intermediate low in oil, likely in the $110 area.
On Friday on www.clivemaund.com we liquidated our Proshares Ultrashort Oil & Gas ETF units (code DUG), having bought them a week before oil topped out.
Clive Maund
support@clivemaund.com
August 09, 2008
Clive Maund is an English technical analyst, holding a diploma from the Society of Technical Analysts, Cambridge and lives in The Lake District, Chile.
Visit his subscription website at clivemaund.com .[You can subscribe here].
Clivemaund.com is dedicated to serious investors and traders in the precious metals and energy sectors. I offer my no nonsense, premium analysis to subscribers. Our project is 100% subscriber supported. We take no advertising or incentives from the companies we cover. If you are serious about making some real profits, this site is for you! Happy trading.
No responsibility can be accepted for losses that may result as a consequence of trading on the basis of this analysis.
Copyright © 2003-2008 CliveMaund. All Rights Reserved.
VVUS 7.49
AEI.TO .88 (Cdn)
k, I'll give you more notice
Just doing a driveby here folks...continue to enjoy your summer:)
...and still ticking :)
You're welcome Susan. The chart on that one has been impressive!
Thanks for posting that BoomTime...interesting!
Capstone Microturbine - 2 minute commercial
JML.V .88 (Cdn)
"Life is not measured
by the number of breaths we take,
but by the moments
that take our breath away."
VGN.V .59 (Cdn)
"Life is not measured
by the number of breaths we take,
but by the moments
that take our breath away."
VST.V 1.30 (Cdn)
A T special
http://investorshub.advfn.com/boards/board.aspx?board_id=12685
DXE.V .44 (Cdn)
"Life is not measured
by the number of breaths we take,
but by the moments
that take our breath away."
Sorry Fred...missed it...will have to catch the next one. Thanks for the reminder though :)
"Life is not measured
by the number of breaths we take,
but by the moments
that take our breath away."
Does GST rhyme with wee...maybe?
I was thinking you may have this post somewhere  !
!
US OPEN starts Tomorrow.. get a team, Good prizes this year
http://investorshub.advfn.com/boards/board.aspx?board_id=2442
Up Next the US Open
Rules:
1. You pick 5 players for the tournament. Your 5 picks can only include ONE of the following 5 players: Woods, Mickelson, Els, G. Ogilvy , A. Scott
2. A tiebreaker score must be submitted. The tiebreaker is your guess for the winners TOTAL number of strokes for the 4 rounds.
3. Teams must be submitted prior to the first group teeing off on Thursday June 12th.
4. The winner will be the team with the highest total dollar winnings at the end of the tournament.
5. Points will be deducted for spelling mistakes.
6. All of ddf's decisions are final.
7. No gimmees or mulligans allowed.
8. Void where prohibited.
This board has been set up for the chart tracking of all stocks and anyone is welcome to post.


| Volume | |
| Day Range: | |
| Bid Price | |
| Ask Price | |
| Last Trade Time: |


