 News
News  Market Data
  Discover
Support: 888-992-3836
Copyright © 2023 InvestorsHub Inc.


Register for free to join our community of investors and share your ideas. You will also get access to streaming quotes, interactive charts, trades, portfolio, live options flow and more tools.
News; $X Why United States Steel Stock Just Popped 8%
Shares of U.S. Steel (NYSE: X) look red-hot this afternoon, up 7.9% in 1:45 p.m. EDT trading on the back of positive news about the health of the U.S. steel industry. What news, specifically? According to the latest weekly update out of the American Iron and Steel Institute, r...
Got this from X - Why United States Steel Stock Just Popped 8%
News: $X 3 "Struggling" Steel Stocks to Avoid in the Second Half
United States Steel (X), ArcelorMittal, and Cleveland Cliffs (CLF) are dealing with a tough environment as demand is week and steel is in oversupply. These stocks will underperform for the rest of 2020. At one time, steel stocks were the ultimate boom-and-bust industry. During periods of ...
In case you are interested X - 3 "Struggling" Steel Stocks to Avoid in the Second Half
$X bears and bulls United States Steel Corporation Nyse X Short Squeeze
News: $X Big River Steel Attracts $700M Investment from U. S. Steel
OSCEOLA, Ark. , Oct. 1, 2019 /PRNewswire/ -- Big River Steel announced today it has entered into an agreement with United States Steel Corporation (X) ("U. S. Steel") in which Big River will receive $700 million in cash in return for a minority ownership interest in its scra...
In case you are interested X - Big River Steel Attracts $700M Investment from U. S. Steel
News: $X United States Steel Corporation to Acquire 49.9% Interest in Big River Steel Creating Partnership With Clear Path to Consolidation
Accelerates U. S. Steel’s strategy of adding market leading, differentiated and technologically advanced assets to create a world competitive “best of both” footprint Ultimately expands U. S. Steel’s capability and geographic presence to serve current and fu...
In case you are interested X - United States Steel Corporation to Acquire 49.9% Interest in Big River Steel Creating Partnership With Clear Path to Consolidation
northam,
I have no idea what will happen. It would bother me a little if QT shut down very soon, but that's only because I spent hours and hours setting up a ton of sector portfolios, each containing at least a dozen stocks, and then writing color-bar formulas and setting alerts for the 3/8/20 system I'm developing. If QT shuts down in the midst of next winter I probably wont care because by then I will have everything I want to do transported over to Excel where I can do more sophisticated things (and Excel is going to be around forever -- at least my personal forever).
I think I started with QT about four years ago, mainly because I wanted to get more involved with intra-day data and be able to set alerts. Don't really remember the date. It's easy to get intra-day charts free from any brokerage, but I wanted something that I could run offline and where I could add lots of bells and whistles because I was convinced that the only way to improve my Swap system during sideways or volatile markets was to get involved in intra-day charting. After spending a lot of time with that and checking out a lot of other things I decided that intra-day data is pretty much worthless because it is so fast that it can do things for you but it can just as easily do things to you, and I don't mean that in the positive sense -- if you are going to be in a train wreck, it's better to be in a slow train wreck than in a fast train wreck. It's easier to survive a slow train wreck. The bottom line is that after trying everything I could think of, nothing intra-day helped the Swap system; but I did find some inter-day things that helped a lot.
So I'll repeat myself: it's not the intra-day activity that's so important unless you are a day trader; instead, it's the inter-day trading that is important, and that is reflected in daily candlestick patterns. In fact, I've been thinking for a while that perhaps there should be such a thing as a 2-day candle, and that there would be one for every day. This would mean that candles account for two days and also overlap. This is not an entirely new concept -- the calculation of Average True Range (ATR), for instance, is a 2-day calculation. Notice the word 'True' in the name of the indicator. It's an attempt to account for 'overnight' psychology and account for gaps.
Why do I bring all this up? Because my opinion (which has changed over the last few years) is that long-term traders don't need intra-day charts, and because there are lots of off-line end-of-day charting programs that are either available for free, or cost very little to purchase.
JLS - Yes, but they will probably want a subscription fee to get the data feed. I am getting it free right now through TDA because I maintain an account with them. So if QT starts charging a fee, I will have to decide which way to go. So I need to get into Think or Swim to see if I can get the same type charts and data that I am getting now. If TOS can offer that then that maybe the better way to go.
I appreciate you letting me know what's going on with QT.
northam,
I'm not sure you will have to do that.
Harrison wrote that they are modifying the QT site, not eliminating it. The inference is that QT is not going to be killed. Maybe it will be sold to, and supported by, someone else.
Maybe they just can't say anything about that right now.
JLS - Thanks for the info. I guess I'm going to have get into TOS.
northam,
Email from QuoteTracker:
QT hasn't been drawn down yet and it is still owned by TDA. We are working on getting those TDA banner ads down from the site, so they should be going away as soon as that's completed (as well as a few other changes to the site).
QT is in the beginning of the draw-down process. Too early to have very much info available. QT was programmed in Delphi for Windows 95 and is rapidly reaching an unmaintainable state, so we are trying to integrate as many features as we can in to ThinkOrSwim from TD Ameritrade before that happens. When the drawdown is complete, QT will no longer be supported or maintained. In the meantime, we recommend trying out ThinkOrSwim. If you need any assistance with it or a walkthrough, just let us know and we'll see if we can get someone at TD Ameritrade to give you a call.
I responded with another question. I'll let you know what they say. I'm trying to figure out if someone else is going to support QT or if they are just going to indirectly disable it so that nobody can continue using it.
JLS - Thanks for the info. I will play with it.
northam,
I’m just suggesting you look at the chart below and set it up in QT and watch it for a while on a daily basis. You may even want to play with the parameters. This is one of QT’s choices of Regression Channels (RC). Yes, RCs are not all set up the same. The parameters this one uses is in the parenthesis. It uses 0% Change, 1 tick, and a Width of 2. The Width does not impart any additional information, it just makes the thing more visible -- try a width of 0, and you will only get the center line. Going above a width of 4 does nothing. You could see what happens when you use more ticks, or you could set ticks to zero and use percentage width, or you can use both. I have not looked at this from day to day so I don’t know how many candles it takes to change direction -- I selected 1 tick because I think that makes it adjust the fastest. I suggest you try this setup then change the ticks to 2 and compare those two settings over time. I think you will be surprised. With these settings, I think the latest RC top was put in on 7/26 and the down slope started on 7/27 -- but that process needs to be verified. FWIW, my Swap system went to SDS on the small red candle of 7/26.
My point is that you could use these lines (channels) to either confirm your system, or trade these things alone (while maybe using something else for confirmation). For instance, one scenario could be that you would go long SSO only on a positive slope, you could stay long on a flat slope (or maybe not), but you would definitely sell SSO on a down slope and go long SDS at that time, and repeat the rules for holding and selling SDS. In other words, it’s a sort of swap system. I’m pretty sure that process will work very well; and since this process uses straight lines (which are determined by a least-squared best fit of closing prices) there is no argument about the direction of the slope (as there can be with curved lines). The trade process I explained would have definitely put you in SDS near the end of July and you would still be there having made a very good gain.
But the process only works if you take small losses when they occur so that you have the cash to move on and catch a better trade. Sort of like surfing: if you don’t catch a good wave, dump it and wait for a better one. For instance, this system would have you go long SSO in the middle of July and get back out on 07/27 for what would likely be a small loss. But just imagine the gain you would have had in SDS since then -- and that would pay for probably a few years of small losses.
A reminder, change the ticks to 2 and see what you would get and compare that with what your system obtained since your first entry. Use parameters (0,2,2). You will get more flexibility if you set ticks to zero and set % Change to a non-zero value. That will give you the ability to use fractional values. If I were to develop this system further, I would look at using ATR to determine the value of % Change. That would allow adapting this system to account for volatility. Another thing to look at would be to go to cash between positions instead of directly going to the new position directly from the last one. This would allow using a higher % Change value to get into a position and a smaller % Change to get out. That combination would tend to keep you out of horizontal markets where you have to get out with small gains or losses; and when you are in a trade, it gets you out a little quicker.

northam,
I think I know what the problem is, and it's with my relationship with TDA. I opened a bare minimum account there so that I can have access to all their software. But I don't use them for trading because I hate navigating their behemoth menu system and using their poor documentation. I prefer ETrade for trading because the executions are speedy (always less than 2 seconds), have perfect pricing, and the commissions are lower.
I think that the problem is that I not only had to open a minimum account but that I also have to maintain that minimum amount. When I set up the account, the rules seemed to say that I needed a minimum amount to open the account but nothing was said indicating that I had to maintain that level beyond a minimal grace period. So I'll test that idea by electronically transferring a few hundred bucks over to TDA and see what happens overnight after they balance their books.
JLS - If they do that to me, I will probably have to use TOS. I hate to make changes when I have something that is working well. I suppose I need to start getting into TOS incase they do cut me off.
northam,
Thanks for getting back.
Something must be goofed up with my QT then. It's acting like I'm not registered even though the setup says I am. So I get ads all the time, I get only 2 days of intra-day with no backfill, and I only get 6 months of historical.
I haven't used if for probably a few months. The last time I used it was while helping QT solve a bug, and while in the process they asked me to re-install the program. Everything was still screwed up after the re-install, but we finally traced the problem to TDA. Everything worked fine after TDA fixed the bug on their end, then that was the last time I used it.
I sent a bug report to QT this afternoon, so I guess I'll have to wait and see what happens. When I go to their site and click on some things related to TDA, nothing happens or the computer takes me to a blank page. Also, while working on the bug a few months ago, the QT person told me that they were going to quit supporting the program.
I have used Think or Swim (TOS). I don't like it all that much, but my needs are a lot different than most folks. I live way out in the boonies, so I'm on satellite. TOS is an online program. I hate those kinds of programs because it means I can't run it offline. Because of the distance to the satellite there is a 250-ms round-trip delay for every request which makes loading the program rather slow, and which also puts me out of business when the satellite is hijacked by Dish Networks when they decide to play with the internet loop in the late evening, which they seem to like to do at the most inconvenient time for night owls like me. The satellite is also subject to weather related blackouts. They don't happen very often, but when they do I wont be able to use TOS. TOS also does way more than I would ever use, so that tends to complicate using it because of all the things that clutter the program up.
JLS - I get 20 days of intra-day data, yes mine is registered with TDA and I am ad free. Haven't been getting any messages.
Have you tried the Think or Swim program that TDA has. I have been thinking about taking a look at it to see if I can get the same kind of charts I'm getting with TDA.
northam,
It's been a while since I've used Quotetracker. Is yours registered with TD Ameritrade, and how many days of intra-day data are you getting?
Apparently, having an account at TDA doesn't matter anymore. I'm getting messages on QT that says I need to register with QT to see more data and get rid of the ads.
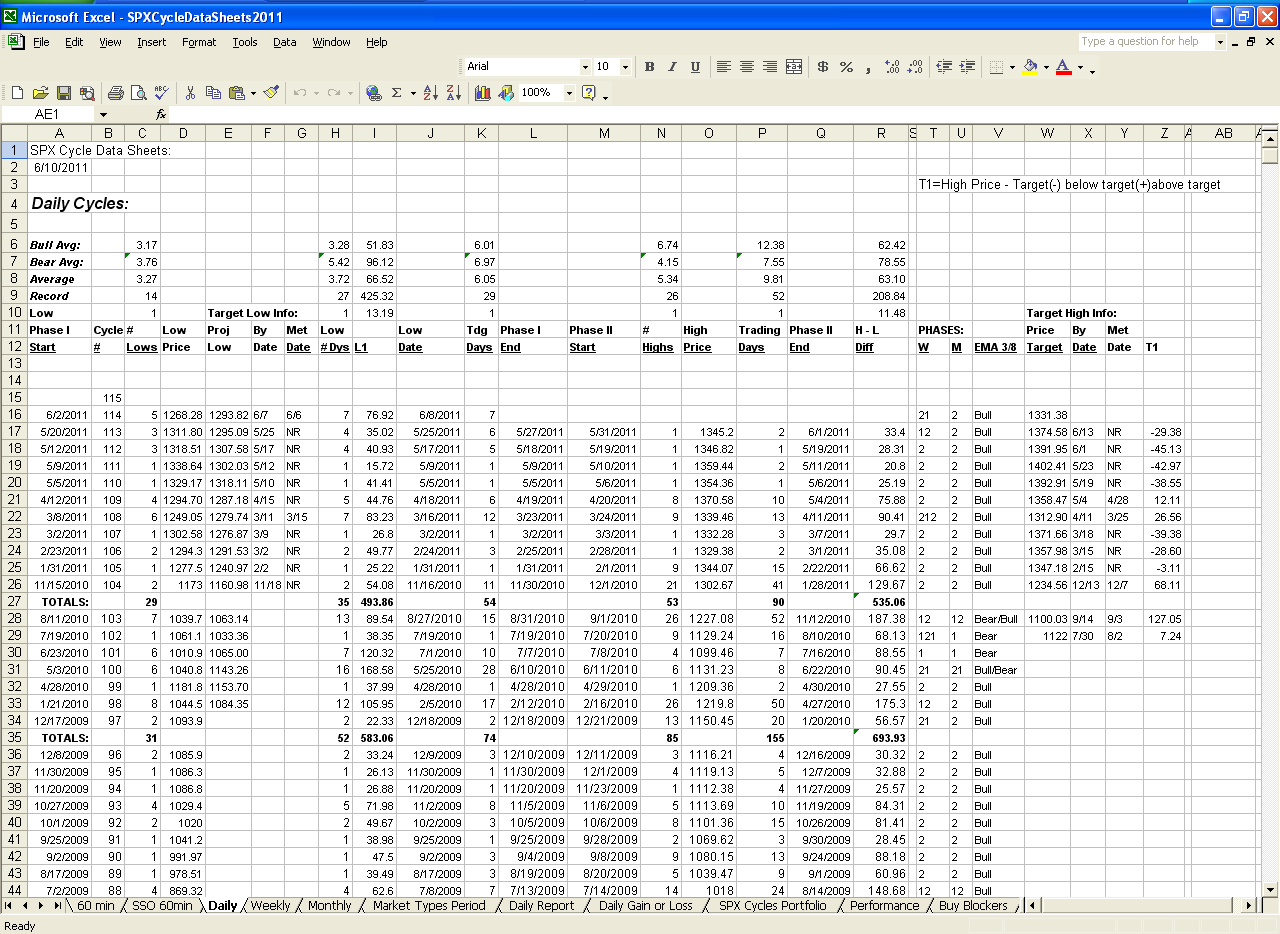
SPX Cycles Daily Data Sheet as of August 4th, 2011:

Gleno34 - We could be going into a Bear market, but the Monthly EMA 3/8 has not crossed and it is a long way until the end of the month.
So there is no Bear market signal as per my system at this time.
However, since the EMA 3/8 gap is less than 10 points I have issued a EMA 3/8 Buy Blocker which suspends all buying on the long side until the gap exceeds the 10 point zone.
If a Bear market is confirmed at the end of the month, I will then establish a short position using SPXU. A Bear Market average is 7.3 months.
It would be abnormal to go into a Bear Market before a Monthly Phase 1 is confirmed and the Monthly price has crossed above the Monthly UTL for this month, so this is a Phase 2 Month. So that leads me to believe that this maybe just a weekly correction we are going into which would take us to a possible low of 1228.39 over the next 4 weeks and then we go to a high of 1410.59 which would be the next Weekly Phase 2 based on the 1228.39 low.
If we go above 1335 before Friday that would negate the Weekly Phase 1 and the current Weekly Phase 2 would continue which has a projected high of 1400.40
So the bottom line: I believe right now we are either going to a low of 1228.39 in a Weekly correction or a high of 1400.40 in the current Weekly Phase 2. So the Weekly is driving the train right now.
north..Maybe you missed my post on FOOT's board this morning?? I asked if this is a Bear Market Signal?? Just asking...I do not know your system..
http://stockcharts.com/h-sc/ui?s=$SPX&p=M&yr=10&mn=4&dy=0&id=p65579146390&a=236653821
SPX Daily Phase 1 (BEAR) Confirmed (07/27/11):
Today the SPX Daily Phase 1(BEAR) was confirmed. The average Daily Phase 1 lasts 5.97 Trading Days. The average Bull market Phase 1 lasts 5.90 trading days. The target for this Phase 1 is 1281.31 by August 1st.
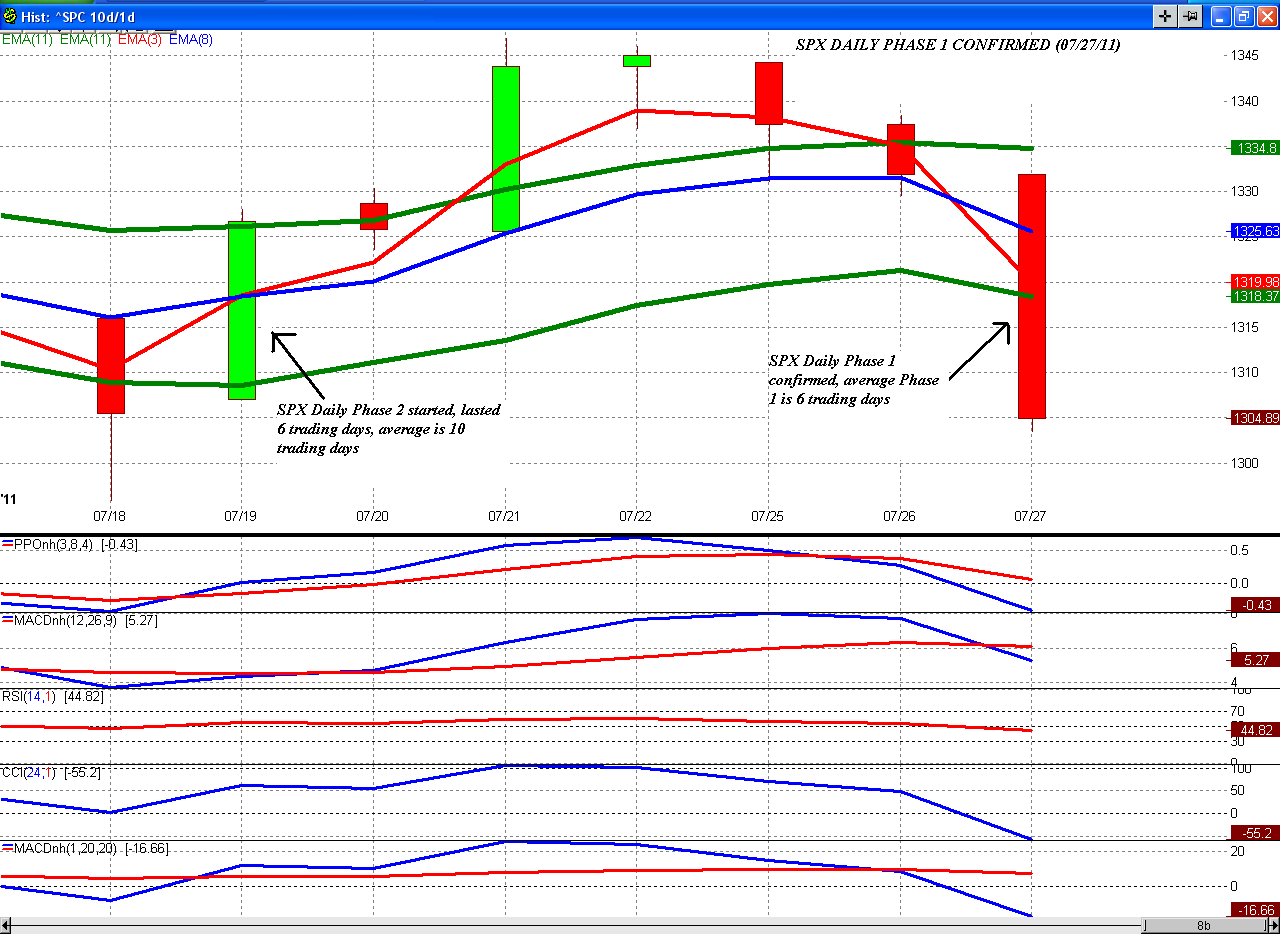
SPX Daily Phase 2 (BULL) Confirmed (07/19/11):
Today the SPX Daily Phase 2(BULL) was confirmed. The average Daily Phase 2 lasts 9.56 Trading Days. The average Bull market Phase 2 lasts 11.95 trading days. The target for this Phase 2 is 1358.55 by August 1st.


SPX Daily Phase 1 (BEAR) Confirmed (07/14/11):
Today the SPX Daily Phase 1(BEAR) was confirmed. The average Daily Phase 1 lasts 5.97 Trading Days. The average Bull market Phase 1 lasts 5.93 trading days. The target for this Phase 1 is 1266.27 by July 19th.

SPX Daily Phase 2 (BULL) Confirmed (07/12/11):
Today the SPX Daily Phase 2(BULL) was confirmed. The average Daily Phase 2 lasts 9.65 Trading Days. The average Bull market Phase 2 lasts 12.08 trading days. The target for this Phase 2 is 1375.96 by July 26th.

SPX Daily Phase 1 (Bear) Confirmed (07/12/11):
Today the SPX Daily Phase 1(BEAR) was confirmed. The average Daily Phase 1 lasts 6.03 Trading Days. The average Bull market Phase 1 lasts 5.99 trading days. The target for this Phase 1 is 1304.82 by July 15th.

SPX Cycles Daily Data Sheet:

SPX Daily Phase 2 (BULL) Confirmed (06/28/11):
Today the SPX Daily Phase 2(BULL) was confirmed. The average Daily Phase 2 lasts 9.66 Trading Days. The average Bull market Phase 2 lasts 12.12 trading days. The target for this Phase 2 is 1324.64 by July 12th.

SPX Daily Phase 1 (BEAR) Confirmed (06/23/11):
The SPX Daily Phase 1(BEAR) was confirmed June 23rd. The average Daily Phase 1 lasts 6.08 Trading Days. The average Bull market Phase 1 lasts 6.05 trading days. The target for this Phase 1 is 1246.85 by June 28th.

Torqputty - No, the last time the Daily Phase 2 lasted over 9.73 trading days was the cycle that ended May 4th. It lasted 10 trading days and that was the last cycle the target was reached. The last 4 cycles have been 2,1,2,1 hope we break that cycle this time.
re; The last 4 cycle Phase 2 targets have not been reached.
Hi northam
I see that the Phase 2 targets have not been reached...
but i'm curious regarding the average duration of trading days
did we at least get the average 9.73 trading days or more...?
(CHART)SPX Daily Phase 2 (BULL) Confirmed (06/21/11):
Today the SPX Daily Phase 2(BULL) is confirmed. The average Daily Phase 2 lasts 9.73 Trading Days. The average Bull market Phase 2 lasts 12.24 trading days. The target for this Phase 2 is 1320.92 by July 5th. The last 4 cycle Phase 2 targets have not been reached.

SPX Daily Phase 2 (BULL) Confirmed (06/21/11)
The SPX Daily Phase 1 is now above the LTL and the price is currently above the Daily EMA 8. So the Daily is now cleared to go to the UTL.
The SPX Daily is at the LTL. The SPX 60 min is in Phase 2, if the 60 min Phase 2 goes above average, it could push the Daily well above the LTL. Wouldn't it be nice. Sounds like the makings of a song.
Here's the good news:
If you look at the Daily cycle data sheet you will see that when the Daily Phase 1 lasts 10 or more trading days. The Phase 2 can last a long time.
Torqputty
Well the biggest news is the Daily is in an above avg Phase I as you can see by the chart. The Weekly is in the early stages of (week 2) a Phase I with a target of 1241. At the moment the market is trending down and long entries are not working real well.
SPX Daily Chart
Based on an oversold daily stoch and a high put/call options - I think there is a strong likelihood that we've hit the low for this downside slide. – just my opinion
Whats Up at SPX Daily Cycles...?
Kinda quiet on this board -
The SPX Cycles Consolidated Daily Reports are located at the Trading SPX Cycles Board, a link to that site is located below.
The consolidated reports consist of all the reports from all SPX Cycle Boards in one location.
http://investorshub.advfn.com/boards/read_msg.aspx?message_id=64132492
SPX Cycles Daily Data Sheet:
SPX Daily Phase 1 target low hit today.
SPX Daily Phase 1 (BEAR) Confirmed (06/02/11):
Today the SPX Daily Phase 1(BEAR) is confirmed. The average Daily Phase 1 lasts 6.00 Trading Days. The average Bull market Phase 1 lasts 5.94 trading days. The target for this Phase 1 is 1293.82 by June 7th. The last 5 targets have not been reached.

bbgold - Thank you for your interest in my SPX Cycles System.
P.S. if you bookmark me, you will get all my SPX Cycles Boards posts.
Thanks, much appreciated
Yes, to me the last Market leg was Bearish so the reason I was anticipating you would have sold on the Daily closing above the upper trendline, or at least closed one of the positions.
I have to admit I didn't have your Weekly board bookmarked to cross reference.
Yes, it is definitely a good system that can be tailored to different time frames and Markets.
Good Trading!
bbgold - "Have you looked into using different chart timing for different trades?" Depending on the market that the SPX is in (BULL or BEAR) will determine how trades are made. Currently all buys are established using the SPX 60 min RSI(6) 30 level in both a Bull or Bear market. The selling points will be different in a Bull market verse a Bear market. During a Bull market the main Sell Signal is the Weekly UTL, During a Bear market the Sell Signal is the Daily UTL, because in a Bear market you obviously would not want to hang on to long positions for very long.
"Say once you enter into a Long using a Daily chart that you use the Daily chart for the Sell? Or do you always use the Daily for the Long but only the Weekly for the Sell?" As I said above the SPX 60 min RSI(6) 30 level is used for the BUY SIGNAL. Depending on the trader, you could use the SPX 60 min RSI(7) 70 level as a Sell Signal for very short term sells, the Daily UTL for short term sells, the Weekly UTL for medium to longer term sells, or the Monthly UTL for long term sells.
"I can see the advantage you have in using the weekly for the Sell but if the initial trade is triggered on the Daily then why not use the Daily to trigger a sell also?" I don't use the Daily to trigger a Buy. Normally the SPX 60 min RSI(6) 30 level will give good entry points. Also, I do not recommend "ALL IN" type trading, I recommend establishing positions at different price levels, because no one knows where the bottoms or tops are, my systems objective is to get the middle area.
"I know you want to be longer term to capture the trend but what disadvantages do you see to taking the short term profits?" None, the advantage to my system is it can be tailored to the short term to long term trader. You just pick the chart you want to use for the Sell Signal. I believe, the short term trader would do very well with my system.
Here is how my cycles have performed over time:

Thanks
Yes, I was not sure which time frame chart you were using for the sells. I had thought it was the Daily chart and last I had read I believed you had mentioned fully positioned Long and waiting for the Sell signal. I guess I was just behind in keeping up with the posts, sorry.
Have you looked into using different chart timing for different trades? Say once you enter into a Long using a Daily chart that you use the Daily chart for the Sell? Or do you always use the Daily for the Long but only the Weekly for the Sell?
I can see the advantage you have in using the weekly for the Sell but if the initial trade is triggered on the Daily then why not use the Daily to trigger a sell also?
I know you want to be longer term to capture the trend but what disadvantages do you see to taking the short term profits?
SPX Cycles Daily Data Sheet:

bbgold - This is the Daily chart. I use the Weekly chart to trigger a system Sell Signal. The Weekly price has not closed above the Weekly UTL since the new Phase 2 has been confirmed.
http://investorshub.advfn.com/boards/read_msg.aspx?message_id=63724003
The only time the Daily chart is used for a Sell Signal is when my system is 100% invested, then when the price closes below the Daily UTL, I am allowed to sell one profitable position. The reasoning behind this, is when the SPX is in a Weekly Phase 2(Up trend phase), the Daily will continue to cycle through a Phase 1(down trend) and back to a Phase 2 (uptrend) maybe 2 or 3 times during a Weekly cycle. By selling a position at the beginning of a possible Daily Phase 1, I can lock in some profits and then hopefully buy back at a low cycle price.
Hope this helps. If not, keep asking questions.
5/31 a Close above trendline?
On this chart doesn't it show the close above the upper trendline which would have triggered your Sell?
I am still working on your trade triggers but I do believe that is what you had mentioned before?
I am not sure why you changed to say it could not happen before Friday?
Sorry if I am writing this on the wrong board but this chart is what I am referring to.
Thanks for any insights.
SPX Cycles Daily Data Sheet:

|
Followers
|
23
|
Posters
|
|
|
Posts (Today)
|
0
|
Posts (Total)
|
1590
|
|
Created
|
05/28/10
|
Type
|
Free
|
| Moderators | |||
The focus of this board will be on my SPX cycles system using Daily, Weekly & Monthly charts. This cycle system is not intended to identify the tops and bottoms. The intent is to identify the middle area.
SPX cycles will be broken down into two phases. Phase I(Bear) is the down trend phase and Phase II(Bull) is the up trend phase.
A Phase I(Bear) starts when the SPX price opens and remains below the upper trend line(UTL). For a Daily Phase I(Bear) to be confirmed, the SPX price opens and remains below the UTL price the entire trading day. The confirmation for a Weekly & Monthly Phase I(Bear) is the same process as the Daily, except the Weekly price must remain below the UTL the entire Week and the Monthly must remain below the UTL the entire Month.
A Phase II(Bull) is confirmed immediately when the SPX price hits the UTL.
A new chart will be posted each time a new Phase is confirmed.
I will provide current averages for each Phase and each time frame. Averages are the primary data I use in buying and selling. When in a Bull Market Phase I's are normally shorter than Phase II's and in a Bear Market Phase II's sometimes are shorter than Phase I's. So in a Bull Market Phase I, I would buy long below the average and sell in Phase II above the average. In a Bear Market, I would buy long in Phase I above the average and in Phase II would sell below the average.
I will provide projections based on historical data that I continually collect and analyze.
The objective of SPX Cycles, is to identify short term (Daily), medium term (Weekly) and long term (Monthly) direction of the market.
Phase I - Starts at the beginning of a down trend and ends at the confirmed up trend. The confirmed up trend is when the price touches or crosses the upper trend line.
Phase II - Starts when a confirmed up trend is identified and ends when a confirmed down trend has started. The confirmed down trend is when the price opens below the upper trend line and remains below the upper trend line the entire trading day for a Daily Phase I. the entire week for a Weekly Phase I and the entire month for a Monthly Phase I.
During a Bull market, Phase II cycles will normally last longer than Phase I cycles.
During a Bear market, Phase I cycles sometimes last longer than Phase II cycles.
Bull market - For this board, a bull market is confirmed when the SPX Monthly EMA 3/8 has made a bullish crossing, and it is confirmed at close of the market on the last trading day of the month.
Bear market - Is the same as the Bull market except the SPX Monthly EMA 3/8 has made a bearish crossing that is confirmed at close of the market on the last trading day of the month.
Other indicators that this board will use: PPO (3,8,4), MACD (12,26,9), RSI(14), CCI(24). These are secondary indicators and are mainly used to try and detect a change of trend in the early stages. The PPO is usually the first warning sign followed by the MACD, RSI and CCI.
The upper and lower trend lines on all charts are the EMA 11 (high) and EMA 11 (low)


| Volume | |
| Day Range: | |
| Bid Price | |
| Ask Price | |
| Last Trade Time: |


