 News
News  Market Data
  Discover
Support: 888-992-3836
Copyright © 2023 InvestorsHub Inc.


Register for free to join our community of investors and share your ideas. You will also get access to streaming quotes, interactive charts, trades, portfolio, live options flow and more tools.
Stocks Slide as Fed Leaves Investors Unsure About Path Ahead
Stocks seesawed on Wednesday, but eventually ended the day lower, after Jerome H. Powell, the Federal Reserve chair, dashed investors’ hopes that an end to the central bank’s rate increases may soon be over.
The S&P 500 slumped to a loss of 2.5 percent for the day, after fluctuating between gains and losses as Mr. Powell spoke during an afternoon news conference about the Fed’s latest decision.
Stocks had started the day lower as investors braced for the Fed to raise interest rates a further 0.75 percentage points. The central bank followed through on that expectation, but attention quickly shifted to what the Fed was thinking about interest rate increases to come.
The S&P 500 rallied soon after the statement was released, climbing into positive territory. It’s “very premature” to be talking about pausing rate increases, he said. Investors quickly responded, and the S&P 500 fell sharply. Trading in government bonds was similarly upended, with yields rising in the late afternoon after falling earlier in the day. The two-year Treasury yield, which is sensitive to changes in Fed policy, ended 0.06 percentage points higher at 4.59 percent.
The S&P 500 rose roughly 8 percent in October, partly on better-than-expected corporate earnings but also as some investors began to bet that a pivot in the Fed’s messaging was coming.
[url][/url][tag]https://www.nytimes.com/2022/11/02/business/stock-market-fed.html [/tag]
The S&P 500 (^GSPC) gained 2.5%. The Dow Jones Industrial Average (^DJI) bounced more than 800 points, or 2.6%, to a two-month high, as it also notched a fourth-straight week of gains and its best week of the year. The tech-heavy Nasdaq Composite (^IXI) rose 2.9%. The moves came even as Treasury yields climbed back above 4%.
#STOCKS #StockMarket #biotech #LABU #StockMarketCrash20 #STOCKSTOBUY #stockmarkets #STOCKCRASH Unfortunately ?? The STOCKS will Crash, the Markets will get Totally Blood Red ,SELL THIS IS UR FINAL WARNING OR LOSE ALL UR $$$$ ?? MONEY!!! Only 1 ETF u will make $$ is on #LABD and TTNP ==$$$ BIG MONEY ?? COMMING HERE TO THESE 2 STOCKS =$$$$$
?? ALERT "WARNING ?? The Market will Crash Down to Absolutely nothing and All will lose there Hard Earn Money!! I work in Wall Street 30 Years we all know!! Sell out In the morning! Buy $LABD it will go from $5.40 to $25.00 to $30.00 =$$$$$$$$
Unlimited QE from the Fed, and now they can but ETFs too. Sheesh they're just pulling everything they can out of this hat
G
Hope you are well and so is your family - you are not posting.
Take care. This too shall pass.
G
Your monthly prediction at 1900-2000 is here but it may not stop there
If it dies it is just 1 maybe - still 2-5 waves to come.
Hi Gratitude,
I like your way of thinking, any new thoughts in pipeline?
Thx and keep well.
G
This is a 3 peaks and domed house failure down to a lower low.
That’s why we cannot count via ewave?
Any comments.
Hi N :)
All my indicators, 3 min and hourly turned positive so i believe that it either gaps up from here in a wave 3, or it goes down to 3320 and goes up from there in a wave 3. That's why i believe a black wave 3 is coming. As for target, who knows? 100-150 points from here? The entire red wave 5 should be done by the end of March.
However, you might be also right, and it might go in a zig-zag down - none of these options would invalidate the Elliott waves theory.....
Thx,
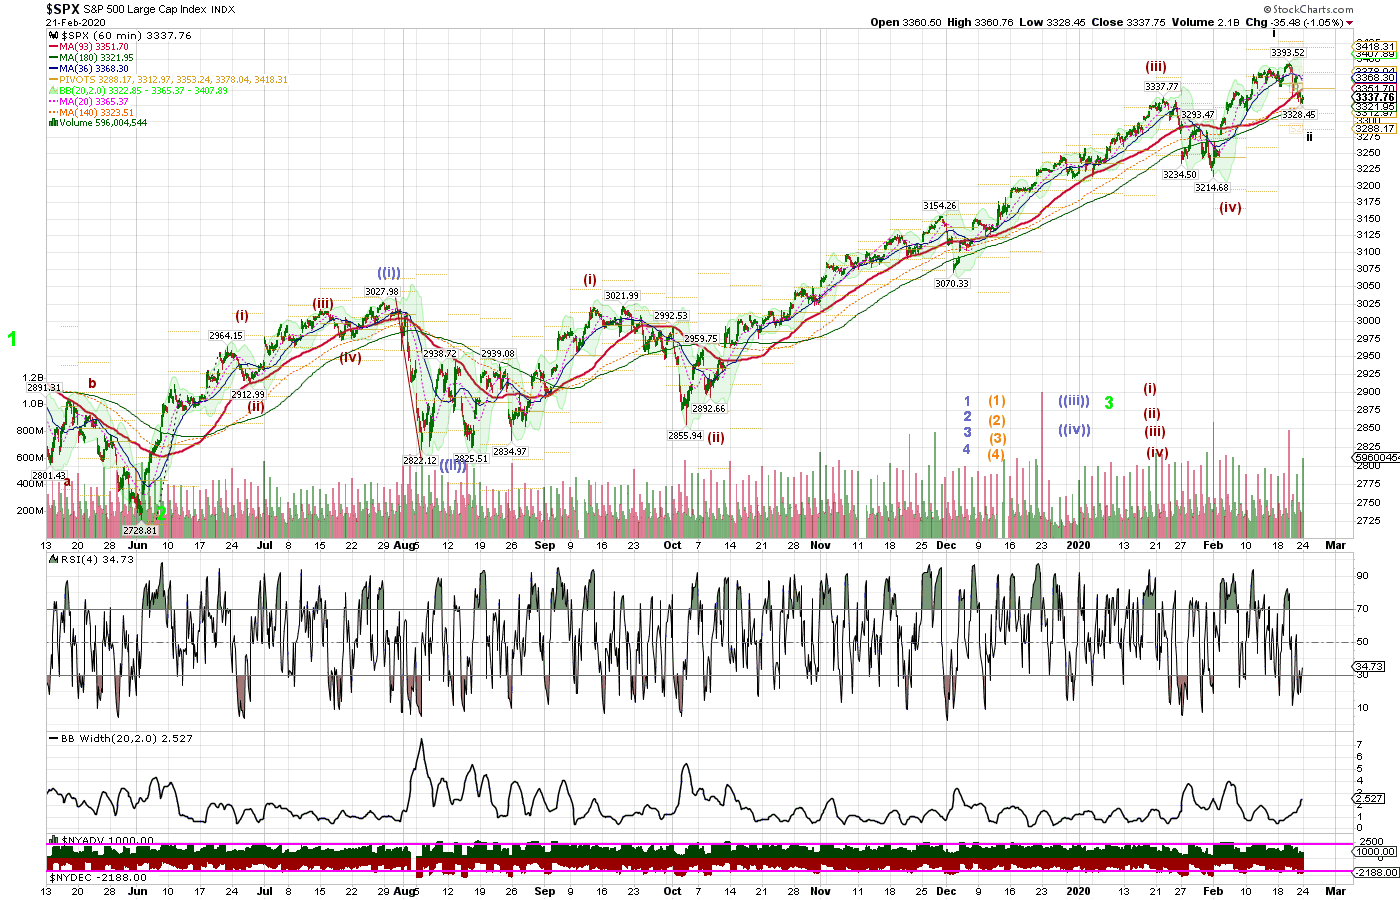
I'm still battling if (V) is reached at 3993 and ((III)) completed
and if so that maybe a ZigZag ((IV)) started (3460 ... 3250 range).
Why is it more likely to continue the uprun and what would be a likely Target and Timing for completing ((III))?
Thx for your export opinion.
Current Elliott Waves - The spx drop in January of about 123 points I feel that it was not big enough to be blue wave 4, so I reverted to the old count, and i will consider the January drop as red wave 4, one degree lower than the blue one. In February, spx started red wave 5 up, and so far it did black subwaves 1 and 2. I expected black subwave 2 to go a little bit lower today, to 3320, but 3328 is good enough.
Went to cash 100 percent two days ago - had very few shares like 10 out today - sell signal as of two days ago.
$sp500 sp500 Scientist who simulated the global impact of a coronavirus outbreak says ‘ the cat’s already out of the bag’ and calls China’s efforts to contain the disease ‘unlikely to be effective’ https://on.mktw.net/2TTCus4
G
Can you also clarify is it green V that will finish in few months?
Thanks.
G
You indicate that the run should be 2 months - when is your approximate top date to finish 5? Now is that right.
Thanks in advance.
G
Looks like we got smaller degree wave and the double bottom patten did not materialize.
Looks like Spx is going 600 points at a time and correction bottom out every two months - since we bottomed Jan 28, next good size bottom would be March 28?
The correction would come from a minimum of 3450 or 3600 max.
That should be a 200 point minimum or 250-300 point maximum correction.
Any thoughts on this.
Current Elliott Waves - spx made a new high this week, so the probability of having a complex wave 4 down decreased substantially. It is possible that spx started wave 5 up which could take few months. Next week should clarify the count.
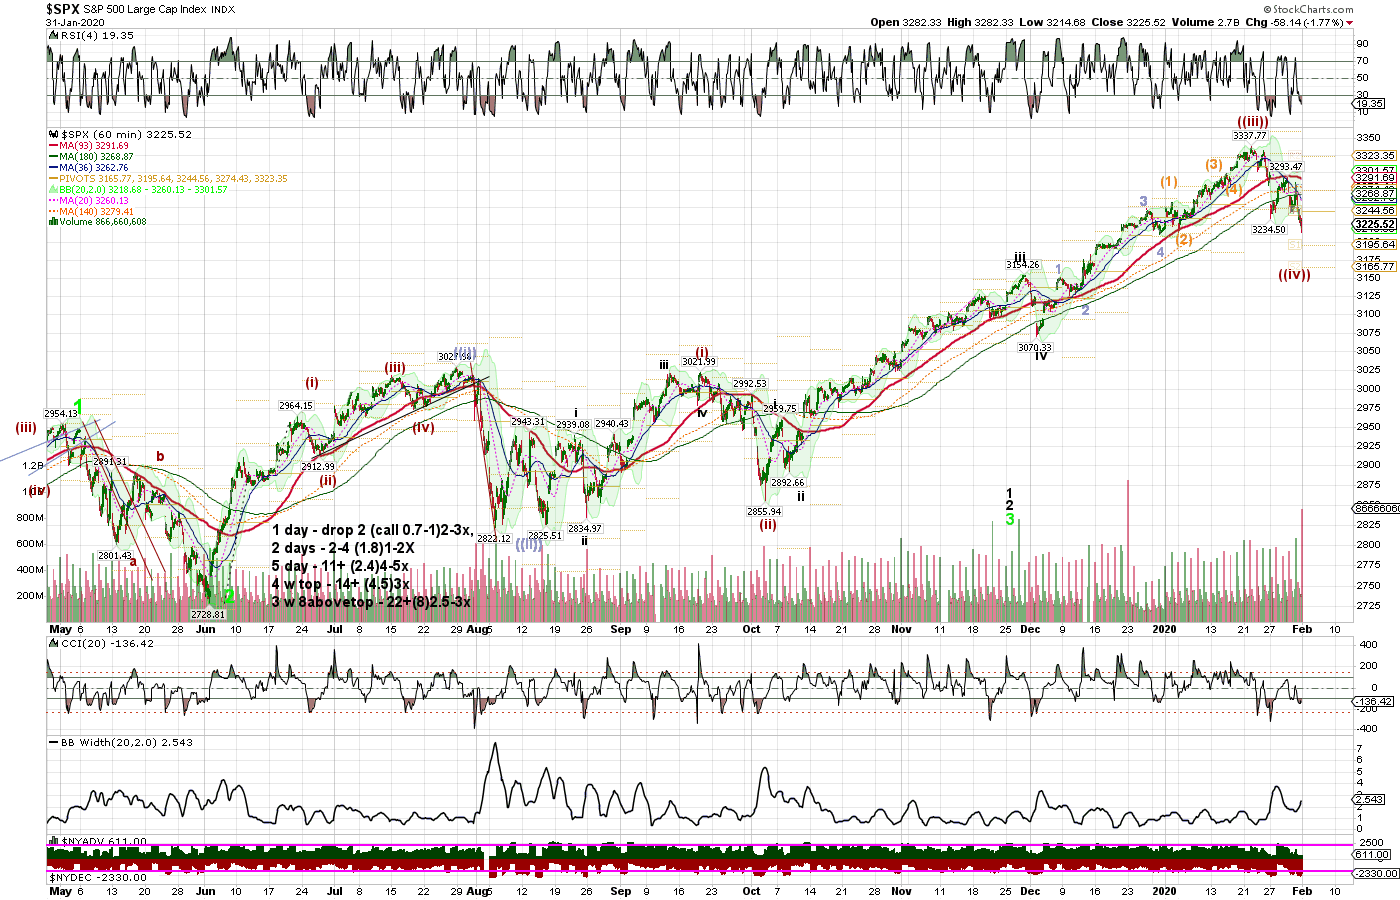
Current Elliott Waves - spx is taking a long time to do the correction, so I revisited the count to align it with the latest developments. It seems that spx completed green wave 3 in January at 3338. From there, it started green wave 4 down, which I expect to be a flat (3-3-5). So far, spx did legs A, B and started leg C down.
As I said last week, my daily indicators pointed to down, while the hourly ones kept pointing up. That's rare, and it resolved by changing the expected ABC zig-zag to a ABC flat.
The flat will be invalidated if spx makes a new high before it does the leg C down.

we might get a flat rather than the expected ABC - chart tomorrow
G
Looks like the bottom was in - based on higher high.
Any comments -
Thanks.
G
I fully agree with your predicament - it is crazy how things are done and manipulated - but just have to see the charts - which alos lie sometimes or say half truth.
I am playing with fire here as we are at the top of the yearly Chanel - but a few or so shares will not hurt me as I have Apple and NFLX that’s all.
I am thinking we go up substantially to 3442 area - but one day at a time.
The bottom is in and top is not till March 3-10.
could go either way - it is just ridiculous how they prop up the market for political reasons
G
What do you think? We came very close -
Regards.
It is possible the correction is over; however i still feel that another leg down should happen soon. Going well above 3338 which is the current top would probably indicate the correction is over. If we do get a leg down, i expect a drop of about 140 points.
G
Is is possible that the correction is over and I more wave c down
How do we prove or disprove it.
Thanks.
G
Thanks for the update on the C down - I am assuming your proprietary indicators are saying still 3170 or more down to come?
What is the Spx level break for that.
Thanks,
Market is doing this ABC down in a hurry, so see below an update:
Spx finished leg A at 3214 and is doing now leg B up, which might be done. From here, if my count is right, it should head down to about 3170 area to finish leg C down by the end of next week, which will also be the end of the wave 4 down.
G
Looks like from the study of prior data on your 60 minutes - as long as we are below 36 and 36 is below 93 and 180 it is like 5 below 14 and 5 below 30 - so correction goes on.
All te bounces are limited to 5 and 14 - these 5,14,30 are converted to daily charts but easy to see on a 60 much faster than daily.
Regards and thanks for your diligent effort to read the markets and sharing - very few people share the knowledge.
I am grateful to you for the same.
Current Elliott Waves - From 2855.94, spx completed red wave 3 last week at 3338. From there, it started red wave 4 down, which I expect to be an ABC down. So far, spx is working on leg A down, and so far it did subwaves 1,2 and 3 (in progress or complete - Monday will tell the story). Leg A I expect to be finished by the end of the week.
It is interesting that my daily indicators (proprietary, not on chart) point to down, while the hourly ones keep pointing up. That's rare, and usually, when I get contradicting indicators means that the trend is down but the move is choppy (unlike the August one) with bursts of up moves in order for the hourly indicators to reset, which could frustrate traders because would take their stops out.
If there was a way to figure out whether this is second wave up and then 3,4,5 to go, ppl would all be billionaires :)
My feeling is that the market correction just started, and I am playing it accordingly (I scalled into puts today, also i will buy more tomorrow if it goes up, and i also got some calls for protection).
G
Good update - many thanks for the same.
Is there a way to figure out whether this is second wave up and then 3,4,5 to go? Or
The market correction is done?
It is always confused me to which we way we should play.
Your expert opinion will be greatly appreciated. Thanks.
So, spx went down and now up to test suport which became resistance. The down wave was wave 1 and now doing wave 2 up. When wave 2 is done i expect spx to do waves 3,4 and 5 of leg A down. In plain words, if my count is right, the drop we got yesterday is just the beginning.....
Current Elliott Waves - From 2855.94, it started red wave 3, and so far it finished black waves i, ii, iii, iv and v. This count might be invalidated if spx goes above 3338.
At this point, it finished red wave 3 and it should correct at least 100-150 points as red wave 4, probably in the shape of an ABC down. I won't be surprised to see spx going a little bit down and a little bit up to test support, and then it should head down if my count is correct.

yeah, it is running out of steam, so sooner or later will roll over and drop at least 100-150 points. As for tops, there will be many along the way with the last one mid 2021 before it rolls over in a big correction (similar with 2008).
G
Have we finished your red 3 wave and on the onset of 100-150 point drop to red 4?
Looks like so -
Also, do you see a market top in March 2020 and a secondary top October 2020 ?
Thanks in advance for your expert opinion .
Regards.
Current Elliott Waves - From 2855.94, it started red wave 3, and so far it finished black waves i, ii, iii and iv, and now it is doing black wave v. In my opinion, spx finished already blue subwaves 1, 2, 3 and 4 and it is doing now blue subwave 5. Out of blue subwave 5, it finished orange subwaves 1, 2, 3 and 4 so far, in my opinion.
Last week, spx did orange subwave 5, and it was a week long because it was an extended one (who knew?). So far, it is equal to orange subwave 3, so it can head down anytime. And of course, if it wants, it can go even higher, without invalidating Elliott waves theory.
However, the important part is that when orange subwave 5 is done, it will also complete the red wave 3, and then it should correct at least 100-150 points as red wave 4, probably in the shape of an ABC down.

G
3294 reached - so your call of 100 points is on now looks like - what do you think.
You gave 1-2 days for v to finish.
Regrads and good call.
G
Thanks a lot for your diligent effort to show us the path.
Your count looks great - thinking that this last wave to finish red 3 ends at 3294 or 3300 max this week.
First subwave was 80 so thinking the same for subwave 5.
Regards.
Current Elliott Waves - From 2855.94, it started red wave 3, and so far it finished black waves i, ii, iii and iv, and now it is doing black wave v. In my opinion, spx finished already blue subwaves 1, 2, 3 and 4 and it is doing now blue subwave 5. Out of blue subwave 5, it finished orange subwaves 1, 2, 3 and 4 so far, in my opinion.
So, probably by now you are confused with so many waves and subwaves, and you are wondering what it means and what's next. Well, look at the chart below - if my count is right, all spx has to do is one more small run up to finish orange subwave 5 (unless some ugly weekend news take it down directly), which will also complete the red wave 3, and then it should correct at least 100 points. I expect spx to finish orange subwave 5 in a day or so. From there, I expect a sizeable drop (at least 100 points on spx) as red wave 4, probably in the shape of an ABC down.

SPX is doing now subwave 3 of blue subwave 5; sometimes it cuts subwave 5 short, so it is in my opinion a good time to scale into some long term puts (31jan and beyond) in preparation for the >100points drop.
G
congrats - good call on Wave 5 - Kudos.
Regrads.
Monthly Elliott waves Chart showing my forecast for the next years - Updated to account for the latest evolution of spx, which suggests that the spx is rushing toward the top faster than before, which brings the top closer. I see a top in spring-summer of 2021 to finish the larger degree wave 1 which started in 2009, followed by a wave 2 down in the end of 2021-2022, and then a wave 3 up until at least 2042.
I expect wave 2 to go down to ma(200) on monthly, which probably will be around 1900-2000 by then.
You won't find this prediction anywhere on the net other than here. Enjoy!

Current Elliott Waves - From 2855.94, it started red wave 3, and so far it finished black waves i, ii, iii and iv, and now it is doing black wave v. In my opinion, spx finished already blue subwaves 1, 2, 3 and 4 and it is doing now subwave 5. When blue subwave 5 is done (one week or so), it will finish red wave 3, so I expect a sizeable drop (at least 100 points on spx), probably in the shape of an ABC down.

G
Thanks a lot. According to stats I follow - one week downturn is ACCURATE and implies 100-150 points maximum for the total correction.
Thanks again for your expert assessment.
Thx,
Nice done and explained.
I thought to understand that OEW is somewhere on 13333xx and see this finishing around +2037
With x further clarification of what ...
Hence they see also major drops as a lot of 4's has to be "defended" ...
Which would be zigzag or which would be a big drop ... is unclear ...
Thx
|
Followers
|
16
|
Posters
|
|
|
Posts (Today)
|
0
|
Posts (Total)
|
411
|
|
Created
|
06/05/19
|
Type
|
Free
|
| Moderators | |||
No penny stocks allowed - posting any penny stock will get you banned.
| Volume | |
| Day Range: | |
| Bid Price | |
| Ask Price | |
| Last Trade Time: |

