 News
News  Market Data
  Discover
Support: 888-992-3836
Copyright © 2023 InvestorsHub Inc.


Register for free to join our community of investors and share your ideas. You will also get access to streaming quotes, interactive charts, trades, portfolio, live options flow and more tools.
small cap miners will most likely way out perform GDX but i like to stick with something i know.
watch the sky, its now clear this it was 1979 over again.
$GOLD MINERS NEWS - $Gold now has a historical breakout vs US CPI. A very bullish chart for precious metals.
$Gold Has Also Broken Out vs CPI

The inflation-adjusted $gold price having a 44-year break out has absolutely massive implications going forward…
$15,000 GOLD Soon! Prepare for the BIGGEST $Gold & $Silver Rally in 50 Years - John Rubino
Money Sense

John is a veteran in the field, and has sound logic and discussions. not like most on the internet. Although i disagree with his price, is see gold....within 3 years, at 33k.
$15,000 GOLD Soon! Prepare for the BIGGEST Gold & Silver Rally in 50 Years - John Rubino
Money Sense
Central Bank Gold Buying Doubled in July
Mike Maharrey
September 3rd, 2024
·
https://www.moneymetals.com/news/2024/09/03/central-bank-gold-buying-doubled-in-july-003427
DD....Aris Mining Corporation (Aris Mining or the Company) (TSX:...
https://ih.advfn.com/stock-market/AMEX/aris-mining-ARMN/stock-news/94431244/aris-mining-publishes-its-2023-sustainability-repo
DD....Pelangio Exploration Inc. NEWS -
https://investorshub.advfn.com/boards/read_msg.aspx?message_id=175015670
DD....
Patagonia Gold Corp, formerly known as Hunt Mining Corp., is a Silver and Gold production company.
https://investorshub.advfn.com/boards/read_msg.aspx?message_id=175002209
https://investorshub.advfn.com/boards/read_msg.aspx?message_id=172090585
Gold CoT: Peek Into Future Through Futures, How Hedge Funds Are Positioned
By: Hedgopia | August 31, 2024
• Following futures positions of non-commercials are as of August 27, 2024.
Gold: Currently net long 294.4k, up 3.2k.

Going into this week, gold went sideways at $2,540s-50s for six sessions. This continued this week before suffering a 1.3-percent tumble on Friday, losing 0.7 percent for the week to $2,528/ounce. This preceded last week’s spinning top.
Earlier, the metal posted a fresh record of $2,570 on the 20th. Before that, it went sideways at $2,440s-50s for more than three months before breaking out early this month. It is probable the yellow metal is headed for a breakout retest. Non-commercials do not seem much worried about a breach; they are net long gold futures the most since March 2020.
Read Full Story »»»
 DiscoverGold
NY Gold Futures »» Weekly Summary Analysis
By: Marty Armstrong | August 31, 2024
Next Monday is Labor Day, which is a holiday in the United States. NY Gold Futures closed today at 25276 and is trading up about 22% for the year from last year's settlement of 20718. Caution is required for this market is starting to suggest it may now decline on the MONTHLY level. Presently, this market has been rising for 10 months going into September suggesting that this has been a bull market trend on the monthly time level which has been confirmed by electing all of our model's long-term Bullish Reversals from the key low.
ECONOMIC CONFIDENCE MODEL CORRELATION
Here in NY Gold Futures, we do find that this particular market has correlated with our Economic Confidence Model in the past. The Last turning point on the ECM cycle low to line up with this market was 2022 and 2015. The Last turning point on the ECM cycle high to line up with this market was 2020 and 2011 and 1996.
MARKET OVERVIEW
NEAR-TERM OUTLOOK
The NY Gold Futures has continued to make new historical highs over the course of the rally from 2015 moving into 2024. However, this last portion of the rally has taken place over 9 years from the last important low formed during 2015. We have elected four Bullish Reversals to date.
This market remains in a positive position on the weekly to yearly levels of our indicating models. Pay attention to the Monthly level for any serious change in long-term trend ahead.
From a perspective using the indicating ranges on the Daily level in the NY Gold Futures, this market remains moderately bullish currently with underlying support beginning at 25198 and overhead resistance forming above at 25385. The market is trading closer to the support level at this time.
On the weekly level, the last important high was established the week of August 19th at 25704, which was up 11 weeks from the low made back during the week of June 3rd. Afterwards, the market bounced for 11 weeks reaching a high during the week of August 19th at 25064. Since that high, we have been generally trading down to sideways for the past week, which has been a reasonable move of 1.704% in a reactionary type decline. Nonetheless, the market still has not penetrated that previous low of 23042 as it has fallen back reaching only 25266 which still remains 9.651% above the former low.
When we look deeply into the underlying tone of this immediate market, we see it is currently still in a semi neutral posture despite declining from the previous high at 25704 made 1 week ago. Still, this market is within our trading envelope which spans between 21978 and 26480. The broader perspective, this current rally into the week of August 19th has exceeded the previous high of 24884 made back during the week of July 15th. This immediate decline has thus far held the previous low formed at 23042 made the week of June 3rd. Only a break of that low would signal a technical reversal of fortune and of course we must watch the Bearish Reversals.
Right now, the market is above momentum on our weekly models hinting this is still bullish for now as well as trend, long-term trend, and cyclical strength. Looking at this from a wider perspective, this market has been trading up for the past 6 weeks overall.
INTERMEDIATE-TERM OUTLOOK
YEARLY MOMENTUM MODEL INDICATOR
Our Momentum Models are declining at this time with the previous high made 2020 while the last low formed on 2023. However, this market has rallied in price with the last cyclical high formed on 2023 and thus we have a divergence warning that this market is starting to run out of strength on the upside.
Interestingly, the NY Gold Futures has been in a bullish phase for the past 21 months since the low established back in November 2022.
Critical support still underlies this market at 22840 and a break of that level on a monthly closing basis would warn that a sustainable decline ahead becomes possible. Immediately, the market is trading within last month's trading range in a neutral position.
DiscoverGold
$GDX #Miners - Here we see A 'Channel' - 'Coil' - 'Cup' & Handle' & a 'Gann Fan'...
By: Sahara | August 30, 2024
• $GDX #Miners - Here we see A 'Channel' - 'Coil' - 'Cup' & Handle' & a 'Gann Fan'...

Read Full Story »»»
DiscoverGold
https://wolfstreet.com/2024/08/29/buyers-strike-deepens-pending-home-sales-drop-to-record-low-despite-surging-supply-much-lower-mortgage-rates-that-already-priced-in-massive-rate-cuts/ Great for Gold and Silver, but we knew that long before the stats now didnt we?
2 Mining Stocks Cashing in on Gold's Shine
By: Schaeffer's Investment Research | August 29, 2024
• Interest rate expectations and encouraging economic data are keeping gold prices higher
• GOLD and NEM are both trading at or near multi-year highs
Gold prices are on the move again, solidifying gains after second-quarter gross domestic product (GDP) showed upwardly-revised growth. Combined with the near-certainty of an interest rate cut from the Federal Reserve at the central bank's meeting next month, the safe-haven asset has been flying high, up over 22% in 2024. Gold miners Barrick Gold Corp (NYSE:GOLD) and Newmont Corporation (NYSE:NEM) are enjoying the tailwinds as well.
Barrick Gold stock was last seen up 2.3% to trade at $20.31, just a chip-shot from its Aug. 20 two-year high of $20.88. The shares are up 14% year-to-date and have gained 22% this quarter alone.
Options seem to be affordably priced. The equity's Schaeffer's Volatility Index (SVI) of 29% ranks in the relatively low 18th percentile of its 12-month range, meaning options traders are pricing in low volatility expectations right now.
Newmont stock is 2.5% higher to trade at $53.13 at last check, and earlier hit a multi-year high of $53.30. The shares have carved out a channel of higher highs since briefly breaching $30 on Feb. 28, and are now up 30% in 2024.
While calls outpace puts on an absolute basis, Newmont's 10-day put/call volume ratio over at the International Securities Exchange (ISE), Cboe Options Exchange (CBOE), and NASDAQ OMX PHLX (PHLX) stands higher than 98% of annual readings. This means puts have been getting picked up at a quicker-than-usual clip lately. Given only a slim 1.6% of NEM's total available float is sold short, some of this activity could be due to shareholders protecting paper profits against any unexpected downside risk,

Read Full Story »»»
DiscoverGold
$GDX #Miners - That 'Pennant' gave way so I put a Parallel of the top line, below it for a Bull 'Flag'...
By: Sahara | August 29, 2024
• $GDX #Miners - That 'Pennant' gave way so I put a Parallel of the top line, below it for a Bull 'Flag'...
So far

Read Full Story »»»
DiscoverGold
Gold fell for the bogus GDP upward revision. It’s government jobs and rich buying stuff, not the rest of us, and still they fake the numbers. More evidence it all blows up because funny numbers don’t feed people, unhappy and angry people. 10s of millions barely making it while giggles and Gavin gives free food, phones, housing to illegals.
$GDX #Miners - 'Coil'?...
By: Sahara | August 27, 2024
• $GDX #Miners - 'Coil'?...

Read Full Story »»»
DiscoverGold
Gold CoT: Peek Into Future Through Futures, How Hedge Funds Are Positioned
By: Hedgopia | August 24, 2024
• Following futures positions of non-commercials are as of August 20, 2024.
Gold: Currently net long 291.3k, up 24k.

Gold trudged higher to yet another record in a spinning top week. The metal rose 0.3 percent to $2,546/ounce, with an intraday high of $2,570 on the 20th.
The yellow metal has gone sideways at $2,540s-50s the last six sessions. A possible breakout in the sessions ahead will open the door toward this week’s high, and that will decide which way gold goes near-term.
Earlier, the metal went sideways at $2,440s-50s for more than three months before breaking out early this month. Gold bugs should be fine as long as this breakout remains intact.
In the meantime, non-commercials are net long gold futures the most since March 2020.
Read Full Story »»»
DiscoverGold
Gold Mid-Tiers’ Q2’24 Fundamentals
By: Adam Hamilton | August 23, 2024
The mid-tier and junior gold miners in this sector’s sweet spot for upside potential just finished reporting truly-spectacular quarterly results. Fueled by dazzling record gold prices and lower mining costs, smaller gold miners’ unit earnings skyrocketed to their highest levels ever. Those incredibly-rich profits have left mid-tiers even more undervalued relative to prevailing gold prices, portending massive catch-up rallying.
The leading mid-tier-gold-stock benchmark is the GDXJ VanEck Junior Gold Miners ETF. With $5.5b in net assets mid-week, it remains the second-largest gold-stock ETF after its big brother GDX. That is dominated by far-larger major gold miners, though there is much overlap between these ETFs’ holdings. Still misleadingly named, GDXJ is overwhelmingly a mid-tier gold-stock ETF with juniors having little weighting.
Gold-stock tiers are defined by miners’ annual production rates in ounces of gold. Small juniors have little sub-300k outputs, medium mid-tiers run 300k to 1,000k, large majors yield over 1,000k, and huge super-majors operate at vast scales exceeding 2,000k. Translated into quarterly terms, these thresholds shake out under 75k, 75k to 250k, 250k+, and 500k+. Today only three of GDXJ’s 25 biggest holdings are true juniors!
Their Q2 outputs are highlighted in blue in the table below. Juniors not only mine less than 75k ounces per quarter, but their gold output generates over half their quarterly revenues. That excludes streaming and royalty companies that purchase future gold output for big upfront payments used to finance mine-builds, and primary silver miners producing byproduct gold. But mid-tiers often make better investments than juniors.
These gold miners dominating GDXJ offer a unique mix of sizable diversified production, excellent output-growth potential, and smaller market capitalizations ideal for outsized gains. Mid-tiers are less risky than juniors, while amplifying gold uplegs more than majors. So we’ve long specialized in the fundamentally-superior mid-tiers and juniors at Zeal, actively trading these smaller gold miners for a quarter-century now.
All 1,510 newsletter stock trades realized as of Q2’24 averaged +15.6% annualized gains, about double the long-term stock-market average! And that’s heading higher, after early August’s Japanic fear spike stopped out more trades with big realized gains. We’ve been refilling our newsletter trading books since, as gold-stock prices remain way too low relative to their phenomenal fundamentals at lofty prevailing gold levels.
GDXJ’s latest upleg has powered 59.2% higher at best over 9.4 months into mid-July. That’s still modest by historical precedent, and smaller gold miners’ gains really accelerate later in gold uplegs. The longer and higher gold climbs, the more bullish sentiment that fuels which attracts back traders to chase big gold-stock gains. Eventually a psychological tipping point is reached and that buying becomes self-feeding.
For 33 quarters in a row now, I’ve painstakingly analyzed the latest operational and financial results from GDXJ’s 25-largest component stocks. Mostly mid-tiers, they now account for 65.6% of this ETF’s total weighting. While digging through quarterlies is a ton of work, understanding smaller gold miners’ latest fundamentals really cuts through the obscuring sentiment fogs shrouding this sector. This research is essential.
This table summarizes the GDXJ top 25’s operational and financial highlights during Q2’24. These gold miners’ stock symbols aren’t all US listings, and are preceded by their rankings changes within GDXJ over this past year. The shuffling in their ETF weightings reflects shifting market caps, which reveal both outperformers and underperformers since Q2’23. Those symbols are followed by their recent GDXJ weightings.
Next comes these gold miners’ Q2’24 production in ounces, along with their year-over-year changes from the comparable Q2’23. Output is the lifeblood of this industry, with investors generally prizing production growth above everything else. After are the costs of wresting that gold from the bowels of the earth in per-ounce terms, both cash costs and all-in sustaining costs. The latter help illuminate miners’ profitability.
That’s followed by a bunch of hard accounting data reported to securities regulators, quarterly revenues, earnings, operating cash flows, and resulting cash treasuries. Blank data fields mean companies hadn’t disclosed that particular data as of the middle of this week. The annual changes aren’t included if they would be misleading, like comparing negative numbers or data shifting from positive to negative or vice-versa.
Weeks before Q2 earnings season even began, I predicted last quarter would prove gold miners’ most-profitable ever in a late-June essay on “Gold Miners’ Record Quarter”. But despite my high expectations, the smaller gold miners’ epic Q2 performances exceeded them! This still-mostly-unloved sector is firing on all cylinders. Yet the vast majority of traders remain unaware, leaving massive room to chase this bull.

The GDXJ top 25 experienced some major composition changes over the past year, with five smaller gold miners rocketing up into these elite ranks. All are mid-tier and junior producers, which usually have way-better fundamentals than streamers, royalty companies, and explorers. So GDXJ is becoming purer as traders bid better producers’ stocks much higher, increasing this ETF’s upside leverage to higher gold prices.
These GDXJ-top-25 stocks are mostly an expanded subset of the GDX-top-25 majors. I analyzed their new Q2 results in last week’s essay, which were also awesome yet still not as impressive as GDXJ’s. These GDXJ-top-25 stocks representing 65.6% of this ETF are also collectively weighted at 25.3% in GDX. GDXJ effectively lops off GDX’s nine largest holdings, which are mostly deadweight super-majors.
Those gigantic gold miners perpetually struggle to overcome depletion at the vast scales they operate. So their output generally shrinks, except for four quarters after expensive acquisitions. Their extensive stables of mines also tend to have higher costs, making for lower profitability. And because of far-larger market capitalizations, super-majors’ stocks are much harder to bid higher during major gold uplegs.
Production growth trumps everything else as the primary mission for gold miners. Higher outputs boost operating cash flows which help fund mine expansions, builds, and purchases, fueling virtuous circles of growth. Mining more gold also boosts profitability, lowering unit costs by spreading big fixed operational expenses across more ounces. The GDXJ top 25 eked out 0.4%-YoY output growth to 2,937k ounces in Q2.
While small, that extended mid-tiers’ production-growth streak to eight of the last nine quarters! That’s quite impressive, especially compared to the GDX majors’ overall output sliding lower for six quarters in a row now. The big composition changes in GDXJ’s upper ranks didn’t affect that comparison much. Also in the comparable Q2’23, South Africa’s Harmony Gold and China’s Zhaojin Mining hadn’t reported results yet...
* * *
Read Full Story »»»
DiscoverGold
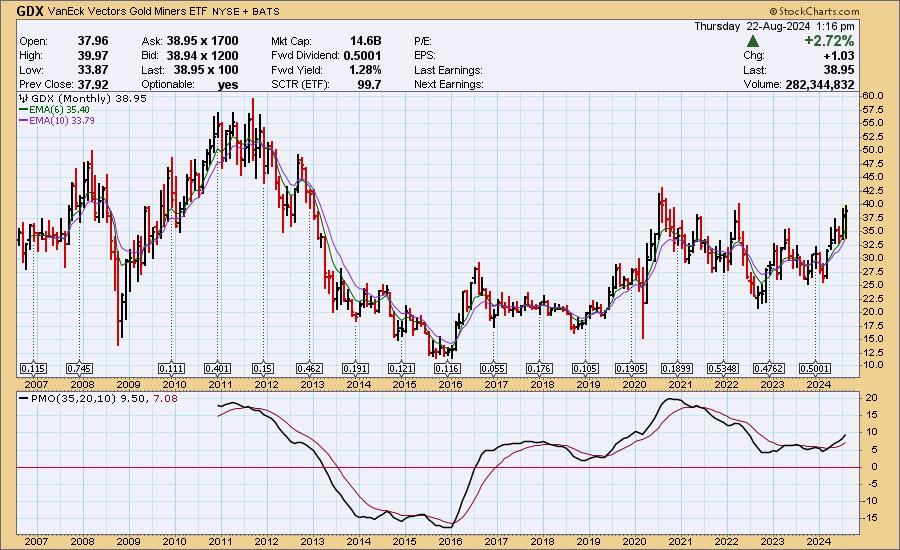
Gold Miners' Performance vs. Gold -- Does It Say Sell Gold?
By: Carl Swenlin | August 22, 2024
In Monday's DecisionPoint Trading Room video, we were asked why we cover Gold Miners (GDX) as well as Gold (GLD). There are two reasons:
1. Some people prefer to own the commodity, Gold, and others prefer to own an operating company that benefits from the price of Gold, such as Gold Miners. For a profitable mining company, when Gold increases in value, most of the increase goes straight to the bottom line because cost of goods is already paid for.
2. Other people prefer Gold Miners because they may pay a dividend, and typically they out-perform Gold by a lot. That applies to movement in both directions. That is to say, Gold Miners will typically go up faster than Gold, but Miners also go down a lot faster than Gold.
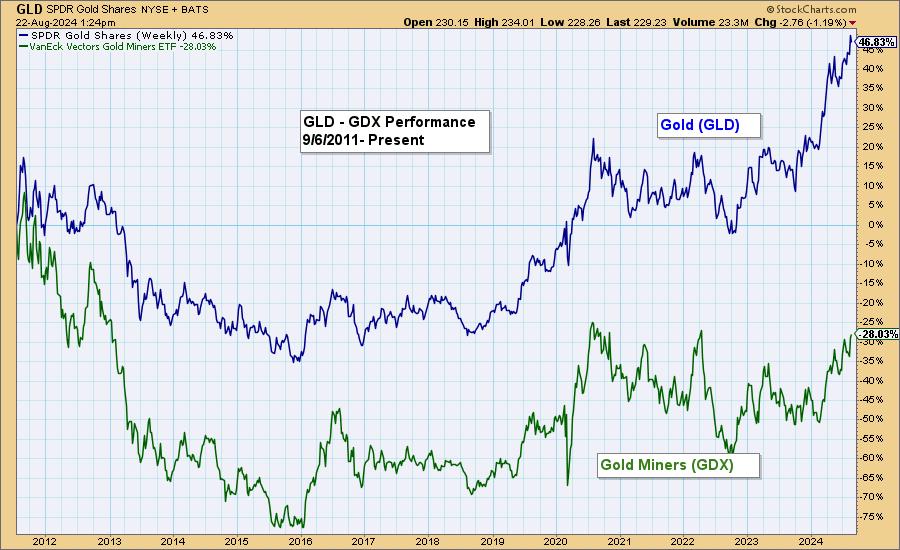
This morning, I heard a money manager who asserted that people who own Gold should be selling it because, while Gold has been making all-time highs, Gold Miners need to advance another +50% to equal its 2011 all-time highs. The chart confirms that, but there is more to consider in this regard.
Here is a performance chart comparing the two from the 2011 top to the present, and we can see that GDX has underperformed GLD by about half.
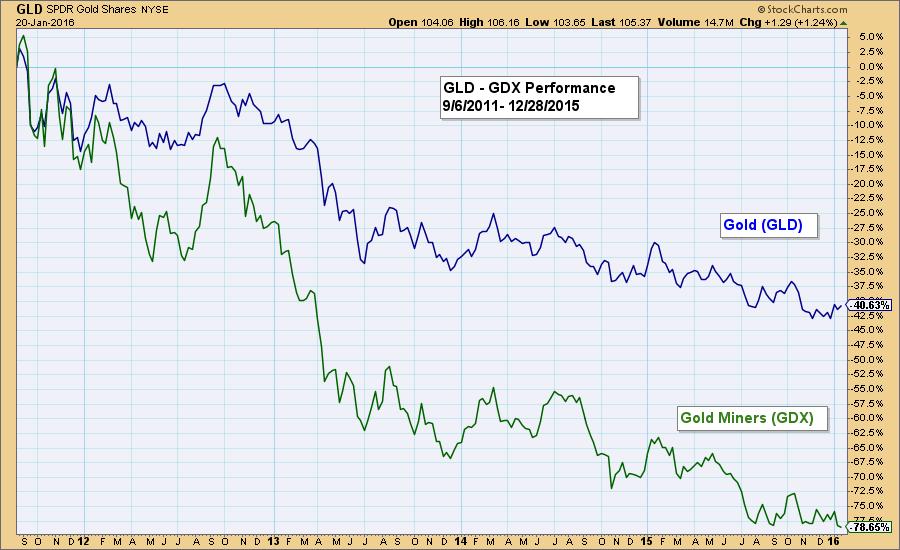
But let's look at just the decline from the 2011 top to the 2015 lows. We can see that GDX fell at an accelerated rate, driven by the negative sentiment associated with GLD's decline.
The chart showing the performance from the 2015 lows shows that GDX has out-performed GLD by a lot, as we would expect; however, GDX took a -45% hit in 20 because of the securities bear market. Also, GLD had a rather tedious two-year sideways episode in 2020 to 2022, which would have been uninspiring to potential Miners investors. Nevertheless, GDX is still out-performing GLD by a considerable amount.
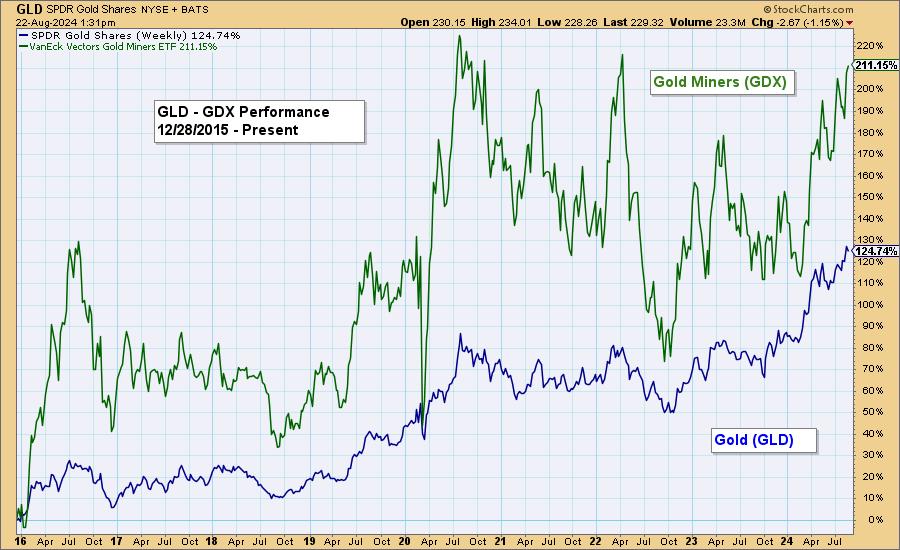
Conclusion: While the assertion that GDX underperformance since the 2011 all-time high justifies avoiding Gold, I think the premise does not consider all the evidence. Most important was the 2022 hit, which drove GDX down over -2.5 times more than GLD. That had less to do with Gold's prospects than it did with general bear market panic.
Read Full Story »»»
DiscoverGold
$GDX #miners - Striving to B/Out...
By: Sahara | August 20, 2024
• $GDX #miners - Striving to B/Out...


Read Full Story »»»
DiscoverGold
$GDX #Miners - Trippin the Targets after popping that 'Broadening' Plot...
By: Sahara | August 19, 2024
• $GDX #Miners - Trippin the Targets after popping that 'Broadening' Plot...

Read Full Story »»»
DiscoverGold
Gold CoT: Peek Into Future Through Futures, How Hedge Funds Are Positioned
By: Hedgopia | August 17, 2024
• Following futures positions of non-commercials are as of August 13, 2024.
Gold: Currently net long 267.3k, up 28.5k.

Gold rallied 2.6 percent this week to a new closing high of $2,538/ounce, with an intraday high of $2,548.
Earlier, the metal went sideways at $2,440s-50s for more than three months before breaking out early this month. As long as gold bugs are able to defend this level, the ball remains in their court.
Read Full Story »»»
DiscoverGold
NY Gold Futures »» Weekly Summary Analysis
By: Marty Armstrong | August 17, 2024
NY Gold Futures closed today at 25378 and is trading up about 22% for the year from last year's settlement of 20718. Factually, this market has been rising for 9 months going into August suggesting that this has been a bull market trend on the monthly time level which has been confirmed by electing all of our model's long-term Bullish Reversals from the key low. As we stand right now, this market has made a new high exceeding the previous month's high reaching thus far 25483 while it has not broken last month's low so far of 23274. Nevertheless, this market is still trading above last month's high of 24966.
ECONOMIC CONFIDENCE MODEL CORRELATION
Here in NY Gold Futures, we do find that this particular market has correlated with our Economic Confidence Model in the past. The Last turning point on the ECM cycle low to line up with this market was 2022 and 2015. The Last turning point on the ECM cycle high to line up with this market was 2020 and 2011 and 1996.
MARKET OVERVIEW
NEAR-TERM OUTLOOK
The NY Gold Futures has continued to make new historical highs over the course of the rally from 2015 moving into 2024. However, this last portion of the rally has taken place over 9 years from the last important low formed during 2015. We have elected four Bullish Reversals to date.
This market remains in a positive position on the weekly to yearly levels of our indicating models. Pay attention to the Monthly level for any serious change in long-term trend ahead.
From a perspective using the indicating ranges on the Daily level in the NY Gold Futures, this market remains in a bullish position at this time with the underlying support beginning at 25173.
On the weekly level, the last important high was established the week of August 12th at 25483, which was up 10 weeks from the low made back during the week of June 3rd. So far, this week is trading within last week's range of 25483 to 24627. Nevertheless, the market is still trading upward more toward resistance than support. A closing beneath last week's low would be a technical signal for a correction to retest support.
When we look deeply into the underlying tone of this immediate market, we see it is currently still in a semi neutral posture despite declining from the previous high at 25483 made 0 week ago. This market has made a new historical high this past week reaching 25483. Here the market is trading positive gravitating more toward resistance than support. We have technical support lying at 24996 which we are still currently trading above for now.
Right now, the market is above momentum on our weekly models hinting this is still bullish for now as well as trend, long-term trend, and cyclical strength. Looking at this from a wider perspective, this market has been trading up for the past 1 week overall.
INTERMEDIATE-TERM OUTLOOK
YEARLY MOMENTUM MODEL INDICATOR
Our Momentum Models are declining at this time with the previous high made 2020 while the last low formed on 2023. However, this market has rallied in price with the last cyclical high formed on 2023 and thus we have a divergence warning that this market is starting to run out of strength on the upside.
Interestingly, the NY Gold Futures has been in a bullish phase for the past 20 months since the low established back in November 2022.
Critical support still underlies this market at 22480 and a break of that level on a monthly closing basis would warn that a sustainable decline ahead becomes possible. Nevertheless, the market is trading above last month's high showing some strength.
DiscoverGold
Gold Miners’ Q2’24 Fundamentals
By: Adam Hamilton | August 16, 2024
The major gold miners just reported their best quarterly results ever! Record gold prices combined with lower mining costs catapulted unit earnings to dazzling new records. Yet despite exploding profitability, gold stocks continue to lag gold’s mighty upleg. This anomaly won’t last, as investors increasingly realize how seriously undervalued this sector remains. The resulting capital inflows will drive gold stocks way higher.
The GDX VanEck Gold Miners ETF remains this sector’s dominant benchmark. Birthed way back in May 2006, GDX has parlayed its first-mover advantage into an insurmountable lead. Its $14.0b of net assets mid-week dwarfed the next-largest 1x-long major-gold-miners ETF by nearly 25x! GDX is undisputedly the trading vehicle of choice in this sector, with the world’s biggest gold miners commanding most of its weighting.
Gold-stock tiers are defined by miners’ annual production rates in ounces of gold. Small juniors have little sub-300k outputs, medium mid-tiers run 300k to 1,000k, large majors yield over 1,000k, and huge super-majors operate at vast scales exceeding 2,000k. Translated into quarterly terms, these thresholds shake out under 75k, 75k to 250k, 250k+, and 500k+. Those two largest categories account for nearly 4/7ths of GDX.
While GDX’s overall Q2’24 performance remained weak, it is improving. Last quarter this leading gold-stock ETF climbed 7.3% on a 4.7% gold rally, for 1.6x upside leverage. Normally the major gold miners of GDX amplify material gold moves by 2x to 3x. With gold and gold-stock gains mounting, traders are starting to take notice. In Q1 GDX had only edged up 2.0% on a 7.6% gold surge, for dreadful 0.3x leverage.
As a little contrarian sector usually overlooked, gold stocks have to achieve amazing feats before they win investors’ respect and capital. So they tend to underperform earlier in gold bulls, but way outperform later once they are well-established. Gold’s latest upleg has already powered up into mighty territory, rallying a massive 35.8% at best since early October! Gold just achieved its latest nominal record of $2,472 this week.
Gold’s hefty gains have certainly driven GDX higher, with its own upleg climbing 51.6% at best within this same span. But so far that has only amplified gold a still-anemic 1.4x, which is unusual well into a major gold upleg achieving new record-high streaks. The gold stocks remain fantastic buys relatively late in gold’s powerful run thanks to this unsustainable anomaly. Past precedent agues way-bigger gains are coming.
Gold’s last two uplegs attaining new records both crested in 2020, averaging monster 41.4% gains. GDX leveraged those by a good 2.5x, averaging 105.4% gains during them! Yet major gold stocks are up less than half that in today’s similarly-mighty gold upleg. They’ll catch up, so gold stocks remain a heck of an opportunity. Their glorious record Q2 results should really up sector interest among institutional investors.
For 33 quarters in a row now, I’ve painstakingly analyzed the latest operational and financial results from GDX’s 25-largest component stocks. Mostly super-majors, majors, and larger mid-tiers, they dominate this ETF at 87.5% of its total weighting! While digging through quarterlies is a ton of work, understanding the gold miners’ latest fundamentals really cuts through the obscuring sentiment fogs shrouding this sector.
This table summarizes the operational and financial highlights from the GDX top 25 during Q2’24. These gold miners’ stock symbols aren’t all US listings, and are preceded by their rankings changes within GDX over this past year. The shuffling in their ETF weightings reflects shifting market caps, which reveal both outperformers and underperformers since Q2’23. Those symbols are followed by their current GDX weightings.
Next comes these gold miners’ Q2’24 production in ounces, along with their year-over-year changes from the comparable Q2’23. Output is the lifeblood of this industry, with investors generally prizing production growth above everything else. After are the costs of wresting that gold from the bowels of the earth in per-ounce terms, both cash costs and all-in sustaining costs. The latter help illuminate miners’ profitability.
That’s followed by a bunch of hard accounting data reported to securities regulators, quarterly revenues, earnings, operating cash flows, and resulting cash treasuries. Blank data fields mean companies hadn’t disclosed that particular data as of the middle of this week. The annual changes aren’t included if they would be misleading, like comparing negative numbers or data shifting from positive to negative or vice-versa.
At the end of June a few weeks before Q2’s earnings season even started, I wrote an essay called “Gold Miners’ Record Quarter”. I concluded then “...gold miners will soon report a record quarter. ... Amazingly major gold miners’ average Q2 profits are now tracking over an unprecedented $1,000 per ounce.” That indeed came to pass, well exceeding even my high expectations of “awesome unit profits of $1,013 per ounce!”

Before we get to the fantastic news, the major gold stocks’ Q2 output disappointed. Production growth trumps everything else as the primary mission for gold miners. Higher outputs boost operating cash flows which help fund mine expansions, builds, and purchases, fueling virtuous circles of growth. Mining more gold also boosts profitability, lowering unit costs by spreading big fixed operational expenses across more ounces.
Ominously the GDX-top-25 gold majors’ collective production plunged 7.8% YoY to just 7,465k ounces last quarter! That drop was the second-worst in this research thread, to the lowest levels seen in its entire long 33-quarter span! These elite gold miners way underperformed their smaller peers, as the World Gold Council’s comprehensive Q2 gold supply-and-demand data showed global mining output climbing 3.3% YoY.
Thankfully this is all due to lazy quarterly reporting. GDX includes super-major and major South African and Chinese gold miners. The former report in half-year increments, but on a more-relaxed schedule than American and Canadian gold miners. The latter only haphazardly report in English, and when they deign to their scant results can be delayed for many months. Q2’24 reporting proved even worse than usual.
South Africa’s Gold Fields didn’t release any Q2 results as of mid-week, which is atypical. Normally it at least publishes quarterly updates by now, if not full half-year results. GFI’s management has probably been distracted by their new buyout of Canada’s Osisko Mining, to consolidate ownership in a great gold deposit they jointly own. South Africa’s Harmony Gold’s fiscal year ends in Q2, so that report is always later.
China’s Zijin Mining and Zhaojin Mining haven’t reported any Q2 results yet either. Occasionally they put out something in the normal quarter-end reporting window, but mostly not. In the comparable Q2’23, the super-majors Zijin and Gold Fields had reported mining 1,091k ounces. But Zhaojin and Harmony had not issued any quarterly results yet back then. Excluding all four makes for a much-better annual comparison...
* * *
Read Full Story »»»
DiscoverGold
$GDXJ #Miners - Popped the 'Broadening' Plot. Need to be wary of a Pop-n-Drop. Want to see the Ratio to GLD Hold the Pop too (Top Pane)...
By: Sahara | August 16, 2024
• $GDXJ #Miners - Popped the 'Broadening' Plot.
Need to be wary of a Pop-n-Drop. Want to see the Ratio to GLD Hold the Pop too (Top Pane)...

Read Full Story »»»
DiscoverGold
At the end of the road I possibly see 1 or 2 ratio with BTC. I think the plan, and launch, of gold has been written and approved.
Gold Mining Stock Barrick Gold (GOLD) Shines After Top-Line Beat
By: Schaeffer's Investment Research | August 12, 2024
• Barrick Gold is on track for its best single-session of 2024 after the miner's earnings
• GOLD calls are flying off the shelves today, with an emphasis on August and September
Gold prices will be worth watching this week both before and after consumer price index (CPI) data is released for July. The safe-haven asset has stabilized in the wake of last Monday's shock selloff, and one mining stock is powering higher today.
Barrick Gold Corp (NYSE:GOLD) is near the top of the New York Stock Exchange (NYSE) this morning, last seen up 4.9% to trade at $18.26. The Canada-based gold miner reported adjusted second-quarter earnings of 32 cents per share on $3.16 billion in revenue, both of which topped analyst estimates.
Thanks to today's pop, which has the stock on track for its best single-session gain since Dec. 13, GOLD has reclaimed its year-to-date breakeven level. The shares have tacked on 34% since their Feb. 14 annual low of $13.76.
Call traders are coming out of the woodwork. In just the first hour of trading, over 23,000 calls have changed hands, volume that's five times the average intraday amount and 13 times the number of puts traded. The September 19 call is the most popular, followed by the August 18 call that expires at the end of this week.
The bullish skew toward Barrick is echoed by analysts and short sellers. The majority of analysts rate GOLD a "buy" or better, with zero "sells" on the books, while a slim 0.8% of the stock's total available float is sold short.
Read Full Story »»»
DiscoverGold
$GDX #Miners - Volatility and Dwnwrd Pressure remain
By: Sahara | August 12, 2024
• $GDX #Miners - Volatility and Dwnwrd Pressure remain.
Whilst within the 'Broadening' Plot and MA's remain bullishly unaligned...

Read Full Story »»»
DiscoverGold
DOW Gold ratio headed to 1. DOW gonna stall or drop during this event of a generation. QE delayed it, if anything it will accelerate the dollars destruction.
<a href='https://www.macrotrends.net/1378/dow-to-gold-ratio-100-year-historical-chart'>Dow to Gold Ratio - 100 Year Historical Chart</a>
https://www.isabelnet.com/wp-content/uploads/2021/08/Fed-Balance-Sheet-Expansion-Contraction-vs.-SP-500.png
Gold CoT: Peek Into Future Through Futures, How Hedge Funds Are Positioned
By: Hedgopia | August 10, 2024
• Following futures positions of non-commercials are as of August 6, 2024.
Gold: Currently net long 238.7k, down 7.9k.

The week produced a bit for both the bulls and bears. In a volatile session Monday, gold fell as low as $2,404 and remained under prior resistance at $2,450s the next two sessions but only for gold bugs to show up in the remaining two sessions to end the week up 0.15 percent to $2,473/ounce.
Gold is under last Friday’s record $2,488 but at the same time closed above $2,450s. Near-term, odds favor the bulls, with the caveat that non-commercials with sizable long exposure continue to reduce their holdings, albeit at a measured pace.
Read Full Story »»»
DiscoverGold
NY Gold Futures »» Weekly Summary Analysis
By: Marty Armstrong | August 10, 2024
NY Gold Futures closed today at 24734 and is trading up about 19% for the year from last year's settlement of 20718. At the moment, this market has been rising for 9 months going into August suggesting that this has been a bull market trend on the monthly time level which has been confirmed by electing all of our model's long-term Bullish Reversals from the key low. As we stand right now, this market has made a new high exceeding the previous month's high reaching thus far 25225 while it has not broken last month's low so far of 23274. Nevertheless, this market is still trading above last month's close of 24730.
ECONOMIC CONFIDENCE MODEL CORRELATION
Here in NY Gold Futures, we do find that this particular market has correlated with our Economic Confidence Model in the past. The Last turning point on the ECM cycle low to line up with this market was 2022 and 2015. The Last turning point on the ECM cycle high to line up with this market was 2020 and 2011 and 1996.
MARKET OVERVIEW
NEAR-TERM OUTLOOK
The NY Gold Futures has continued to make new historical highs over the course of the rally from 2015 moving into 2024. However, this last portion of the rally has taken place over 9 years from the last important low formed during 2015. Noticeably, we have elected four Bullish Reversals to date.
This market remains in a positive position on the weekly to yearly levels of our indicating models. Pay attention to the Monthly level for any serious change in long-term trend ahead.
Focusing on our perspective using the indicating ranges on the Daily level in the NY Gold Futures, this market remains moderately bullish currently with underlying support beginning at 24595 and overhead resistance forming above at 25225. The market is trading closer to the support level at this time.
On the weekly level, the last important high was established the week of July 29th at 25225, which was up 8 weeks from the low made back during the week of June 3rd. Afterwards, the market bounced for 8 weeks reaching a high during the week of July 29th at 24145. Since that high, we have been generally trading down for the past week, which has been a sharp move of 4.705% in a reactionary type decline. Nonetheless, the market still has not penetrated that previous low of 23042 as it has fallen back reaching only 24038 which still remains 4.322% above the former low.
When we look deeply into the underlying tone of this immediate market, we see it is cautiously starting to weaken as even the stocastics are weakening especially since last week was a highImmediately, this decline from the last high established the week of July 29th has been important Before, this recent rally exceeded the previous high of 23826 made back during the week of June 17th. Nonetheless, that high was actually lower than the previous high made the week of May 20th suggesting this market has really been running out of sustainable buying for right now. This immediate decline has thus far held the previous low formed at 23042 made the week of June 3rd. Only a break of that low would signal a technical reversal of fortune and of course we must watch the Bearish Reversals. Right now, the market is neutral on our weekly Momentum Models warning we have overhead resistance forming and support in the general vacinity of 23957. Additional support is to be found at 23274. From a pointed viewpoint, this market has been trading down for the past week.
INTERMEDIATE-TERM OUTLOOK
YEARLY MOMENTUM MODEL INDICATOR
Our Momentum Models are declining at this time with the previous high made 2020 while the last low formed on 2023. However, this market has rallied in price with the last cyclical high formed on 2023 and thus we have a divergence warning that this market is starting to run out of strength on the upside.
Interestingly, the NY Gold Futures has been in a bullish phase for the past 20 months since the low established back in November 2022.
Critical support still underlies this market at 22480 and a break of that level on a monthly closing basis would warn that a sustainable decline ahead becomes possible. Nevertheless, the market is trading above last month's high showing some strength.
DiscoverGold
$GDX #Miners - At the Breakpoint of the Lrgr 'Coil'. Bi/Wkly 12/20 MA's Bullishly Aligned and offering spprt...
By: Sahara | August 9, 2024
• $GDX #Miners - Poised
At the Breakpoint of the Lrgr 'Coil'. Bi/Wkly 12/20 MA's Bullishly Aligned and offering spprt...

Read Full Story »»»
DiscoverGold
Gold always does this, when the conditions are there, and they are, which is part of the rubber band effect that will occur for gold. Reality will set in, when they see the fire in front of them.
https://www.zerohedge.com/political/i-thought-gold-was-safe-haven-why-did-it-tank-stocks
A sovereign or other large entity just bought 10M oz worth of gold. Did they bring it down for this or just take advantage of the fire sale?
If gold does not climb back above 2400 today, GDX will drop, if u day trade, today is a day.
$GDX #Miners - Deep Thrust Lwr from that tap of the 3rd Target. Looking for a Corrective 1-2 of (3) here...
By: Sahara | August 5, 2024
• $GDX #Miners - Update
Deep Thrust Lwr from that tap of the 3rd Target. Looking for a Corrective 1-2 of (3) here...

Read Full Story »»»
DiscoverGold
Wow everything getting slaughtered today.
NY Gold Futures »» Weekly Summary Analysis
By: Marty Armstrong | August 3, 2024
NY Gold Futures closed today at 24698 and is trading up about 19% for the year from last year's settlement of 20718. As of now, this market has been rising for 9 months going into August suggesting that this has been a bull market trend on the monthly time level which has been confirmed by electing all of our model's long-term Bullish Reversals from the key low. As we stand right now, this market has made a new high exceeding the previous month's high reaching thus far 25225 while it has not broken last month's low so far of 23274. Nevertheless, this market is currently trading below last month's close of 24730.
ECONOMIC CONFIDENCE MODEL CORRELATION
Here in NY Gold Futures, we do find that this particular market has correlated with our Economic Confidence Model in the past. The Last turning point on the ECM cycle low to line up with this market was 2022 and 2015. The Last turning point on the ECM cycle high to line up with this market was 2020 and 2011 and 1996.
MARKET OVERVIEW
NEAR-TERM OUTLOOK
The NY Gold Futures has continued to make new historical highs over the course of the rally from 2015 moving into 2024. However, this last portion of the rally has taken place over 9 years from the last important low formed during 2015. Distinctly, we have elected four Bullish Reversals to date.
This market remains in a positive position on the weekly to yearly levels of our indicating models. Pay attention to the Monthly level for any serious change in long-term trend ahead.
Looking at the indicating ranges on the Daily level in the NY Gold Futures, this market remains moderately bullish currently with underlying support beginning at 24583 and overhead resistance forming above at 24745. The market is trading closer to the resistance level at this time.
On the weekly level, the last important high was established the week of July 29th at 25225, which was up 8 weeks from the low made back during the week of June 3rd. So far, this week is trading within last week's range of 25225 to 24145. Nevertheless, the market is still trading upward more toward resistance than support. A closing beneath last week's low would be a technical signal for a correction to retest support.
When we look deeply into the underlying tone of this immediate market, we see it is currently still in a weak posture. This market has made a new historical high this past week reaching 25225. Here the market is trading positive gravitating more toward resistance than support. We have technical support lying at 24340 which we are still currently trading above for now.
Right now, the market is above momentum on our weekly models hinting this is still bullish for now as well as trend, long-term trend, and cyclical strength. Looking at this from a wider perspective, this market has been trading up for the past 1 week overall.
INTERMEDIATE-TERM OUTLOOK
YEARLY MOMENTUM MODEL INDICATOR
Our Momentum Models are declining at this time with the previous high made 2020 while the last low formed on 2023. However, this market has rallied in price with the last cyclical high formed on 2023 and thus we have a divergence warning that this market is starting to run out of strength on the upside.
Interestingly, the NY Gold Futures has been in a bullish phase for the past 20 months since the low established back in November 2022.
Critical support still underlies this market at 22480 and a break of that level on a monthly closing basis would warn that a sustainable decline ahead becomes possible. Nevertheless, the market is trading above last month's high showing some strength.
DiscoverGold
Gold-Stock Tipping Point
By: Adam Hamilton | August 2, 2024
The gold miners’ stocks look to be nearing a crucial psychological tipping point. After years of mostly being ignored, this small contrarian sector seems on the verge of roaring back into favor. When gold stocks grow popular and traders increasingly chase them, their gains grow massive. More than doubling in individual uplegs isn’t unusual, and total bull-market returns can easily exceed an order of magnitude.
For a quarter-century now, I’ve been studying, trading, and writing newsletters primarily about gold and its miners’ stocks. Since 2000 I’ve penned 1,132 of these weekly web essays, 1,107 weekly subscription newsletters, and another 289 monthly subscription newsletters! The latter two have recommended and closed fully 1,510 individual mostly-gold-stock trades, which have all averaged 15.6% annualized realized gains.
That’s a great record spread across 25 years, roughly twice the long-term stock-market average! The key to that is staying informed, always following gold stocks no matter how they are faring. That’s the only way to consistently buy lower then later sell higher. Sadly the vast majority of traders miss most opportunities because they only pay attention when sectors are hot, after big gains have already been won.
That natural human tendency has been the most-frustrating part of the newsletter business for me. The most-important times for traders to be interested in gold stocks are when they are beaten-down and deeply out of favor. Those are the best buy-relatively-low opportunities, the easiest times to multiply wealth. Yet around those pivotal lows, interest and sales wither as bearishness reigns and traders capitulate.
Gold stocks’ last couple major lows weren’t long ago, early October 2023 and late February 2024. Then the leading GDX gold-stock ETF and benchmark plunged to just $25.91 and $25.79. I pounded the table on the incredible opportunities in this sector around both lows, and we filled our newsletter trading books with cheap fundamentally-superior mid-tier and junior miners. Only diligent traders paying attention participated.
That latest week languishing gold stocks bottomed, I wrote a whole essay explaining why that was such a fantastic buying opportunity in late February. Traders need to stay informed and engaged when sectors are unloved and deeply oversold after just selling off substantially. That’s why I’ve subscribed to excellent financial newsletters covering various sectors since high school, and later went into this business myself.
Staying abreast of markets professionally requires great expertise painstakingly forged over decades of full-time work. Few analysts attain this to greater degrees than seasoned newsletter writers. Rather than putting in all that work myself for other sectors, I can reap their experts’ awesome wisdom in little time for trivial subscription fees. But newsletters are only valuable if you consistently digest them through all cycles.
On the last day of February my essay concluded “Excessive selling has slammed GDX way back down to early-October levels when today’s gold upleg was born. Yet that makes zero sense fundamentally with gold remaining about 12% higher. These seriously-oversold gold stocks riddled with capitulatory bearishness is an anomaly that will prove short-lived. They are due to soon mean revert sharply higher with gold.”
Naturally that proved correct, as you’d expect after a quarter-century of studying a sector. Over the next 4.6 months into mid-July, GDX blasted 52.3% higher. Our newsletter trades added around those lows have fared even better, with unrealized gains running as high as 97.2% then! There’s no magic in that, just time on task. The more years anyone devotes to studying anything, the more their knowledge on it grows.
Our innately-human herd psychology works alike across all markets, from mega-cap tech stocks to crypto to physical commodities to gold stocks. When prices are low after major selloffs, bearishness and apathy lead traders to abandon sectors. Right when they should be diligently engaged looking for opportunities to buy in relatively-low, they flee. That’s why most speculators and investors ultimately fail in the markets.
Then later when those same perpetually-cyclical sectors inevitably rebound soaring to lofty heights, traders flock back. They get caught up in the popular greed and euphoria stoked by increasing and more-bullish financial-media coverage. As their interest soars they flood into sector newsletters, then end up buying in relatively-high after the lion’s share of gains have already been won. Way late, they usually ride down selloffs.
Sector psychology follows prevailing price levels, slowly swinging like a giant pendulum between greed and fear. The reason I’m writing today’s essay is gold-stock sentiment sure seems to be nearing the halfway point at the bottom of that arc! This sector is no longer mired in fear like in late February when traders should’ve been aggressively buying. But despite their surge, gold stocks aren’t yet drenched in greed.
This chart reveals GDX’s mounting bull market over the past couple years. Gold stocks have achieved higher lows and higher highs on balance, carving an indisputable secular uptrend. From this sector’s last major bear-market low in late September 2022 to mid-July 2024, GDX has powered 79.6% higher. Yet this young bull remains super-small by sector standards, with much-larger gains coming as traders return.
Gold stocks are ultimately leveraged plays on the metal they mine, which overwhelmingly drives their profits and hence stock prices. GDX’s bull is mirroring gold’s underlying one over this same span, where the yellow metal climbed 51.9% at best. The major gold stocks have actually only amplified gold by 1.5x in this bull, still way under their usual 2x-to-3x range! Sector psychology has remained stubbornly bearish.
That resulted from a pair of crazy anomalies. First gold and especially gold stocks collapsed in mid-2022, as the Fed’s most-extreme hiking cycle in its history launched the US dollar stratospheric. That fueled excessive gold-stock bearishness taking longer than normal to work off. Second the US stock markets have been soaring in their latest AI bubble led by mega-cap tech, distracting traders from all other sectors.
But all that is changing, with gold enjoying a remarkable breakout to many new nominal records this year! Incidentally on that experience front, I predicted that in my early-January essay “Gold’s 2024 Breakout Upleg”. With gold still at $2,043, I concluded “gold’s breakout upleg into nominal record territory is set to accelerate in 2024. New records generate bullish financial-media coverage putting gold back on investors’ radars.”
Even American stock investors who have ignored gold’s entire upleg are starting to take notice as the AI stock bubble looks to be bursting. The combined gold-bullion holdings of the mighty American GLD and IAU gold ETFs grew 1.7% or 20.2 metric tons in July, their biggest monthly build since March 2022! Capital inflows into gold have grown as the flagship S&P 500 stock index pulled back 4.7% in seven trading days...
* * *
Read Full Story »»»
DiscoverGold
Get 2445 out of the way, it’s blue skies just above that.
3 Gold Stocks Surging as Prices Eye Record Highs
By: Schaeffer's Investment Research | July 31, 2024
• Interest rate expectations and Middle East conflict are driving gold prices higher
• GOLD is on track for a fourth-straight daily pop
Gold prices are on track for a record finish today, amid expectations of an interest rate cut in September as the Federal Reserve concludes its two-day policy meeting. Pus, the assassination of Hamas leader Ismail Haniyeh in Tehran, Iran is boosting demand for the safe-haven commodity.
Below, let's dig deeper into how Barrick Gold Corp (NYSE:GOLD), as well as lesser known Kinross Gold Corp (NYSE:KGC) and Harmony Gold Mining Company Ltd (NYSE:HMY) are reacting to today's headlines.
GOLD is up 1.1% to trade at $18.34 at last check, and pacing for its fourth-straight daily gain. The shares are bouncing off a pullback to the $17.60 level, after hitting their July 17, 52-week high of $19.45. Over the past nine months, Barrick Gold stock added more than 14%.
KGC was last seen up 1.9% to trade at $8.91, looking to close back above the 20-day moving average after a brief slip below this trendline. The equity is not too far removed from a July 17, three-year high of $9.41, and sports a 47.1% year-to-date lead to boot.
HMY is outpacing its peers, up 5.2% to trade at $9.56 at last check. The stock is back above the 40-day moving average, after gapping below it as it cooled off from a July 16, 12-year high of $11.04. During the last 12 months, Harmony Gold Mining stock added a whopping 134.6%.
Read Full Story »»»
DiscoverGold
Gold CoT: Peek Into Future Through Futures, How Hedge Funds Are Positioned
By: Hedgopia | July 27, 2024
• Following futures positions of non-commercials are as of July 23, 2024.
Gold: Currently net long 273.1k, down 12k.

Gold suffered its second negative week, down 0.75 percent this week to $2,381/ounce. Last week, it peaked at $2,488 on the 17th. Gold bugs, however, were unable to hang on to those gains; if they did, this would have been an important breakout.
Gold went sideways for three months before posting a new high followed by a reversal last week. On April 12th, it hit a new intraday high of $2,449 before selling off a tad. This was eclipsed on May 20th, as the yellow metal ticked $2,454 before once again coming under pressure. All along, bids showed up at $2,300, a breach of which will have shifted momentum to the bears.
Non-commercials are worth watching here. Last week (in the week to 16th), they were the most net long since March 2020. This week, they cut their holdings a tad. A break of $2,300 in the cash can lead these traders to begin to reduce their exposure.
Read Full Story »»»
DiscoverGold
NY Gold Futures »» Weekly Summary Analysis
By: Marty Armstrong | July 27, 2024
NY Gold Futures closed today at 23810 and is trading up about 14% for the year from last year's settlement of 20718. This price action here in July is reflecting that this is within the scope of a bearish reactionary move on the monthly level thus far. As we stand right now, this market has made a new high exceeding the previous month's high reaching thus far 24884 intraday and is still trading above that high of 24067.
Up to now, we still have only a 1 month reaction decline from the high established during May. We must exceed the 3 month mark in order to imply that a trend is developing.
ECONOMIC CONFIDENCE MODEL CORRELATION
Here in NY Gold Futures, we do find that this particular market has correlated with our Economic Confidence Model in the past. The Last turning point on the ECM cycle low to line up with this market was 2022 and 2015. The Last turning point on the ECM cycle high to line up with this market was 2020 and 2011 and 1996.
MARKET OVERVIEW
NEAR-TERM OUTLOOK
The NY Gold Futures has continued to make new historical highs over the course of the rally from 2015 moving into 2024. However, this last portion of the rally has taken place over 9 years from the last important low formed during 2015. Noticeably, we have elected four Bullish Reversals to date.
This market remains in a positive position on the weekly to yearly levels of our indicating models. Pay attention to the Monthly level for any serious change in long-term trend ahead.
Looking at the indicating ranges on the Daily level in the NY Gold Futures, this market remains neutral with resistance standing at 23892 and support forming below at 23795. The market is trading closer to the support level at this time. An opening below this level in the next session will imply a decline is unfolding.
On the weekly level, the last important high was established the week of July 15th at 24884, which was up 6 weeks from the low made back during the week of June 3rd. We have seen the market drop sharply for the past week penetrating the previous week's low and it closed beneath that low which was 23957. This was a very bearish technical indicator warning that we have a shift in the immediate trend. We are still trading neutral on the Weekly Momentum Indicators and this is a warning that initial support has been breached. This strongly implies we should pay close attention now to the Weekly Bearish Reversals. If we begin to elect Weekly Bearish Reversals, then we are dealing with a more sustainable near-term correction. When we look deeply into the underlying tone of this immediate market, we see it is currently still in a weak posture. Immediately, this decline from the last high established the week of July 15th has been important closing sharply lower as well. Before, this recent rally exceeded the previous high of 23826 made back during the week of June 17th. Nonetheless, that high was actually lower than the previous high made the week of May 20th suggesting this market has really been running out of sustainable buying for right now. This immediate decline has thus far held the previous low formed at 23042 made the week of June 3rd. Only a break of that low would signal a technical reversal of fortune and of course we must watch the Bearish Reversals. Right now, the market is neutral on our weekly Momentum Models warning we have overhead resistance forming and support in the general vacinity of 23274. Additional support is to be found at 23202. Looking at this from a wider perspective, this market has been trading up for the past 4 weeks overall.
INTERMEDIATE-TERM OUTLOOK
YEARLY MOMENTUM MODEL INDICATOR
Our Momentum Models are declining at this time with the previous high made 2020 while the last low formed on 2023. However, this market has rallied in price with the last cyclical high formed on 2023 and thus we have a divergence warning that this market is starting to run out of strength on the upside.
Critical support still underlies this market at 19950 and a break of that level on a monthly closing basis would warn that a sustainable decline ahead becomes possible. Nevertheless, the market is trading above last month's high showing some strength.
DiscoverGold
Gold Stocks’ Autumn Rally ‘24
By: Adam Hamilton | July 26, 2024
The gold miners’ stocks are enjoying a strong summer, recently surging to new bull highs. These upleg gains should continue mounting with gold’s autumn rally providing stiff tailwinds. Outsized Asian demand usually fuels seasonal gold gains into late September. Already large thanks to gold’s unique bullish backdrop, this year’s autumn rally has excellent potential to keep growing. Gold stocks will leverage its upside.
Seasonality is the tendency for prices to exhibit recurring patterns at certain times during the calendar year. While seasonality doesn’t drive price action, it quantifies annually-repeating behaviors driven by sentiment, technicals, and fundamentals. We humans are creatures of habit and herd, which naturally colors our trading decisions. The calendar year’s passage affects the timing and intensity of buying and selling.
Gold stocks display strong seasonality because their price action amplifies that of their dominant primary driver, gold. Gold’s seasonality generally isn’t driven by supply fluctuations like grown commodities see, as its mined supply remains relatively steady year-round. Instead gold’s major seasonality is demand-driven, with global investment demand varying considerably depending on the time in the calendar year.
This gold seasonality is fueled by well-known income-cycle and cultural drivers of outsized gold demand from around the world. Starting in late summers, Asian farmers begin to reap their harvests. As they figure out how much surplus income was generated from all their hard work during the growing season, they wisely plow some of their savings into gold. Asian harvest is followed by India’s famous wedding season.
Indians believe getting married during their autumn festivals is auspicious, increasing the likelihood of long, successful, happy, and even lucky marriages. And Indian parents outfit their brides with beautiful and intricate 22-karat gold jewelry, which they buy in vast quantities. That’s not only for adornment on their wedding days, but these dowries secure brides’ financial independence within their husbands’ families.
So during its bull-market years, gold has tended to enjoy sizable-to-strong autumn rallies driven by these sequential episodes of outsized demand. Naturally the gold stocks follow gold higher, amplifying its gains due to their profits leverage to the gold price. Today gold stocks are once again back at their most-bullish seasonal juncture, the transition between the typically-drifting summer doldrums and big autumn rallies.
Since it is gold’s own demand-driven seasonality that fuels gold stocks’ seasonality, that’s logically the best place to start to understand what’s likely coming. This old research thread focuses on modern bull-market seasonality, as bull and bear price action are quite different. Gold enjoyed an epic 638.2% bull run from April 2001 to August 2011, fueling gold stocks skyrocketing 1,664.4% per their leading HUI index then!
Following that secular juggernaut, gold consolidated high before starting correcting into 2012. But the yellow metal didn’t enter formal bear territory down 20%+ until April 2013. That beast mauled gold on and off over several years, so 2013 to 2015 are excluded from these seasonal averages. Gold finally regained bull status powering 20%+ higher in March 2016, then its modest gains grew to 96.2% by August 2020.
Another high consolidation emerged after that, where gold avoided relapsing into a new bear despite a serious correction. Later the yellow metal started powering higher again, coming within 0.5% of a new nominal record in early March 2022 after Russia invaded Ukraine. So 2016 to 2021 definitely proved bull years too, with 2022 really looking like one early on. Then Fed officials panicked, unleashing market chaos.
Inflation was raging out of control thanks to their extreme money printing. In just 25.5 months following March 2020’s pandemic-lockdown stock panic, the Fed ballooned its balance sheet an absurd 115.6%! That effectively more than doubled the US monetary base in just a couple years, injecting $4,807b of new dollars to start chasing and bidding up the prices on goods and services. That fueled an inflation super-spike.
With big inflation running rampant, Fed officials frantically executed the most-extreme tightening cycle in this central bank’s history. They hiked their federal-funds rate an astounding 450 basis points in just 10.6 months, while also selling monetized bonds through quantitative tightening! That ignited a huge parabolic US-dollar spike, unleashing massive gold-futures selling slamming gold 20.9% lower into late September 2022.
That was technically a new bear market, albeit barely and driven by an extraordinary anomaly that was unsustainable. Indeed gold soon rebounded sharply, exiting 2022 with a trivial 0.3% full-year loss. Gold kept on powering higher, reentering bull territory up 20.2% in early February 2023! So I’m also classifying 2022 as a bull year for seasonality research. Gold’s modern bull years include 2001 to 2012 and 2016 to 2023.
Prevailing gold prices varied radically across these secular spans, running just $257 when gold’s epic 2000s bull was born to July 2024’s latest record high of $2,465. That vast range of gold levels spread over all those long years has to first be rendered in like-percentage terms in order to make them perfectly comparable with each other. Then they can be averaged together to distill out gold’s bull-market seasonality.
That’s accomplished by individually indexing each calendar year’s gold price action to its final close of the preceding year, which is recast at 100. Then all gold price action of the following year is calculated off that common indexed baseline, normalizing all years. So gold trading at 110 simply means it has rallied 10% off the prior year’s close. Gold’s previous seasonality before 2023 was added is shown in light blue.
If investors understood gold’s phenomenal performance in recent decades, it would be far more popular with allocations included in every portfolio. Through 20 of these last 23 years, gold has enjoyed fantastic average calendar-year gains of 13.7%! And the great majority of that came before the Fed recklessly more than doubled the US money supply. With inflation raging since, everyone should have 5% to 10% in gold.
Seasonally gold enjoys three distinct rallies occurring in autumn, winter, and spring. Their average gains from 2001 to 2012 and 2016 to 2023 clocked in at 4.8%, 8.4%, and 3.5%. These autumn rallies tended to start marching higher in mid-June, after gold’s summer-doldrums bottoming. Then they typically powered higher on balance until hitting the upper resistance of gold’s seasonal uptrend around late September...
* * *
Read Full Story »»»
DiscoverGold
Gold price is right where they want it to be. And it ain’t going any higher….today anyhow. They used GDP to tamp it down more, all morning. It got clubbed like a baby seal. Don’t know if they closed out shorts yet or not
Gold price is right where they want it to be. And it ain’t going any higher….today anyhow. They used GDP to tamp it down more, all morning. It got clubbed like a baby seal. Don’t know if they closed out shorts yet or not
Newmont Corporation (NEM) Stock Tumbles as Oil Prices Soften
By: Schaeffer's Investment Research | July 25, 2024
• Newmont is brushing off upbeat second-quarter results
• The security attracted a price-target hike from BMO earlier
Newmont Corporation (NYSE:NEM) stock is down 3.5% to trade at $46.07 at last check, brushing off a second-quarter earnings and revenue beat as gold prices soften. The mining stock also drew a price-target hike to $57 from $56 at BMO earlier today, bringing its 12-month consensus target price to $53.35 -- a roughly 16% premium to current levels.
Today's pullback has the shares testing support from the 20-day moving average, after gapping below the trendline earlier in the session. The equity is pulling back from a July 17, 52-week high of $48.21, but still sports a more than 11% lead for 2024, with 33.6% amassed in the last six months.

Short-term options traders have been more bearish than usual. This is per the security's Schaeffer's put/call open interest ratio (SOIR) that stands in 82nd percentile of readings from the past year.
Its also worth noting that the stock's Schaeffer's Volatility Scorecard (SVS) ranks at 72 out of 100. This means the security outperformed volatility expectations in the past year.
Read Full Story »»»
DiscoverGold
Last post was 6/3/24 which was a buy signal on the monthly $GDX. Updated chart to today's trading. This buy signal should last into late next year; enjoy the ride.
By: Tim Ord | July 23, 2024
• Last post was 6/3/24 which was a buy signal on the monthly $GDX. Updated chart to today's trading. This buy signal should last into late next year; enjoy the ride.

Read Full Story »»»
DiscoverGold
since Biden took us far away from being Net exporter of oil or energy, and pretty much separated us from OPEC via many mistakes including sleeping in front of Saudi Royalty, the typical trend for oil will go up into labor day, but maybe beyond depending on what President OPEC wants in office. what does that have to do with Miners, well do some googling if u dont know, then when you think you know, come back and ask me, then u may get it.
Rising Production, Earnings Have Agnico Eagle Striking Gold
By: Lucas Downey | July 23, 2024
• Gold has been on fire recently, and Canadian gold miner Agnico Eagle Mines Limited (AEM) has been along for the ride.
Based in Toronto, AEM’s business is the exploration, development, and production of precious metals. It has mines in Canada, Australia, Finland, and Mexico, with exploration and development activities focused on Canada, Australia, Europe, Latin America, and the U.S. The company’s facilities are in some of the best gold producing areas in the world.
Its first-quarter gold production grew 8.1% from a year prior, resulting in increased net income (to $337.5 million) and larger per-share earnings of $0.76. Also, AEM continues to control its debt, investment discipline, and costs, which translated to $395.6 million in free cash flow, up 49.4% from the previous year. The company’s current dividend yield is nearly 2.2%.
It’s no wonder AEM shares are up 36% this year – and they could rise more. MAPsignals data shows how Big Money investors are betting heavily on the forward picture of the stock.
Big Money Loving Agnico Eagle Shares
Institutional volumes reveal plenty. Recently, AEM has enjoyed strong investor demand, which we believe to be institutional support.
Each green bar signals unusually large volumes in AEM shares. They reflect our proprietary inflow signal, pushing the stock higher:

Source: www.mapsignals.com
Plenty of materials names are under accumulation right now. But there’s a powerful fundamental story happening with Agnico Eagle.
Agnico Eagle Fundamental Analysis
Institutional support and a healthy fundamental backdrop make this company worth investigating. As you can see, AEM has had strong sales and earnings growth:
• 3-year sales growth rate (+29.1%)
• 3-year earnings growth rate (+44.4%)
Source: FactSet
Also, EPS is estimated to ramp higher this year by +13.3%.
Now it makes sense why the stock has been powering to new heights. AEM has a track record of strong financial performance.
Marrying great fundamentals with our proprietary software has found some big winning stocks over the long term.
Agnico Eagle has been a top-rated stock at MAPsignals. That means the stock has unusual buy pressure and growing fundamentals. We have a ranking process that showcases stocks like this on a weekly basis.
It’s made the rare Top 20 report multiple times in the last year. The blue bars below show when AEM was a top pick…generating value along the way:

Source: www.mapsignals.com
Tracking unusual volumes reveals the power of money flows.
This is a trait that most outlier stocks exhibit…the best of the best. Big Money demand drives stocks upward.
Agnico Eagle Price Prediction
The AEM rally isn’t new at all. Big Money buying in the shares is signaling to take notice. Given the historical gains in share price and strong fundamentals, this stock could be worth a spot in a diversified portfolio.
Read Full Story »»»
DiscoverGold
Huge gold buying again today. something is up, something i have never seen before.
|
Followers
|
148
|
Posters
|
|
|
Posts (Today)
|
0
|
Posts (Total)
|
5650
|
|
Created
|
06/29/08
|
Type
|
Free
|
| Moderators DiscoverGold trunkmonk | |||

http://www.vaneck.com/index.cfm?cat=3192&tkr=GDX&LN=3-02
The Gold Miners ETF seeks to replicate as closely as possible, before fees and expenses, the price and yield performance of the NYSE Arca Gold Miners Index. The Index provides exposure to publicly traded companies worldwide involved primarily in the mining for gold, representing a diversified blend of small-, mid- and large-capitalization stocks. As such, the Fund is subject to the risks of investing in this sector.
| ||||||||||||||||||||||||||||||||||||||||||||||||||||||||||||||||||||||||||||||||||||||||||||||||||||||
| DAILY |
| WEEKLY |
| Volume | |
| Day Range: | |
| Bid Price | |
| Ask Price | |
| Last Trade Time: |

