 News
News  Market Data
  Discover
Support: 888-992-3836
Copyright © 2023 InvestorsHub Inc.


Bob-C
![]()
Register for free to join our community of investors and share your ideas. You will also get access to streaming quotes, interactive charts, trades, portfolio, live options flow and more tools.
Register for free to join our community of investors and share your ideas. You will also get access to streaming quotes, interactive charts, trades, portfolio, live options flow and more tools.
Hi Rich, great to hear from you. :)
Here is the SLV daily accumulation chart:

Here is the SLV weekly accumulation chart:

Both the daily and weekly SLV charts have excellent rising Accum/Dist, OBV, and CMF.
Here is the SLV daily TL chart depicting a parabolic rise:

Here is the SLV weekly TL chart:
Here is the SLV monthly TL chart:

Here is the SLV TL daily futures chart:

Here is the SLV TL futures weekly chart:

Here is the SLV monthly TL futures chart:

Good luck on all of your trades.
Have a great weekend and a profitable trading week ahead.
Bob
Hi everyone, here is the B6U16 daily GBP TL futures chart:

Here is the B6U16 weekly TL futures chart:

Here is the B6U16 monthly TL futures chart:

Cheers, :)
Bob-C
Hi everyone, here is the ISBG 2-year weekly chart:

GLTA.
Cheers, :)
Bob-C
Hi everyone, here is the ISBG 2-year weekly chart:
Cheers, :)
Bob-C
You're welcome BoilerRoom. :)
Good luck on all of your trades and investments.
Have a great day.
Bob
Hi Rich, it's good to hear from you.:)
Here is the BONT weekly accumulation chart:

Here is the BONT daily accumulation chart:

The daily and weekly BONT charts are turning down.
I wish you and yours a happy and healthy new year.
Regards,
Bob
Hi everyone, here is the USO daily chart:

Here is the USO weekly chart:

Here is the USO daily TL chart:

Here is the USO weekly TL chart:

Cheers,
Bob-C
Hi everyone, IMHO, QQQs are headed sharply lower...
Here is the QQQ daily TL chart:

Here is the QQQ weekly TL chart:

Here is the QQQ monthly TL chart:

Here is the QQQ Heikin-Ashi daily chart depicting a SAR sell signal:

Here is the QQQ weekly Heikin-Ashi chart depicting a SAR sell signal:

Here is the QQQ daily Renko chart depicting a SAR sell signal:

Here is the QQQ daily chart:

Here is the QQQ weekly chart:

Here is the QQQ daily Ichimoku chart depicting a SAR sell signal:

here is the QQQ weekly Ichimoku chart depicting a SAR sell signal:

Cheers, :)
Bob-C
Hi everyone, IMHO, AAPL is headed sharply lower...
Here is the AAPL daily TL chart:

Here is the AAPL weekly TL chart:

Here is the AAPL monthly TL chart:

Here is the AAPL Heikin-Ashi daily chart depicting a SAR sell signal:

Here is the AAPL weekly Heikin-Ashi chart depicting a SAR sell signal:

Here is the AAPL daily Renko chart depicting a SAR sell signal:

Here is the AAPL daily chart:

Here is the AAPL weekly chart:

Here is the AAPL daily Ichimoku chart depicting a SAR sell signal:

here is the AAPL weekly Ichimoku chart depicting a SAR sell signal:

Cheers, :)
Bob-C
Hi everyone, the NYSE looks headed sharply lower...
Here is the NYSE daily Ichimoku chart:
here is the NYSE weekly Ichimoku chart:
Cheers,
Bob-C
Hi trading jeff, good to hear from you.
Thanks very much for the information. 
Here is the URL for the bigcharts.com LVGI daily accumulation and
OBV chart:
http://bigcharts.marketwatch.com/advchart/frames/frames.asp?show=&insttype=Stock&symb=lvgi&time=6&startdate=1%2F4%2F1999&enddate=6%2F19%2F2014&freq=1&compidx=aaaaa%3A0&comptemptext=&comp=none&ma=4&maval=9&uf=8&lf=268435456&lf2=512&lf3=8&type=4&style=330&size=4&timeFrameToggle=false&compareToToggle=false&indicatorsToggle=false&chartStyleToggle=false&state=15&x=38&y=11
Good luck on all of your trades.
Best,
Bob
Hi inthesky, thanks for your reply.
Good luck on your trades.
Best,
Bob
Hi everyone, does anyone know why the LVGI chart on the intro no longer shows? Has there been a name change or news for LVGI to explain why LVGI no longer appears on stockcharts.com?
Good Luck To All.
Cheers,
Bob-C
IMHO, the QQQs are headed lower in-the VST...
Hi everyone, here is the QQQ daily chart:

Here is the QQQ weekly chart:

here is the QQQ daily TL chart:

Here is the QQQ weekly TL chart:

Here is the QQQ monthly TL chart:

Here is the QQQ daily TL chart:
Cheers, :)
Bob-C
IMHO, the QQQs are headed sharply lower in-the-VST...
Hi everyone, here is the QQQ daily TL chart:
Here is the QQQ weekly TL chart:
Here is the QQQ monthly TL chart:
Here is the QQQ daily TL chart:
Cheers, :)
Bob-C
IMHO, the QQQs, AAPL, SPX, and the-RUT-are-headed-sharply-lower...
Hi everyone, here is the QQQ daily TL chart:

Here is the AAPL daily TL chart:

Here is the SPX daily TL chart:

Here is the RUT daily TL chart:

I'm still holding my QQQ puts.
Cheers, :)
Bob-C
Structures and artifacts on Pluto's largest moon Charon...
Hi everyone, my processed image was obtained from the NASA Photojournal tif PIA19709.tif 2.502MB image. The image credit and image addition date are:
Image Credit: NASA/Johns Hopkins University Applied Physics Laboratory/Southwest Research Institute
Image Addition Date: 2015-07-15
NASA's title for the image is:
"PIA19709: Charon's Surprising Youthful and Varied Terrain."
Here is the URL for both of the NASA Photojournal PIA19709 TIF and JPG images of Charon:
http://photojournal.jpl.nasa.gov/catalog/PIA19709
NASA states that: "Remarkable new details of Pluto's largest moon Charon are revealed in this image from New Horizons' Long Range Reconnaissance Imager (LORRI), taken late on July 13, 2015 from a distance of 289,000 miles (466,000 kilometers)."
Here is my processed cropped image of Pluto's largest moon Charon:
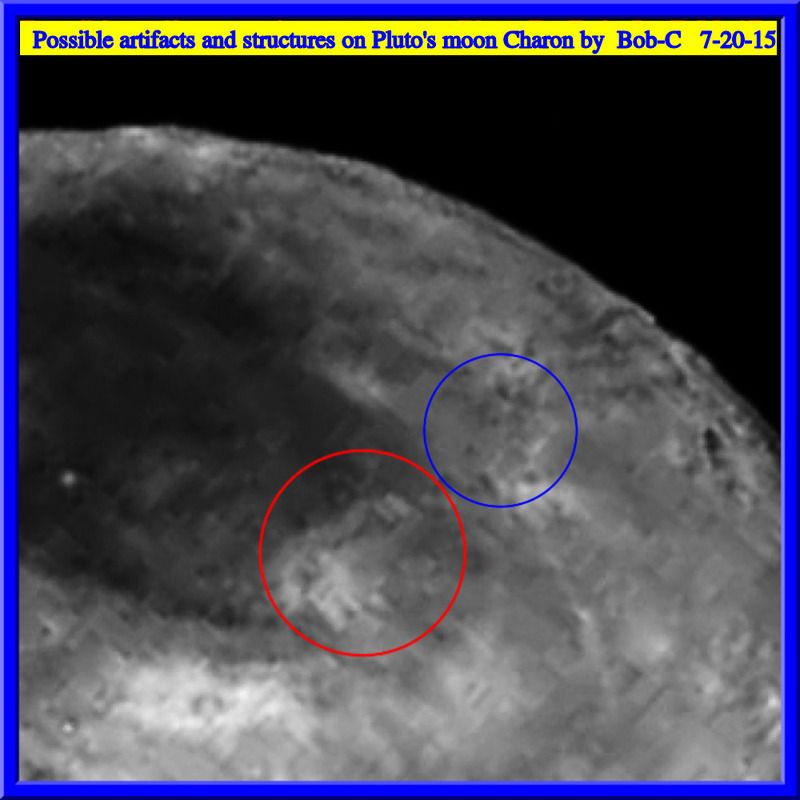
The red circle depicts a possible structure at the 8 o'clock position. The structure has a triangular/pyramidal shape that faces upward to the northeast. There appear to be 2 possible structures/buildings located at the 1 o'clock position in the red circle. These structures/artifacts are rectangular in shape. On the left side of the image straight across from the triangular structure are additional possible structures/artifacts of a tubular shape with one long tubular/rectangular structure that intersects at right angles with 2 other tubular/rectangular structures.
The blue circle depicts a large rectangular structure at the 5 o'clock position that appears to have 4 walls and the top of the structure appears to have either caved in or been destroyed or blown away. There appears to be a possible structure/building located at the 1 0'clock position in the blue circle. This structure/building appears to have openings/windows on both the top/roof, right side, and front of the structure/building.
Cheers, :)
Bob-C
Hi everyone, here is the QQQ daily chart:

Here is the QQQ weekly chart:

Here is the QQQ daily TL chart:

Here is the QQQ weekly TL chart:

I have QQQ puts.
Cheers, :)
Bob-C
Hi everyone, here is the AAPL daily chart:

Here is the AAPL weekly chart:

Here is the AAPL daily TL chart:

Here is the AAPL weekly TL chart:

Cheers, :)
Bob-C
Hiya highstakes, great to hear from you.
I wish you good luck and the best of success on all your investments and trades.
Keep up your good work.
Have a great day.
Bob
Hi everyone, here are the-QQQ-and-AAPL-daily-and-weekly TL charts:
Here is the AAPL daily TL chart:

Here is the AAPL weekly TL chart:

Here is the QQQ daily TL chart:

Here is the QQQ weekly TL chart:

I have QQQ puts.
Cheers, :)
Bob-C
Hi everyone, here is the AAPL daily TL chart:
Here is the AAPL weekly TL chart:
Here is the QQQ daily TL chart:
Here is the QQQ weekly TL chart:
I have AAPL and QQQ puts.
Cheers, :)
Bob-C
Hi everyone, here is the SPX daily TL chart:

Here is the SPX weekly TL chart:

Here is the VIX daily TL chart:

Here is the VIX weekly TL chart:

Cheers, :)
Bob-C
Hi everyone, here-is-the LVGI daily-accumulation-chart:

Here is the LVGI weekly accumulation chart:

Cheers, :)
Bob-C
Hi everyone, here-is-the MINE daily-accumulation-chart:

Here is the MINE weekly accumulation chart:

Cheers, :)
Bob-C
Hi Blue, here-is-the MINE daily-accumulation-chart:
Here is the MINE weekly accumulation chart:
Cheers, :)
Bob-C
Hi everyone, here-is-the MINE daily-accumulation-chart:
Here is the MINE weekly accumulation chart:
Cheers, :)
Bob-C
Hi everyone, here is the MINE daily accumulation chart:
Here is the MINE weekly accumulation chart:
Cheers, :)
Bob-C
Hi everyone here is the AAPL daily Renko chart depicting a SAR sell signal:

Here is the AAPL daily Heikin-Ashi chart depicting a SAR sell signal:

Here is the AAPL daily Ichimoku chart depicting a SAR sell signal:

Here is the AAPL weekly Ichimoku chart depicting a SAR buy signal:

Here is the AAPL daily TL chart:
Here is the AAPL weekly TL chart:
Here is the AAPL monthly TL chart depicting a bearing-engulfing-body candlestick for December:
Cheers, :)
Bob-C
Hi everyone, here is the VIX weekly chart:

Here is the VIX daily chart:

Cheers,
Bob-C
Hi everyone, here is the AAPL daily chart:

Here is the AAPL weekly chart:

Here is the AAPL daily TL chart:

I'm holding AAPL puts. :)
GLTA.
Cheers, :)
Bob-C
Hi everyone, here is the QQQ daily chart:

Here is the QQQ weekly chart:

Here is the QQQ daily TL chart:

I'm holding QQQ puts. :)
GLTA.
Cheers, :)
Bob-C
You're very welcome highstakes. :)
Good luck on all of your trades.
Have a happy and profitable day and week.
Best,
Bob
You're very welcome highstakes. :)
Good luck on all of your trades.
Have a happy and profitable day and week.
Best,
Bob
Hi everyone, here is the QQQ weekly chart:

Here is the QQQ daily chart:

I'm holding QQQ puts. :)
Cheers,
Bob-C
Hi everyone, here is the AAPL weekly chart:

Here is the AAPL daily chart with 50 and 200 DMAs:

Here is the AAPL daily TL chart:

Here is the AAPL weekly TL chart:

Here is the AAPL monthly TL chart:

I'm holding AAPL puts.
GLTA.
Cheers,
Bob-C
You're welcome highstakes.
Happy Thanksgiving to you and yours.
Best,
Bob
Hi Blue, here is-the-daily LVGI accumulation chart:

Here is the weekly LVGI accumulation chart:

GLTA.
Cheers, :)
Bob-C

