News
News  Market Data
  Discover
Support: 888-992-3836
Copyright © 2023 InvestorsHub Inc.


POKERSAM
![]()
Register for free to join our community of investors and share your ideas. You will also get access to streaming quotes, interactive charts, trades, portfolio, live options flow and more tools.
Register for free to join our community of investors and share your ideas. You will also get access to streaming quotes, interactive charts, trades, portfolio, live options flow and more tools.
This is a wave 2 that has overstayed its welcome. It is rare that they last this long or take a flat pattern. It has retraced wave 1 into the zone of 50% to 61.8% which is hit by twos 73% of the time.
With its end, which may have just happened, we will see a dramatic decline in wave 3 with a target near 3160.
Monday's fifth wave of 1 down doesn't look like it has truncation on its mind.
Futures down 57 at present.
Nice bounce coming when its over.
You can find all targets and direction for the waves to come by joining me in the Trading Pit Forum.
Click the link in the header.
Try it for a month and if it is not for you simply cancel. EWP is not for everyone. What about you?
You will not know till you try.
From: POKERSAM 4/2/2021 2:18:32 PM
986
of 986
I just posted six charts in the Trading Pit Forum covering from 1871 up to today. These Elliott Wave charts range from yearly to one minute. They reveal exactly where we are in the Long, Intermediate, and Short term progression. High odds predictions of future market moves are arrived at using the very latest in the understanding and application of the Elliott Wave Principle. Statistical analysis of all wave ratios are employed to improve the accuracy of predictions as to wave length and duration.
From these charts, it is easy to extrapolate where and when the next small, large, and very large corrections are due to occur with a greater measure of accuracy.
There is no reason for anyone to trade in the dark without a real clue as to what the market will do next.
From short term to long term my charts and projections based on Elliott Wave Principle have proved to be extremely accurate. Only those who cannot time the market say that no one can time the market.
For information go to: http://indexinsight.com/
One of my subs said this past week: "It’s always nice to know what the market is going to do before it does it. When it opened where it did today, the count was much more apparent. Thanks for all of your help!"
I hope you are enjoying the markets as much as I am. Of course, it is always enjoyable when you are making money. It doesn't matter if the market is going up or down as long as the market moves are large enough in your favorite time frame to make a good profit.
If you have been missing too many opportunities maybe it is time you tried something different. In my forum I post an average of ten charts every trading day. I provide play by play commentary and answer questions during trading hours. For complete information about my service visit:
http://indexinsight.com/
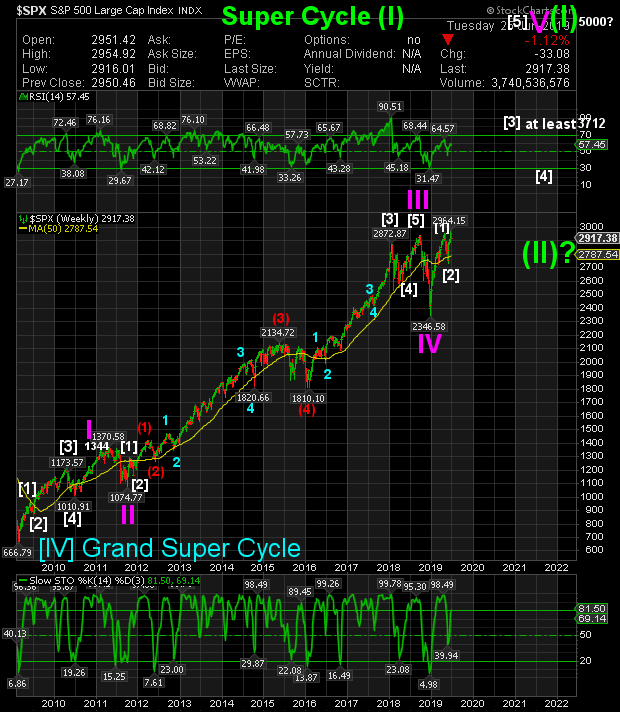
The decline from 3393 to 2191 turned out to be all of Super Cycle (II).
It was shorter than the average two.
We are now going higher in Primary [3] of Super Cycle (III).
The target for (III) is at least 4000.
For all of the dips, blips and up to the minute calls go to http://indexinsight.com/ for information.
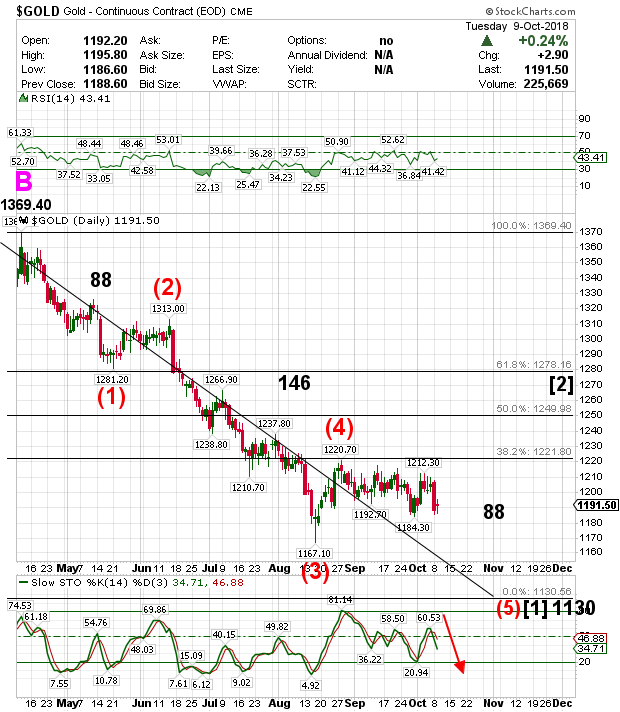
Nice C of (4). As expected (4) is an expanded flat. The most common pattern for a four is a flat. The most common flat is an expanded flat.
It is not complete yet. The C wave will be five waves when complete and will go lower than the end of A.
Up to the minute charts and commentary can be found in the Trading Pit Forum. http://www.indexinsight.com/
Can you believe it? An idiot is saying I have been suspended on Ihub for the past 6 months. Of course that is not true. The poster must be suffering from PDS. LOL
We are about to put in the C wave down of an expanded flat wave (4).
Wave (3) began at 2855.94 and ended at 3337.77.
When this correction is complete we go on to new all time highs in (5).
For up to the minute charts and commentary for all time frames
go here for information about the Trading Pit. http://indexinsight.com/
The Weekly Tuesday Night EWP Update. The charts reveal the fact that the Intermediate and Long term trend is still up.
What is not shown on these charts is how we have taken advantage of many short term trading opportunities over the past week.
For up to the minute charts in all time frames, you are invited to join me in my Trading Pit Forum where I post up to ten charts throughout the trading day.
http://www.indexinsight.com/ For information

On Tues. evening I will post a weekly update with charts. For up to the minute charts in all time frames, you are invited to join me in my Trading Pit Forum where I post up to ten charts throughout the trading day.
http://www.indexinsight.com/

I will post a Weekly Update with charts on Tuesday evening for the fore seeable future.
We are near a fork in the road. One is bullish and the other bearish. Up till now they have been in sync and both counts viable down from 2940. That will change in the next couple of moves.
Charts can be seen in my forum.
This is the Bearish count for SPX.
2940 was top of (I)
2346.58 up to 2724.99 is A of (2) may be complete?.
Then B of (2) down. Probably 38.2% to 50% retrace of (1) which is 2800,16 down to 2346.58.
Then C of (2) up. From the end of B up to somewhere near 2725+ Not beyond 2800.18
Then down near 735 points in (3) of [3].
In the Bull count for SPX
From (I) top of 2940 down to 2346.58 is an ABC wave (II).
Then we went up in (1) from 2346.58 to 2724.99 and it may be complete?
Now we go down in ABC of (2) retracing 50%-61.8% of (1).
Then we go up in intermediate (3) of Primary [1] of cycle I of super cycle (III). Heights few have thought of.
this bull market will have usual corrections to play the short side but the Long Term Trend will be up.
Sorry for the delay. I do not check in here as often as I should.
You can learn all about my private forum here.
http://indexinsight.com/
If you have questions feel free to email me.
You will see my email at the above link.
the range has opened up to 2340 to 2520. There is the possibility we go to bottom of range to top of range two more times.
We are in a 100 point range 2400 to 2500. This is the last throws of 3 of (3) off the top at 2940. We will now go up to 2500 then down to 2400 then up to 2500 then down to about 2325 to end 3.
targets are approx.
Slight change to my count. I dropped the degree one notch on the decline from 2940. We are now in 3 of (3) which began at 2800.
Decline has a long way to go to reach Cycle A of this bear market.
See header for information on one week free trial to my forum.
(2) of [3] complete at 2736. Now we go down in (3) of [3].
It does not get any more bearish than this.
Targets for (3) and [3] are found in the forum.
spartex - Here is what I said, "We have dropped in wave [1] and bounced in [2] off the 2940 top."
[3] will drop 370 from the top of [2]. Top of [2] was 2716.94.
We have dropped in wave [1] and bounced in [2] off the 2940 top. Wave [3] down will be 370 points from the top of [2]. [3] will go down in 5 waves. It will be fast and furious. See you near 2446.
We have dropped in wave [1] and bounced in [2] off the 2940 top. Wave [3] down will be 370 points from the top of [2]. [3] will go down in in 5 waves. It will be fast and furious. See you near 2446.
Again wave [2] gives every indication it is finally over.
Target for [3] is 370 points down from top of two.
Currently that is 2446.46.
[3] will be five waves down.
Join me in the forum to count it down.
see header
[2] continued today with a (C) wave. [2] could be over at today's close or run for another 12+points. That is how far short of the most common wave two range we are. Tomorrow will tell the tale of the two.
[3] down will run 373 points down from the end of [2].
You do not want to be anything but short for that ride. It will happen in five Intermediate waves. It will provide active traders with a picnic.
Bulls will be slaughtered.
It looks like [2] is complete at 2775. It is down from here in [3].
I hope everyone who reads this thread got a good piece of today. WOW

As I mentioned yesterday the bear is in control. 2940 was likely the top for Super Cycle (I) and we are in Super Cycle (II) with a first target for completion at 1810.
There will be swing trades up as we go down of course. To follow the move on all time frames join me in the Trading Pit forum.
See info in the header.
For long term updated chart: http://indexinsight.com
we reached an inflection point today where the bear and the bull waged battle. It looks like the bear won. Down from here. JMHO
Let's refine that to 3014.
Next target for possible top is now 3000. Longs are safe to there. Top can only occur at the end of a five wave impulse or ending diagonal.
We are at the end of the fifth Cycle wave off the 666 low. Only Intermediate degree wave (5) left to complete. Doubt it can happen till 3000.
No top till wave structure allows it.
Double Top - A top for the 666 bull is only possible at the end of a five wave up. We are near the end of the large degree fifth wave. All that is left is the small degree waves that have to complete to end the bull market with a correction down to 1810. Now a drop of 1100 points. There are targets all along this drop. You should realize this because you have read my posts long enough. The ultimate target for the correction is still 1810 and always has been.
When a top to the bull market is possible I let you know. You do not seem to appreciate it.
Right now there are two scenarios with two different targets for the top. One of them will in all probability play out. Tops occur when all the news is good and sentiment is high. They give no warning and happen when least expected by the herd. Go back and look at the 2872 top of wave(3) of [5]. I warned of that top on the day it
occurred but no one else did. It was sudden and it was a surprise.
It was also possible that it was the end of the 666 2009 bull.
Sometimes there is only one count possible but many times there will be two that are possible. That is the case now but you have no interest.
Please refrain from posting to me if all you have to say is a complaint. Questions I usually answer but complaining about a free post of my opinion is unacceptable.
Take care and best of luck to you.
The only addition I would make is that the ending diagonal [5] is moving higher with new target of about 2910.
Well, a lot has happened since my last post.
From 666 We went up in five cycle waves. In the fifth cycle wave we completed Primary [3] at 2872 and [4] at 2553, from there we finished an Ending Diagonal five [5] at 2873. This completed five cycle waves in Super Cycle (I).
We are now going down in Super Cycle (II) with a first target of 1810. SC (II) will consist of an ABC of cycle degree.
I can just repeat my last post. 2848 looks like the top of [2].
Enjoy!
DT - No doubt we are getting down to where the rubber meets the road. The most popular scenario is that we are coming out of a wave four correction and going to new ATH in a wave five.
There are things to commend this view.
There is another view had by a few who see five waves completed from 666 to 2872. IMO that five waves was Super Cycle wave (I).
We are now in Primary wave [3] down of Cycle A of Super Cycle (II).
Wave [3] should go 453 points down.
You are a lot like me, very modest. lol
That was just abut a quadruple top.
OK now we can go down in [3] @2338 min.
I think you are just looking for a double top, DoubleTop. lol
You are right it could happen. I actually hope it does.
Thanks
No, It will take longer than that. Look for up from here to 2801 to 2816 for the top then it is down 453 points. This will take a good while.
Just in case we do not get these last points up, if we drop below 2760 the big decline is on.
I am now looking for 453 S&P points decline in a Primary wave [3]. Decline can begin anytime in next 20 points or so to the upside.
Just felt an obligation to tell you.