 News
News  Market Data
  Discover
Support: 888-992-3836
Copyright © 2023 InvestorsHub Inc.


mrnatural
![]()
Register for free to join our community of investors and share your ideas. You will also get access to streaming quotes, interactive charts, trades, portfolio, live options flow and more tools.
Register for free to join our community of investors and share your ideas. You will also get access to streaming quotes, interactive charts, trades, portfolio, live options flow and more tools.
This looks like a good deal to me...you will need to pick out a monitor to go with it. Bought one for my mother she loves it.
http://www.buy.com/prod/hp-pavilion-s3620f-slimline-desktop-intel-pentium-dual-core-e5200-2/q/loc/101/211401834.html
Also if using the mozilla firefox browser; you can hit control and the plus key to increase font size.
Hi Foot, I just clicked the link from within the post...it worked fine (I'm using Firefox).
My only suggestion...if using firefox, right click the link and select open in IE tab?
Or google it?
Not evil just wrong...The movie Al Gore doesn't want you to see!
http://www.noteviljustwrong.com/
Fabian, careful your hubris may jinx us.
HGE, I agree with your statement, but must admit I'm leery of trusting it during op/ex.
Its breaking down at the moment, without the market breaking out.
http://stockcharts.com/c-sc/sc?s=$VIX&p=60&yr=0&mn=2&dy=0&i=p59696412837&a=148622850&r=8835
Here's the chart example...
http://stockcharts.com/h-sc/ui?s=$SPX&p=D&yr=0&mn=11&dy=0&id=p96014238402&listNum=7&a=181068209
Big Fly try this in the parameters box 10,5
Very interesting, that definitely brings it into perspective.
(scroll down for chart)
JLS, thank you for the constructive and enlightening input.
The system was submitted “AS IS”; if no one is interested in the system that’s OK, its not important to me.
You are right, for the trader who is new to trading and T/A, I can see how it may seem like a complex system. From my perspective its not complex. I’ve been using it for several years and I’m comfortable with it. For now I like it the way it is; as time goes on I may look for ways to simplify it.
Thanks for the info regarding the ATR indicator; I’ve never paid much attention to it before, but I can now see how it can be a useful tool.
Thank you and good luck with your trading!
Greg
The recipe for perpetual ignorance is: be satisfied with your opinions and content with your knowledge.
Elbert Hubbard (1856 - 1915)
Trend, lets just use the system I described in this post -
http://investorshub.advfn.com/boards/read_msg.aspx?message_id=42425553
I don't mind criticism as long as its not done in a condescending tone.
Respectfully,
Greg
Trend, the charts used in that post are found on page 1, I only mentioned my public chart page because I'm not sure if the 60 min. time frame charts will render correctly on Ihub for non-subscribers.
Can anyone verify that for me?
Also I never intended for the LQD:TLT ratio chart to be used as a trading system.
If that violates the board rules I apologize.
Greg
JLS, as I mentioned in previous postings I just recently added that chart to my public list and I'm still evaluating its usefulness. I also mentioned that it should probably be best used as a tool to help determine trend changes.
Lets watch it for a while and see what develops.
As you mentioned it may only be useful during strong trends.
No worries!
Greg
PS, I'm still digesting your last post, Thanks!
SPX&RUT 60 min trade system rules.
Indicators -
- 7 ema, 14 sma, and 7,5 sma.
- Aroon14 with %B overlayed.
- Slope 14 with a 7 sma.
- SPX:VIX ratio with 7,5 sma
Trade is triggered when price crosses the 7,5 sma and 2 of the indicators confirm.
Confirming indicators listed in order of importance.
1. slope crossover 7 sma.
2. SPX:VIX ratio crossover 7,5sma.
3. 7 ema crossover 14 sma.
4. Aroon crossover 0 line.
There are exceptions, such as when markets are in a tight trading range you may want to wait for all 4 indicators to confirm.
Use stops wide enough to allow for normal volatility and tighten them up when indicators become extreme overbought or oversold, settings stops can be tricky you will eventually get a feel for it. If not sure then use the 7,5 sma for your stop levels.
If a sell signal comes before a stop is hit, go with the signal!
See charts below -
For non SC subscribers if the charts do not render properly you can also see them on my public chart page. link can be found in my profile.
JLS, thanks for sharing your system, you have given me some ideas that I can use to improve my own system.
I also use trailing stops to protect profits, and usually set my stops based on obvious resistance or support areas.
When you have time could you elaborate on how you use ATR for setting stop values?
I suspect most of the people on these boards do not have a disciplined rules based system for trading.
Greg
Stockscores showing overbought...we could still go up a few more days while the indicator rolls over?
First chart is SPY, 2nd BGU, then TNA. (scroll down)
TY, Dan
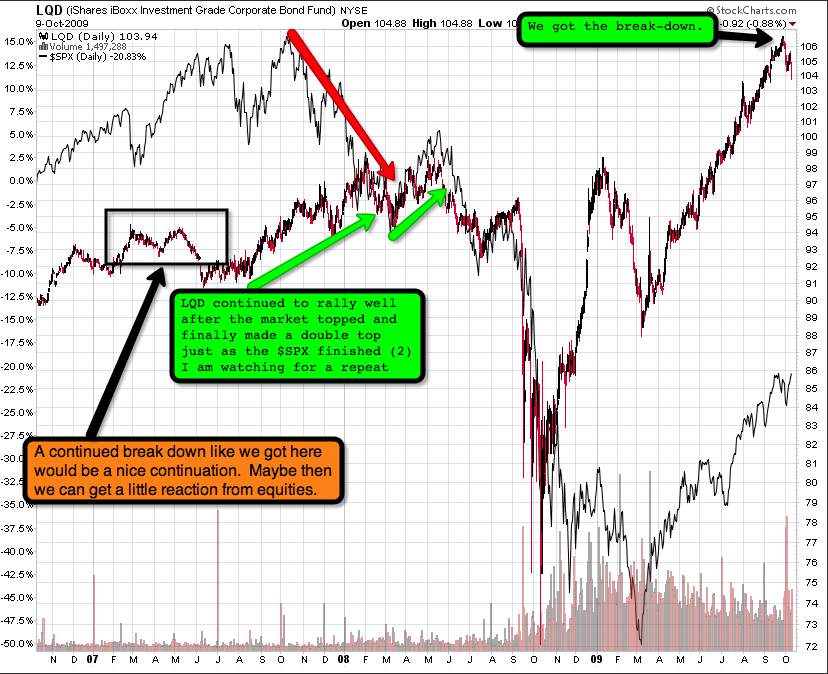
JLS, here is some commentary and a chart from Evilspeculator.
"We have all been watching LQD. We finally got a break-down, but we need to see it continue before equities are likely to give a reaction. Notice how at the 2007 peak, LQD had a nice break-down first, but then continued to rally well after the market was plummeting. At this point I am curious if we will see a repeat performance, I am thinking we will."
http://evilspeculator.com/?p=11766
scroll down for chart
As with most trend following systems its always going to be subject to some occasional whiplash.
I don't know if the LQD:TLT chart should be used as a stand alone system but rather as a tool to help determine trends and reversals.
Perhaps this chart will be a little more user friendly?
http://stockcharts.com/c-sc/sc?s=LQD:TLT&p=D&yr=0&mn=11&dy=0&i=p81683991424&a=180502848&r=9344
Yes they should autoupdate.
Or better yet, change the ratio to LQD:TLT? then put SPX in the indicator pane below the chart.
Trend, its a sell on the ratio, the ratio is inverted in relation to the SPX, (see SPX overlaid on the chart) I lowered the opacity.
A sell on the ratio translates to buy on the SPX.
For clarity maybe I should switch those around and overlay the ratio on the SPX chart?
Thanks Trend, the slope 14, aroon 14, and 7,5 SMA have become my primary indicators, I don't know why they are not more popular among traders.
I hope you will keep the conspiracy and manipulation nuts from trashing this board.
You can always tell which traders are losing their ass, when they complain about market manipulation and conspiracy's.
No doubt some of that goes on, but anybody using a simple trend following system should be making money.
Greg
JLS, this TLT:LQD ratio chart is giving a buy signal for SPX, it suggests that money is flowing from corporate bonds to equities.
I just discovered this ratio chart recently and I'm still evaluating its usefulness. (Chart can also be found on my public list) Click the link then click chart to enlarge.
http://stockcharts.com/c-sc/sc?s=TLT:LQD&p=D&yr=0&mn=11&dy=0&i=p19830488841&a=178179919&r=7276
Still holding long SPX and RUT via BGU & TNA.
VIX trying to break support at 24
http://stockcharts.com/def/servlet/Favorites.CServlet?obj=ID1036600
euterpe, thought you might find this interesting, he has some comments/insight regarding the similarities to the June July setup you pointed out in your post.
http://portfoliotilt.com/Technical-Analysis/Market-Indices/a-look-at-thursdays-potential-breakaway-gap.html
Jim, my old 18 week cycle chart is also showing the last week of October +/- week...
http://stockcharts.com/c-sc/sc?s=$NDX&p=W&yr=4&mn=0&dy=0&i=p60852244144&a=87310615&r=5763
PT, I agree 23 does appear to be an important level of support.
I have found that its more important to pay attention to the direction of the VIX rather than its absolute level. At least that works best for the time frames I'm playing.
Greg
Hi euterpe, I've been playing the 60 min. chart setups, so I usually don't look ahead more than a day or 2.
My daily SPX chart has triggered a buy signal today, but with earnings season upon us anything can happen.
Short term my 60 min. VIX has found some support (intraday) at 24 so a top may be in for today, keep an eye on the VIX for clues.
http://stockcharts.com/c-sc/sc?s=$VIX&p=60&yr=0&mn=2&dy=0&i=p82281274288&a=148622850&r=3122
Greg
beachcomber, what browser are you using?
With firefox right click the link and select open in IE tab. That often does the trick for me.
Hi PT, 60 min. $VIX & $RVX still falling = Bullish. (Short Term)
Ted, Right on...tune out the noise.
I've been making money with these 60 min. charts.
Are these charts showing up for the non subscribers to stockcharts? If not they can also be seen here on page 1.
Click link then click chart to enlarge
http://stockcharts.com/c-sc/sc?s=$SPX&p=60&yr=0&mn=2&dy=0&i=p23619141972&a=145757603&r=3794
http://stockcharts.com/c-sc/sc?s=$RUT&p=60&yr=0&mn=2&dy=0&i=p51557607782&a=168458720&r=3101
http://stockcharts.com/c-sc/sc?s=$VIX&p=60&yr=0&mn=2&dy=0&i=p96791494531&a=148622850&r=1789
My public charts
http://stockcharts.com/def/servlet/Favorites.CServlet?obj=ID1036600
JLS, Ditto
(scroll down for chart)
Trend, looks like you have it...and it appears to match up with slinkys chart projection rather well.
Trend found this on the barchart learning center.
"The Offset MidPoint Average is a simple moving average calculated from the average of the high and low for the period, offset by moving the average "x" periods to the right, where "x" is the second argument."
http://www2.barchart.com/education/learning.asp?code=BSTK&what=movave
Trend, that sounds right, I will dig around the barchart site and see if I can find a description or formula.
Trend, that is a mid point average, it is my understanding that it shows the mid point average from 7 days prior. If you count 7 periods back it should match up close to the mid point of that bar or candle.
Slinky, correct me if I'm wrong or mistaken.
Here are the settings I borrowed from airedale several years ago.
http://charts.barchart.com/chart.asp?sym=$inx&data=A&date=063006&den=HIGH&divd=Y&evnt=ADV&grid=Y&jav=ADV&size=D&sky=N&sly=Y&vol=Y&late=Y&ch1=011&arga=&argb=&argc=&ov1=019&argd=1&arge=7&argf=&ch2=059&argg=&argh=&argi=&ov2=&argj=&argk=&argl=&code=BSTKIC&org=stk
Glen's chart is log scale, is yours on linear scale?
I prefer linear scale for daily and shorter time frames, but that's just me.
Greg
60 min. $vix chart...(scroll down)

