News
News  Market Data
  Discover
Support: 888-992-3836
Copyright © 2023 InvestorsHub Inc.


Register for free to join our community of investors and share your ideas. You will also get access to streaming quotes, interactive charts, trades, portfolio, live options flow and more tools.
as usual you are quite right..
RD
'Too much attention is paid to indicators'
IMHO, not enough attention is paid to indicators, it's usually the wrong kind. Just start using trendlines on them, even retracement work. I have and it gets very interesting, when laid over the price action and time scales. I think T4 is suggesting that here also.
This stuff gets to be VERY powerful.
Nice BB.
fringe
Drawing trendline from CCI can give you a very good idea about where the upside ends. Cheers!
(1) Without looking at the price chart, draw the trendlines on CCI (autodrawn here):

(2) Now look at the trendlines drawn from the CCI and look at the price. As long as the CCI won't break the trendline, hold the position.

(3) Macro view:

Trendline drawn from the price chart vs trendline drawn from the indicator (I'm using CCI to draw the trendline since it is the leading indicator). Both are using 9 bars in drawing the trendline, also the program draws the trendline automatically, so no human error. In most cases, trendline drawn from the indicator are one or two bars ahead of the price trendline.
I put them in the same chart for easy comparision:

Good board.
From what I learnt and my experience in trading futures, the trendline you see in price could be one bar behind the trendline you would obtain through drawing from indicators. Basically, you could get one bar ahead if you get correct trendlines drawn from some indicators. Also, stocks could trade in trading range and sideways. There are a lot of discussions on this topic over Woodie's CCI club.
Here is an example on GOOG:
My program automatically draw trendlines, can you see the difference between the two charts?
Trendline drawn from the price:

Trendline drawn from CCI and reflected in the price chart:

Hi Despot - nice board!
I do pay a lot of attention to indicators, so I will read your advice here with great interest.
You've just been boardmarked.
Nice 18% today.
Perfect.
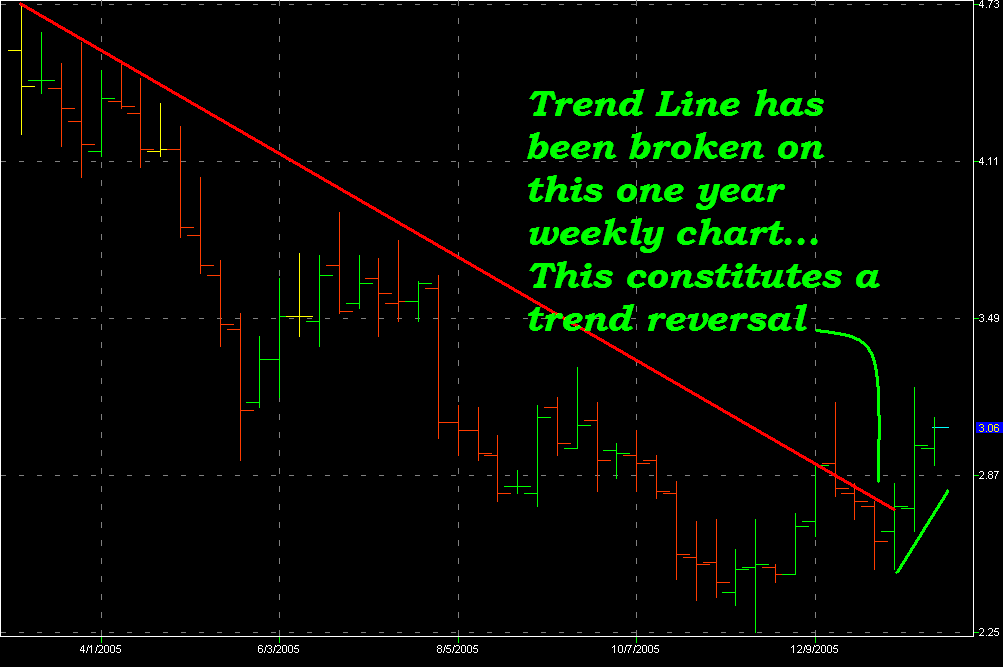
The down trend is dead... I should imagine something will soon set this one on fire.
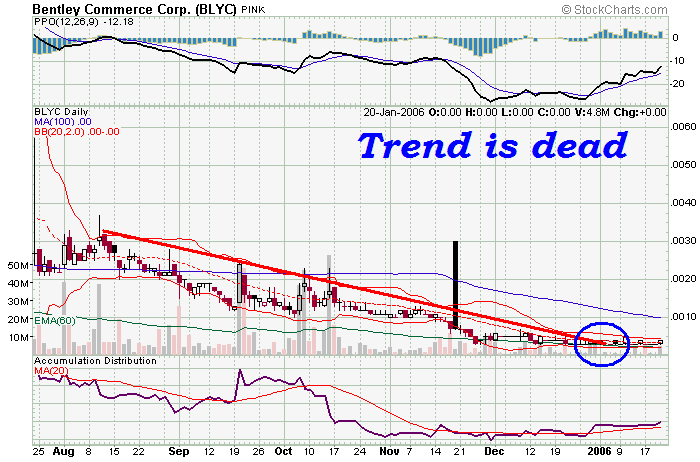
One year weekly chart showing a reversal:
NVAX
I really like what I see here.
That I have, seems the only reliable way to trade by the charts.
KISS method is usually best is what they say.
Hi Relentless Despot,
I see you've created a charting forum vying for simplicity. Nice!
Good luck and have fun,
J.D.
Might take a day or more but getting close to touching the upper trend line.
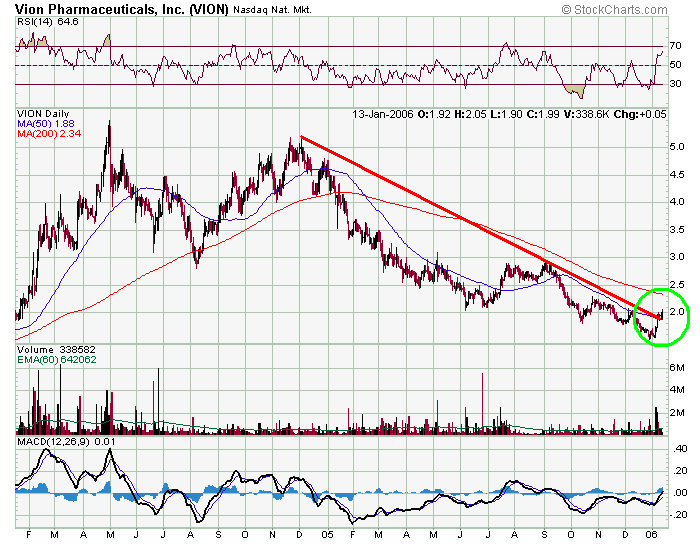
VION
Sure looks like a year long down trend is coming to an end here.
One can imagine what kind of upside there is after all this time.
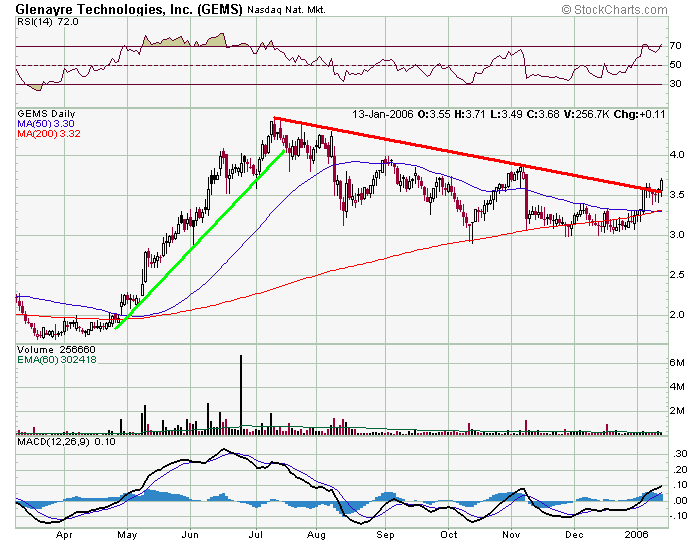
GEMS
Definitely worth watching from here.
friday's spike was very healthy.
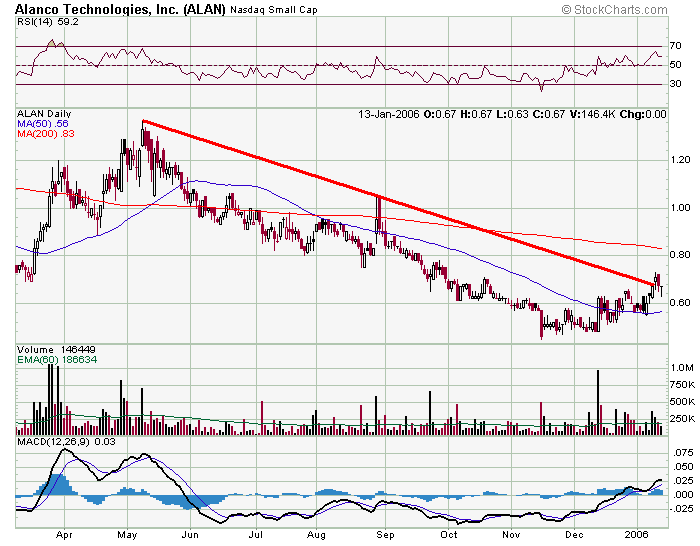
ALAN
This is worth watching.
Trend is not verifiably broken but close enough to keep an eye on.
SWB
Fianally broke the downtrend.
Looking good from here.
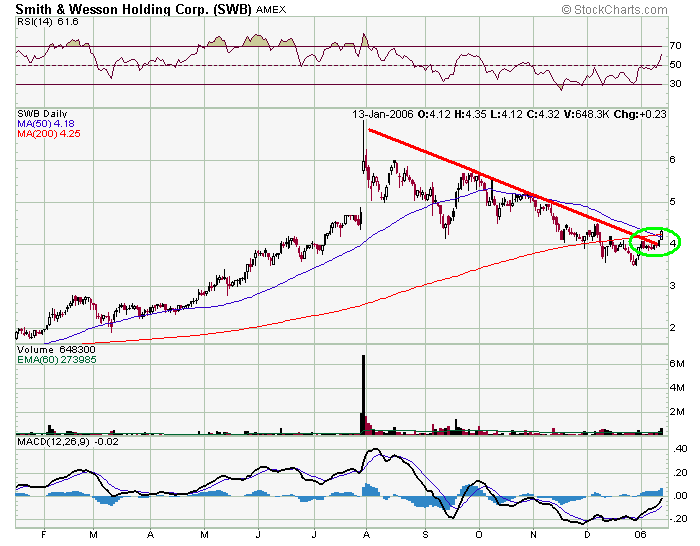
I've been waiting for this one for quite a while...
Sure hope to see a sustained uptrend.
CEAT move predicted flawlessly using simple trend lines.
Notice how the line runs directly into the price in this one month chart taken from the tenth of january.
Now look at the result
This method can and should be used in a short term basis as well.
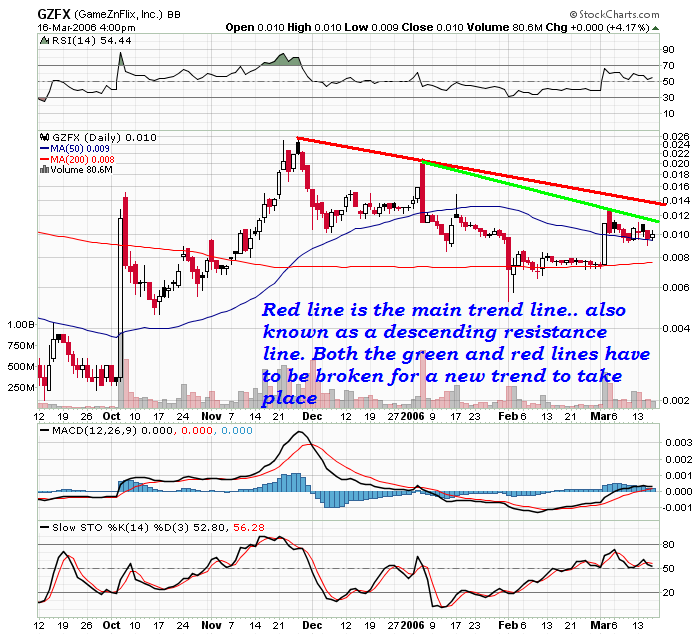
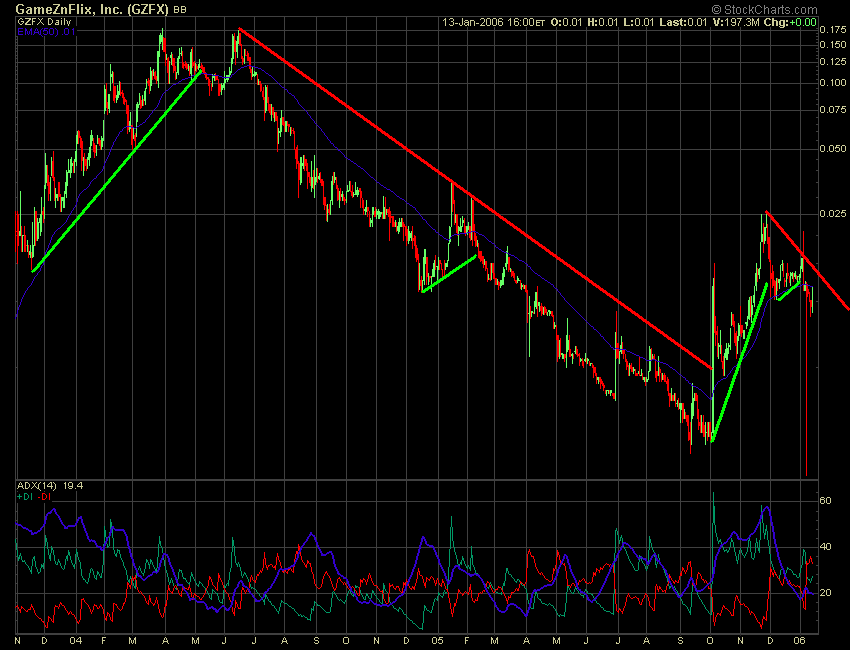
I used it last friday to predict an upward move in GZFX quite accurately.
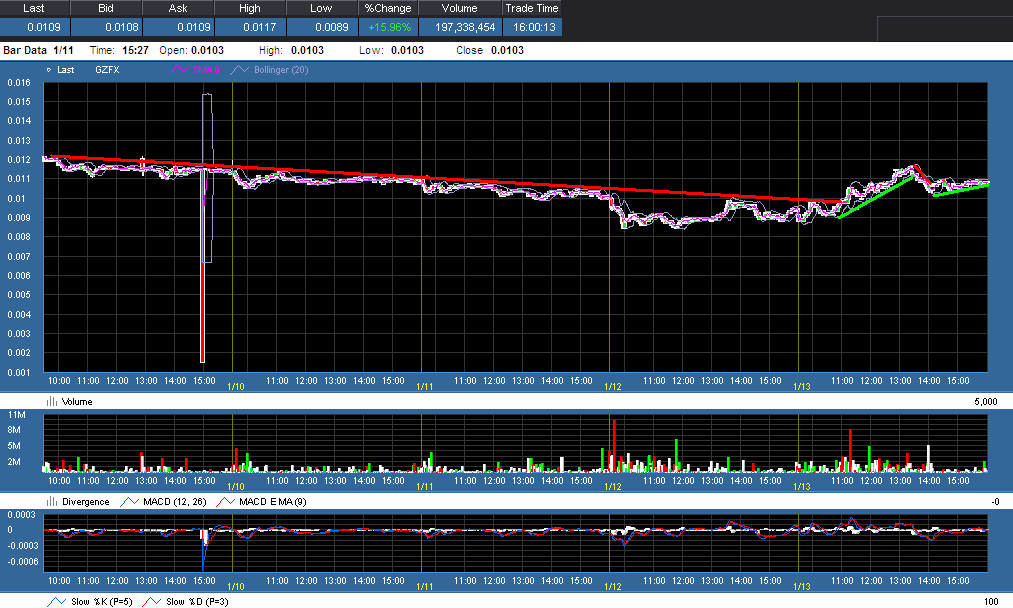
Trend for GZFX
not great at this point on the long term chart.
|
Followers
|
4
|
Posters
|
|
|
Posts (Today)
|
0
|
Posts (Total)
|
27
|
|
Created
|
01/15/06
|
Type
|
Premium
|
| Moderators | |||
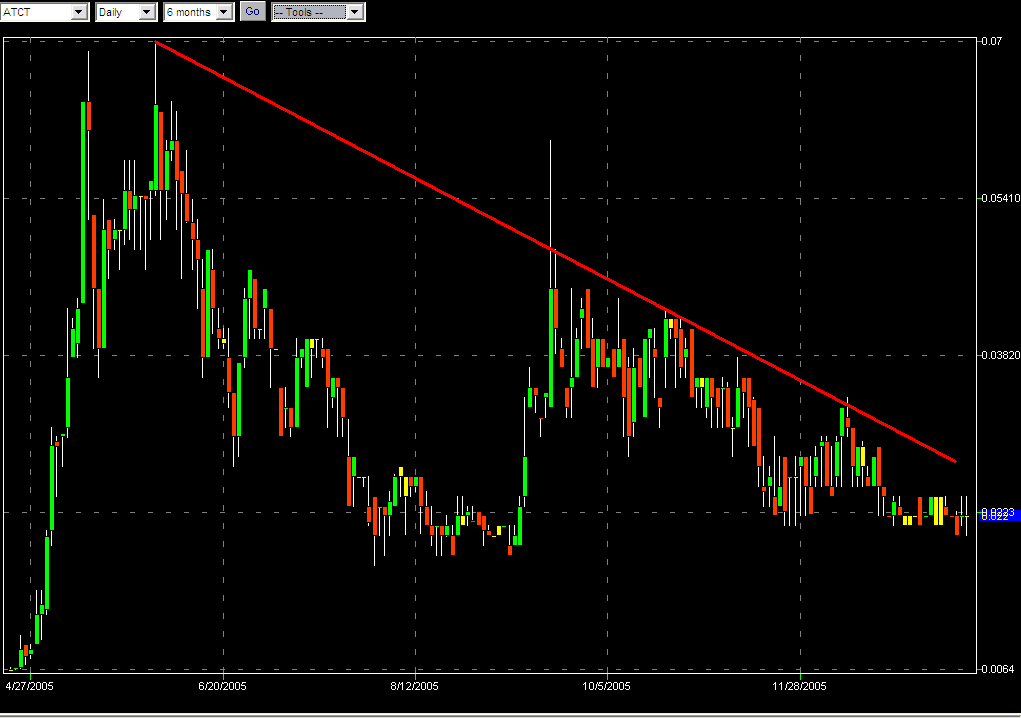
 As can be see by this chart above that if adhered to, simple trend lines,
can be quite profitable.
Now it is true, one might very well miss an absolute bottom entry
or an absolute top exit, but be honest...
Who among us ever truly gets either?
Other things that should be noted is just how often the spikes along a stock's price history
conform to a perfectly straight line.
It is uncanny.
As can be see by this chart above that if adhered to, simple trend lines,
can be quite profitable.
Now it is true, one might very well miss an absolute bottom entry
or an absolute top exit, but be honest...
Who among us ever truly gets either?
Other things that should be noted is just how often the spikes along a stock's price history
conform to a perfectly straight line.
It is uncanny.
| Volume | |
| Day Range: | |
| Bid Price | |
| Ask Price | |
| Last Trade Time: |