News
News  Market Data
  Discover
Support: 888-992-3836
Copyright © 2023 InvestorsHub Inc.


Register for free to join our community of investors and share your ideas. You will also get access to streaming quotes, interactive charts, trades, portfolio, live options flow and more tools.
Well my friends, I finally did it:
http://www.glorytrades.collective2.com/
http://investorshub.advfn.com/boards/board.aspx?board_id=18208
Some people had been bugging me for a long time to set up a service, and now it is done.
I'd like to ask all my old friends on this board who MIGHT be interested in my system (no obligation at all, no spamming) to sign up for e-mail notification at my Blog, http://www.glorytrades.blogspot.com/ (on the left side) so I can notify you when I have my private web site set up.
I will also post week-end reviews at the blog, like I used to, without revealing current open trades or pending trade alerts, as that would not be fair to subscribers.
I am only taking members through C2 right now, and only a very limited number. I want to concentrate on trading and learning the C2 features before I let alot of people join.
Thanks all!
I presume that construction of the BPGDM for intra day analysis would be relatively complicated. Basically the Gold Miners Bullish Percent Index is a market breadth/momentum indicator and is calculated by dividing two numbers: the number of gold stocks on the buy signal (according to the point and figure chart which emphasizes strong moves while ignoring small ones) by the number of all the gold stocks in the sector.
The number of gold stocks in GDX is considerable, furthermore I presume that they must be weighted as they are in the index to arrive at the correct figure. the following link lists the stocks in the GDX as of Dec. 4th 2007:
http://www.zealllc.com/2007/gdxetf.htm
Presumably this could be done in Excel (except the P&F chart) but first one would have to know exactly how it is currently constructed. Thanks for the notice about your post on the BPNDX Gloe.
Thanks Murray. No, I have no idea how he is getting the intra-day read on the BPGDM. See my Advanced Trading Methods board for my latest post on using the BPNDX for a long-only stratedy. I know someone who has traded the stratedy for years and is very happy with it.
Thanks for the excellent post gloe, have you been able to obtain an intra day BP scan for the BPGDM and if so where from if you please? Regardless this is a proven system that I am very interested in, thanks again.
Murray
Trading GDX (he GOLD Miners ETF):
http://stockcharts.com/h-sc/ui?s=$BPGDM&p=D&b=5&g=0&id=p18756890440
This guy says he is using the 8 MA of the BPGDM. I put the 8 EMA on the chart.
I know someone who trades QQQQ or (QLD) long-only using the BPNDX. He goes 50% long when the BP crosses the 10 MA; then 100% long when the BP crosses the 20 MA. Gets out of the position in half steps as well when the the BP index crosses 10 and 20 MA on the downside. The GDX might work as well.
Here is some new "system" being promoted by breakpointtrades.com: http://breakpointtrades.com//blog/uploaded_content/2010-05/0791123001274048250.png
http://breakpointtrades.com//blog/uploaded_content/2010-05/0322982001274048309.png
NYSI and NASI; and %>50MA
http://stockcharts.com/h-sc/ui?s=$NYSI&p=D&yr=0&mn=6&dy=0&id=p80487079911
http://stockcharts.com/h-sc/ui?s=$NASI&p=D&yr=0&mn=6&dy=0&id=p43793477683
Percent of stocks above 50 MA:
SPX: http://stockcharts.com/h-sc/ui?s=$SPXA50R&p=D&yr=1&mn=0&dy=0&id=p17296356149
NDX: http://stockcharts.com/h-sc/ui?s=$NDXA50R&p=D&yr=1&mn=0&dy=0&id=p47269823454
NAS Comp: http://stockcharts.com/h-sc/ui?s=$NAA50R&p=D&yr=1&mn=0&dy=0&id=p15664220620
NYSE: http://stockcharts.com/h-sc/ui?s=$NYA50R&p=D&yr=1&mn=0&dy=0&id=p62505006991
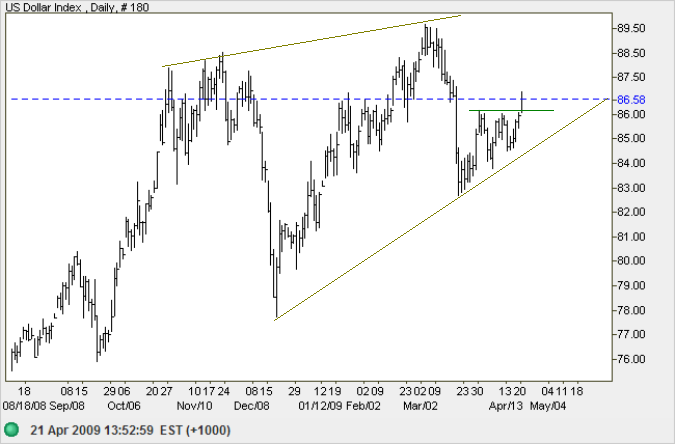
Stock market action is following the action of the US dollar. The big plunge down in the US$ since March of this year corresponds with the huge rally in equities.
The recent sideways action of the US$ is refelcted in the sideways action of the equity market.
Chart from Colin Twiggs at www.incrediblecharts.com

SPX Monthly EW picture [from Corey at Afraid to trade dot com]
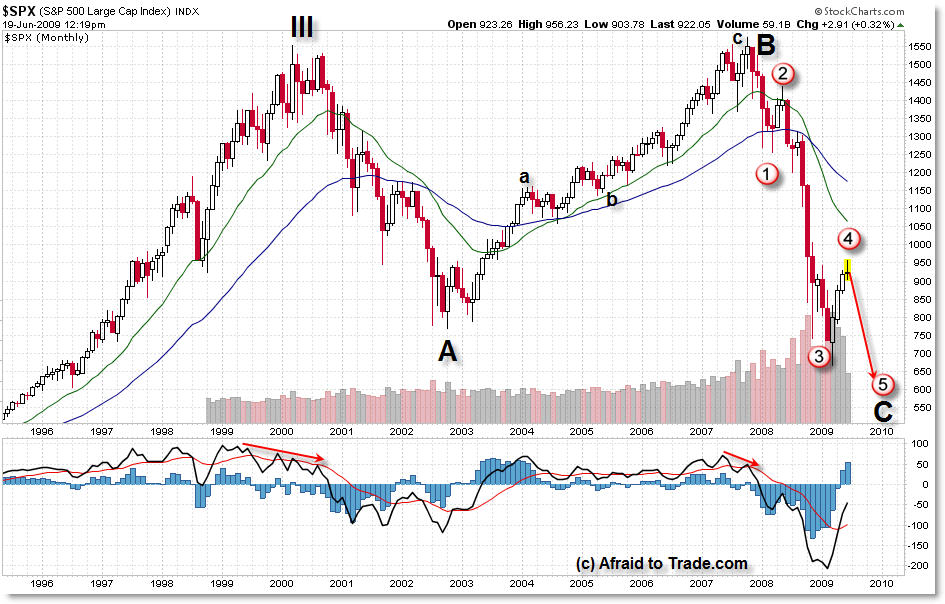
Many Elliotticians agree that we completed a large-scale Third Wave into the 2000 highs and that we are now in a 10-year Fourth Wave correction phase that began off the 2000 highs.
This Fourth Wave will (has) subdivide into a three-wave corrective phase as all fourth waves do. Wave A was the move from 2000 - 2002; Wave B up was the bull market from 2003 - 2007. We are now structurally in Wave C down.
To step it into more detail, Wave C subdivides into a Five-Wave sub-structure (fractal). We have already moved four waves of that expected five wave structure.
Technically, the entire move from 2000 to present has been an “Expanded Flat” where Wave B made a nominal high and Wave C is expected (has already) made a new low beneath the “A” Wave.
That is the historical count in which we trade and invest currently. Wave C is much, much closer to its end than its beginning, but many Elliotticians agree that we have one more wave to the downside to finish-out the C wave before putting in a bottom and rallying off these levels - perhaps as low as 550 on the S&P 500 (an exact discussion on targeting is beyond the scope of this post).
With that being said, the rally from the March 2009 lows to present (if not even the November 2008 lows) has been a fractal Primary 4th Wave rally that targeted the 1,000 index level.
It now appears this rally is also coming to an end… if not has already ended . . .
Whether or not we pop higher from here to challenge the 1,000 level, the future Elliott Wave pathway seems to call for one more swing down to test - at a minimum - the 666 lows from March (which would be a 5th wave truncation). I get the sense that most seem to believe we will be breaking these lows.
. . . .
Corey Rosenbloom, CMT
Afraid to Trade.com
[gloe's note: This would mean that after wave IV completes, possibly breaking or just retesting the March lows, we have a humongous Wave V going UP to look forward to. After that, well . . . I won't worry about it now.  ]
]
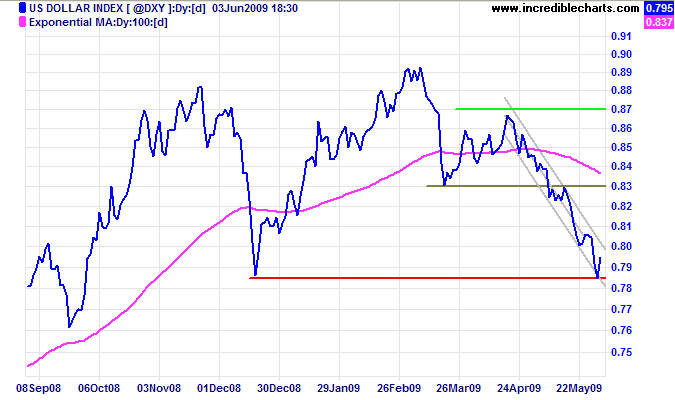
US Dollar from Colin Twiggs:
The US Dollar Index reached its target of 79 and is now retracing to test the upper trend channel at 80. Upward breakout would signal a secondary reaction to test resistance at 83. Narrow consolidation above support at 78.50 would warn of another primary down-swing.
Hi gloe
Thank you for sharing these charts.
sb
A few different veiws of the RUT:SPX ratio:
http://stockcharts.com/h-sc/ui?s=$RUT:$SPX&p=D&yr=0&mn=6&dy=0&id=p22894991016
http://stockcharts.com/h-sc/ui?s=$RUT:$SPX&p=D&yr=0&mn=6&dy=0&id=p94329874763
FOOT's NYSI chart with IWM behind it:
http://stockcharts.com/h-sc/ui?s=$NYSI&p=D&yr=1&mn=0&dy=0&id=p64970214277
Alot of chop in this ratio before the big sell off in the majors: http://stockcharts.com/h-sc/ui?s=$MSEMF:$DJW&p=D&st=2007-05-12&id=p31395813474
Potential Cycle Reversal Dates
2009 Potential Reversal Dates: 1/20, 2/11, 3/7, 3/15, 4/8, 4/16, 4/27, 5/7, 6/8. We publish these dates up to 2 months in advance.
With our next key reversal date aligning with the release of the stress test results, we are looking for the market to move higher into that date.
I've also added our next date, 6/8. This means to me that the next move should be a mid term move - and if we peak into May 7th, then we consolidate or retest or crash lower into 6/8.
FWIW from Stock Barometer http://www.stockbarometer.com/Default.aspx
Doug Noland's essay: The Greatest Cost:
http://www.prudentbear.com/index.php/creditbubblebulletinview?art_id=10221
An astute analyst posed the following question yesterday: “The current debate is centered on whether the Fed can take back the liquidity in time in order to prevent inflation. Suppose it can. Suppose they execute this perfectly. But if the Fed is able to flood the system with the liquidity (thus reducing the severity of the downturn) and take it back before it causes inflation, it seems there is a free lunch. We get something for nothing. So, assuming a perfectly executed game plan by the Fed, is there a cost? Do they keep rates low for a time, only to raise them a lot a year down the road – is that the cost? Or is there another cost?”
I’m short on time today, so I’ll attempt a brief response.
First of all, while it often appears otherwise, finance provides no free lunch. The mispricing of Credit and misperceptions of risk in the marketplace have deleterious effects, although their true impact may remain unexposed for years. Indeed, the more immediate (and always seductive) consequences of loosened financial conditions tend to be reduced risk premiums, higher asset prices, and a boost to economic “output”. Conventional analysis of monetary policymaking still focuses on “inflation” and “deflation” risks. I would strongly argue that our contemporary world has already validated the analysis that acute financial and economic fragility are major costs associated with market pricing distortions.
When the Federal Reserve collapsed interest rates following the bursting of the technology Bubble, the results seemed constructive. Stock and real estate prices inflated; a robust economic recovery ensued. There was at the time some recognition of the potential for real estate excesses. But this was seen as such a small price to pay in the fight against the scourge of deflation. It was not until 2007 that the nature of the true costs of a massive “reflation” began to come to light.
Many would today argue that it was simply a case of the Fed’s failure to take the punchbowl away in time. Such analysis misses a key facet of Bubble dynamics. Once the Mortgage Finance Bubble gained a foothold there was absolutely no way policymakers were going to be willing to risk bursting such a consequential Bubble.
I see ample support for my view that Bubble dynamics have taken root throughout government finance. This unprecedented inflation includes Federal Reserve Credit, Treasury borrowings, Agency debt, GSE MBS guarantees, FHA and FDIC insurance, massive pension and healthcare obligations, the myriad new market support programs, etc. This Government Finance Bubble is domestic as well as global. Amazingly, the scope of the unfolding Bubble dwarfs even the Mortgage Finance Bubble. And, importantly, it is reasonable to presume that the Federal Reserve will find itself in the familiar position of being trapped by the risk of bursting a historic Bubble.
So I see the probabilities as very low that the Fed will reverse course and impose tightened liquidity conditions upon the marketplace. Actually, reflationary pressures may force the Fed to increase its Treasury holdings in an effort to maintain artificially low interest rates. At the same time, I don’t see higher inflation as the greatest cost associated with this predicament. Much greater risk lies with the acute systemic fragility that I believe is inherent to major Bubbles. Similar to mortgage finance 2002-2007, the marketplace is significantly mispricing the cost - and failing to recognize the risks - of a massive inflation of government finance. And while every Bubble has its own dynamics and nuances, the unfolding Government Finance Bubble has even more precarious Ponzi Finance dynamics than the Mortgage Bubble.
The markets are on tract to accommodate two Trillion or so of Treasury issuance this year. This incredible amount of debt creation is in the range I would expect necessary to temporarily stabilize the U.S. (“services”) Bubble Economy. Importantly, this amount of new finance both plugs financial holes and works to stabilize inflated income levels. From yesterday’s income data, one can see that Personal Income was up 0.3% y-o-y to $12.04 TN. And while 0.3% is very meager growth, without massive government fiscal and monetary expansion (inflation) the economy would have suffered a destabilizing income contraction. Keep in mind that personal income has inflated 65% since 1998 and 33% from 2003.
I’ll try to explain my belief that dangerous Ponzi Finance Dynamics are in play with the current course of policymaking. First, I view panicked policymakers as seeing no alternative than to try to sustain the current (deeply maladjusted) economic structure. A more natural course of economic adjustment – from finance and consumption-driven Bubble Economy to a more balanced system – was going to be much too painful to endure. So a massive government inflation was commenced in desperation - with the grandiose objective of revitalizing securities markets, housing prices, and the overall U.S. economy. I just don’t see how this reflation goes much beyond stoking a susceptible artificial recovery.
First and foremost, with government finance now completely dominating the Credit system, I can’t even begin to contemplate how this process might nurture an effective allocation of financial and real resources. Indeed, I see today’s manifestations of Credit Bubble Dynamics as an extension of similar mispricing, misperceptions, and over-issuance that led to last autumn’s near financial collapse.
Admittedly, the massive extension of government Credit and obligations works wonders in stabilizing a devastatingly impaired system. Inflationism is always seductive; Trillions worth is absurdly seductive. Yet this extra layer of debt does little to affect change to the underlying economic structure. Actually, a strong case can be made that it only delays and sidetracks the necessary adjustment process. And, importantly, this enormous additional layer of system debt exacerbates system vulnerability.
At the end of the day, a system is made or lost on the soundness of its underlying economic structure. I posit that a sound economic structure is reliant upon only moderate Credit growth and risk intermediation. Our system requires massive Credit expansion and intensive risk intermediation. I would also posit that there are no benefits – only escalating costs – to throwing massive Credit inflation upon an unhealthy economic structure. And, returning to Ponzi Dynamics, one of the major costs to such inflationism is a massive expansion of non-productive Credit – obligations that are created without a corresponding increase in real economic wealth producing capacity. The debt can only be serviced by the creation of more debt obligations.
The danger is that markets too easily and for too long accommodate massive Credit expansion during the boom. Federal Reserve policies are fundamental to this dynamic. But at some point and out of the Fed’s control, as Wall Street learned, greed inevitably turns to fear and a reversal of speculative flows marks the onset of the bust. And it’s the massive inflation of non-productive Credit that ensures the unavoidable crisis of confidence. Can the underlying economic structure service the mounting debt load or, instead, is it the massively inflating debt load that is sustaining a vulnerable economy? And it is in this vein that I fear the Government Finance Bubble is on track to destroy the Creditworthiness of the entire economy. And this Ponzi Dynamic is The Greatest Cost to what I fear is a continuation of unsound policymaking.
Shooting the Shoots -- good (pessimistic) overview of everything . . .
http://zerohedge.blogspot.com/2009/05/shooting-shoots.html
Must read from David Rosenberg, who is on fire today, even taking on Larry Kudlow now.
It’s time to set the record straight
We acknowledge that we have felt like salmon swimming upstream. And, we constantly preach that everyone should keep an open mind and about the dangers of being perma-bears at the low (not our intention!) – but it’s time to set the record straight.
Big money investors have been on the sidelines
We have talked to so many bewildered clients about the massive equity market rally from the March lows that we’ve lost count. Few, if any (especially in the hedge fund community) seem to be celebrating the fact that the S&P 500 has rallied 30%, which tells us that big-money investors have been on the sidelines through this entire move. From our lens – and you can see this clearly from the twice-monthly NYSE data – the buying power for this market has actually come from severe short-covering as the bears head for the hills.
Few market-makers share enthusiasm of most economists
We don’t really share the view that the recovery, if and when it comes, will be sustained. We understand the historical record that even in the face of monumental fiscal and monetary easing, it takes a good four years for the economy to work through the aftershocks of a collapse in credit and asset values. While most economists are now waving the pom-poms, we find very few marketmakers who share their enthusiasm.
By and large, this rally has been a clear technical event
Gaps get filled rapidly and the primary source of buying power seems to be coming from a huge short-squeeze, and perhaps some pension fund rebalancing, which always seems to happen after the market makes a new low. To be sure, there is always the chance that the dry powder (money on the sidelines) is put to work and investors chase this rally. And nothing says that the S&P 500 cannot go as high as the 200-day moving average of 970 over the near term. We have seen these kinds of rallies in the past There were four of these kinds of rallies from 1929 to 1932; a half-dozen in the 19-year-old Japanese bear phase; and no fewer than 40,000 rally points in the Nasdaq that were fun to play in the 2000-2003 bear market – but the fundamental downtrend was obviously still intact.
Stock market not good at predicting inflection points
The stock market bottomed for good in the spring of 2003 because at that time, we were on the cusp of a 4%+ real GDP growth rate over the ensuing four quarters. The reason the rally of late 2001 to early 2002 failed was because the market realized the recovery would be delayed. Let’s just say that a 21% rally in the S&P 500 from Sept 2001 to January 2002 was not a bounce that was pricing in a 1.5% GDP growth rate for the ensuing four quarters, which is what we ended up with.
We can look at the situation in reverse. Did the 20% slide in the S&P 500 in the summer accurately predict the 4-1/2% GDP growth trend we were going to see the following year? No. And even in this cycle, the equity market was peaking just as the recession started in the fourth quarter of 2007. So, this notion that the equity market is telling us anything meaningful about the economic outlook, as Larry Kudlow would have us believe, is open for debate. The stock market’s track record is just about as good as the economics community at predicting the inflection points in the business cycle – and that’s not very good.
The market, as a whole, cannot be considered cheap
While there are some good blue-chip companies trading at low multiples, the market as a whole can hardly be considered cheap. That may have been the case two months ago, but no longer. As for the earnings landscape, it has become fashionable to talk about how the vast majority of companies are beating estimates in their 1Q results, but the bar was set extremely low to begin with after that epic 4Q operating and reported loss on S&P 500 EPS. In the meantime, earnings forecasts are being trimmed steadily for the balance of the year. In fact, forward P/E multiple of 15x operating and 30x on reported EPS are not that compelling. So, we do not have a strong valuation argument. We do not have a strong earnings argument. The seasonals ("sell in May”) are about to become less compelling too.
New lows in S&P won’t happen as soon as we thought
We would, at the same time, acknowledge that if the terms of engagement have changed, the Obama economics team and the Fed have made it exceedingly difficult for the shorts to make money in this market. Tail risks, notably in terms of the banking system, have been removed. This, in turn, does mean that even if we break to new lows in the S&P 500, it probably will not happen as soon as we had thought.
Government will do whatever it takes
At the March 9 lows, there was a real feeling of possible bankruptcy in the financial system. But it is now abundantly clear the government will not allow any big financial institution to fail. The end of mark-to-market accounting rules and the super-steep yield curve have returned most of the banks to profitability. Uncle Sam can be relied on to remain the capital provider of last resort, even for those banks that do not pass the coming stress test (which has been delayed, in part because the government wants to assess how to deal with the fallout of those particular institutions). More and more taxpayer money is being thrown at the credit crisis, and now we hear that $50 billion will be allocated toward easing debt-service strains among those households that took on second mortgages during the housing bubble. And, until recently when the green shoots started to appear, there was growing talk of yet another fiscal blockbuster coming down the pike to underpin the economy.
Green shoots can turn into a dandelion or a beanstalk
We are more impressed with solid roots than we are with green shoots. The economy and the capital markets are being held together by tape and glue, in our view. Private sector activity is contracting and will continue to lose its share of GDP as the government’s influence rises on a secular basis. Tax rates will inevitably rise, as they are already doing at the state and local government level. The public sector is now involved in the mortgage market, the insurance sector, the banking industry, and of course, the automotive business.
Economy transforming into an early 1980s European model
As economists, strategists, analysts, and the media, focus on the noise – which is what green shoots really are: a blip in a fundamental downtrend – a dramatic transformation of the economy toward a 1970s/early 1980s European model is unfolding. That post-Mitterrand, pre-Thatcher model, if memory serves us correctly, was one of low-potential real GDP growth rates, low-fair-value P/E multiples, low rates of return on capital and a sclerotic economic system. Economy is not in free-fall but is hardly stabilizing.
Now let’s get to the economy and those fabled green shoots
There is no doubt that the economy is no longer in free-fall, but it is hardly stabilizing, even if the data have improved from deeply negative trends at the turn of the year. There are pundits claiming that because initial jobless claims have managed to come off their recent highs, the end of the recession is in sight. That is a fairy tale, in our opinion.
Slack still being built up in the labor market
Given the looming wave of auto sector layoffs, we expect claims to break to above 700,000 this summer, which would be a new record. So, jobless claims do not appear to have peaked yet. In fact, the relentless surge in continuing claims signals that an ever-increasing amount of slack is being built up in the labor market. There has never been a peaking out in gross claims without there being a confirmation from a similar turn in the continuing jobless claim data. Moreover, initial jobless claims have topped the 600,000 threshold now for 13 weeks in a row, and that is the real story.
To suggest that claims have stabilized above 600,000 and that this is a good thing is ridiculous. It would mean that by this time next year, the unemployment rate could potentially reach 15%. The reason is because employment losses do not end until claims actually break below 400,000. No recession ever ended until claims broke below 600,000, and on average, recessions only end once claims drop below 500,000 (when the last recession ended in November 2001, as an example, claims were 450,000).
Job losses will not end until the end of the year
Employment is one of the four critical ingredients that go into the recession call, not jobless claims, and at over 600,000 on claims, we lose payrolls at a monthly rate of around 600,000. That is hardly what we would call a stable economic backdrop. We do not see job losses ending before the end of the year. Industrial production and real manufacturing/trade sales are two other components that go into the NBER recession-determination model, and our forecast suggests that they too will not bottom conclusively until 2010.
Real organic personal income decrease is unprecedented
What really caught our eye is the fourth horseman of the recession call – real organic personal income. This metric peaked in October 2007 and was early in predicting the official onset of the recession, which began in December of that year. This measure of household income – it nets out government benefits – slipped 0.5% in March and has declined for five months in a row (and six of the past seven). Over that stretch, it declined at over a 6% annual rate, which is unprecedented (the data series go back to 1954).
Expect consumer spending to lag because of lost income
Since August of last year, the consumer sector has lost $266 billion of organic income (in nominal dollars at an annual rate) as job losses mounted, hours worked cut back, and full-time positions shifted to part-time. This lost income – not to mention $20 trillion of evaporated net worth – will likely bring long lags in dampening consumer discretionary spending. We realize that one of the bright spots in the 1Q GDP report was the +2.2% print on real consumer spending. But let’s face facts: The bounce was concentrated in January after a record 30% plunge in retail sales (at an annual rate) in the final three months of 2008. We already know that sales were down in both February and March and that the statistical handoff with respect to consumer spending is negative as we head into the second quarter.
The government does not create income; it redistributes it
We mentioned tape and glue above because the only component of household income that is rising is government transfers (mostly jobless benefits), which rose 0.9% in March and by more than 12% on a year-over-year basis. The government share of personal income at 16.3% is higher today than at any other time in the past six decades (and that covers the LBJ Great Society social benefit transfer of the 1960s). But keep in mind that the government does not create income – it distributes income by borrowing from today’s bondholders and tomorrow’s taxpayer. Not until we begin to see real incomes rise without the crutch of Uncle Sam’s checkbook will it be safe to call for the end of the recession. And again, we see this as more a 2010 story than a 2009 story, although very clearly the markets are suggesting the latter (insofar as they are signaling anything about the economic outlook).
The worst is over
In any event, the economy has certainly passed its worst point of the cycle even if we do not yet see the bottom that many others do at this time. And it may very well be that we overstayed our bearish call on the equity market and that the lows were turned in on March 9. Many pundits who have been around far longer seem to believe that, and they could be right. But there is no sense crying over spilled milk, even after a 30% run-up in the S&P 500 and a 100 basis point surge in the 10-year note yield from the lows. It just broke above its 200-day moving average, and there is nothing but empty space on the chart to 3.8% – that is an observation, not a forecast, by the way.
Lessons learned from the Great Depression
With all that in mind, we thought it would be instructive to look back to the experience of the 1930s. A credit collapse, asset deflation and massive decline in economic activity were finally stopped in their tracks by massive doses of fiscal and monetary stimulus. The S&P 500 bottomed in the summer of 1932 and the trough in GDP occurred shortly thereafter. But if history is any indication, the depression did not end for another nine years. Even after the massive relief efforts and government intervention from the New Deal, we closed the 1930s with a 15% unemployment rate and consumer prices deflating at a 2% annual rate.
Focus on SIRP — safety and yield at a reasonable price
Because the attention now has shifted to the green shoots, as was likely the case after the 1932 low as well, we highly recommend that investors focus on the big picture, which is that the aftershocks of a credit collapse and an asset deflation of this magnitude last for years, even with public sector support. Now go back to that June 1932 low in the S&P 500 (below 5) and the initial surge was breathtaking – the market roared ahead by 75% in just the first three months. But guess what? For buy-and-hold investors, by the end of 1941, the S&P 500 was at the same level as in the fall of 1932. Nine years of nothing, unless you are the most astute trader around.
Folks who chased the rally after the market broke out of the gate woefully underperformed those who stuck with their focus on generating cash flows from the fixed-income market. The yield on long Treasuries fell from 3.8% to 2.5% (Fall of 1932 to the end of 1941) while Baa corporates did even better – rallying from 7.1% to 4.4%. So from this point forward, unless you are comfortable that you have the discipline as to when to get out, the lesson of the last post-credit crunch/asset deflation/depression seven decades ago is to retain your focus on SIRP – safety and yield at a reasonable price. Passive buy-and-hold strategies are destined to fail, in our view.
ok & thank you :o)
This bloggger uses that NYAD breadth oscillator, as well as having some other trading tips. He is a short term trader, not really a day trader. But you still might pick up some tips from him . . .
http://ronsen.blogspot.com/
I didn't look at it after today's close, but if it broke down more, I would say that is a confirmed sell signal. But as a day trader, I know my drill . .
Broke down a little more today ( deeper cross). Perhaps in a range S/R since the beginning of April. The little H&S (March)might not have been big enough to help a correction. Guess if it goes under + 200 there is some room to go down.
Thanks for this study I will join you in this as well as the $SPX:$VXO classic watching.
I use to enjoy looking at the $BPs' both line & PF, can not say I am very good at making a call from it in advance, but perhaps if you think it might be a worth while project (?) I would be happy to look at it regularly and bring anything to your attention that might be something to consider. Like a major Diver with the MACD, a possible chart pattern or if you have a suggested MA cross ( many this one you are presenting on the chart?). But there is also a possibility that looking at to many of these type of chart indicators can also be confusing. Maybe 1 or 2 to confirm might be enough, let me know what you think. I value your point of view.
sb
As of Fry Day, close to a sell signal, with the shorter average moving below the longer average, and BOTH pointing down.
Consumer discretionary:utilities ratio -- big bullish diver compared to SPX & INDU at the March bottom. Will it pick the top too?

Eur/USD from Colin Twiggs

The euro broke through support at $1.31 and is headed for a test of primary support at $1.25. In the long term, failure of support at $1.25 would offer a target of parity (calculated as 1.25 - [ 1.50 - 1.25 ]). Recovery above the descending trendline is unlikely, but would warn of a test of $1.47.
10 year Treasuries -- which way will it break. (Nice TL reistance yesterday.)
Has the Economy turned the corner? According to Merrill's David Rosenberg, we are only 44% of the way done. (But let's remember that the stock market will bottom before the economy does.)
http://www.ritholtz.com/blog/2009/04/four-markers-of-an-economic-turnaround/
Via Barron’s, we learn that Merrill’s David Rosenberg has four markers that he is tracking to identify when the economy is finally making a turn and starting an extended expansion:
• Home prices.
• Personal-savings rate.
• Debt-service ratio
• Ratio of the coincident-to-lagging indicators (Conference Board).
By aggregating those four markers, Rosie calculates we are roughly 44% of the way through the “adjustment” process. While that is a tick up from last month, the improvement, he laments, has been “very modest and very slow.
“We should add that he also stresses that it’s critical for both the economy and the market that payrolls stop shrinking. All the talk about jobless claims “stabilizing” is so much poppycock, he snorts. That number of claims, he notes, is still consistent with monthly payroll losses of around 700,000. As with industrial production, which is also in a vicious slump, employment must stop falling before a recession typically ends
Call us when claims fall below 400,000,” he says, which is his estimate of “the cut-off for payroll expansion/contraction.” Until then, he warns, “the recession will remain a reality. Rallies will be brief, no matter how violent, and green shoots are a forecast with a very wide error term attached to it.”
Rosenberg also points out that the financials and consumer cyclicals have net short positions of 5 billion and 2.7 billion shares — strongly suggesting that a “not insignificant part of the rally has been provided by shorts running for cover.” The Russell 2000 small-cap index is up 36% since the March low, outperforming the S&P by almost 10%. The last time the Russell outperformed the SPX was from late November to early January. Two months later, the major averages made new lows.
One other warning sign: Over the past five weeks, Rasmussen’s investor-confidence index surged 32 points — unprecedented gains in so short a span. This suggests excessive trader optimism for a sustained equity-market rally.”
An appetite for risk returns: check the MSCI Emerging Markets Index relative to the Dow Jones World Index. The fact that developing countries are now outperforming the developed ones is a sign that global investors are beginning to take more risk - a necessary ingredient for stock markets in general to improve further.
http://stockcharts.com/h-sc/ui?s=$MSEMF:$DJW&p=D&yr=1&mn=0&dy=0&id=p57237750023
McLaren's latest:
http://www.mclarenreport.net.au/articles/articles/206/1/March-27-2009-CNBC-SQUAWKBOX-EUROPE/Page1.html
Two weeks ago on Squawk Box I said stocks looked good and the index would rally 12 trading days then we’d have to assess it again. Yesterday was the 13th trading day of the rally so here’s the assessment. As we discussed last week, if this were a last leg down in the bear campaign the time of that leg would be either 60 to 64 days or 90 to 99 days from the January high. The low was 60 days from that high and 90 days from the December 8th high which was very important because many stocks including the financials hit their highs on that date. The index was then 90 days form the December high and since 90 is a completion cycle for many stocks it carried a strong probability of ending the leg down.
If the rally could exceed 3/8 of that leg down it was sufficient confirmation the leg down was complete and there would be a strong rally into the 12th trading day.
This vibration in time should continue so there are three important time windows the next two months. The 6th/7th of April at 30 days from low and 90 and 120 from highs. If the index goes down into that “time” with a 3 to 5 day move down it would be bullish and present a low. If the index goes up into that date with a distribution pattern it could indicate a run at the March lows. The next important time window would be around the 20th of April at 45 calendar days from low and then 60 calendar days around the 6th of May.
If this is an end to the bear the index will either build a base that will take out to May 6th as it did in 1938 or the index will test the March low. This has been the largest month up since October 1974.
[more at the link]
Dent, Prechter and Others Warn that the Worst is Yet to Engulf Us
by Lorimer Wilson
http://www.safehaven.com/article-12843.htm
Most investors don't take seriously warnings about the future of the economy and the financial marketplace, but those who did avoided the dreaded "Cs" of finance: the Credit Crisis and Crash of '08. What warnings are we talking about you might ask? Well, it was the headlines of several years ago screaming that a 'Category 6 Fiscal Storm', 'Debt-Driven Meltdown', 'Systemic Banking Crisis', 'Financial Train Wreck', 'Wild Ride', 'God-Awful Fiscal Storm', 'Major Upheaval', 'Rude Awakening', 'Great Disruption', 'Debt Bombshell', 'Major Upheaval', 'Unwelcome Economic Spiral', 'Perfect Financial Storm', 'Serious Collapse', 'Drastic Fall', 'Financial Disaster', 'Major Bear Market' and/or an 'Economic Earthquake' was in store for the U.S. and, indeed, the global economy in the very near future. And the future is now!
Some Predictions do Come True
These warnings and predictions were often derided as just negative nonsense coming from alarmists, 'party poopers', 'Chicken Littles', 'perma-bears', 'doom and gloomers' and the like rather than from the insightful economists and financial and market analysts who made them. To their collective credit they were all substantially correct in their prognoses of what we could expect to happen as exemplified by what has occurred (and is still occurring) over the past 6 months. It has cost many investors 50+% of their stock market investments, 20 - 30% of the value of their home or even the loss of their house itself. Perhaps we should have paid more attention to what they said and as I compiled in the 6-part series back in 2006 regarding the "Ominous Warnings and Dire Predictions of World's Financial Experts" followed up by a 4-part series entitled "Warning! Fiscal Hurricane Approaching! Is Your Portfolio Secure?"
Once again warnings and predictions are being put forth about the next crisis to befall us and this time round it behooves us to pay more attention and make sure this time that we are better positioned to survive and prosper whatever comes our way. Below are major market forecasts and investment advice based on drastically different analytical styles (demographic, fundamental, technical and 'socionomic') from forecasters who have 'been there, done that' successfully in the past and are once again forecasting what their research indicates is in store for us over the next decade. It should be ignored at our peril.
Harry S. Dent Jr ., the author of 'The Roaring 2000s', 'The Roaring 2000's Investor', 'The Next Great Bubble Boom' and his latest book entitled 'The Great Depression Ahead' states that "The most important cycle change for your wealth, health, life, family, business, and investments is just ahead during the first and last depression you are likely to experience in your lifetime."
Dent makes it clear that his predictions, while almost always contrary to most economists and expectations, have almost always proved to be correct because his predictions are based on the same sound and quantifiable logic insurance actuaries use with a high degree of accuracy to predict, decades in advance, when people will die. Dent says he applies the same science to predicting what things will happen in between birth and death - such as when people enter the workforce, get married, spend, are most productive, borrow, invest, retire, buy houses and so on. He believes that such a study of demographics and other key cycles allows him to determine the future based on the facts of the present and of demonstrated behavior so he can see the pig, or the pigs, going through the python. With that understanding of the basis for his forecasting he goes on to predict (and I paraphrase) that:
Dow will Rebound to 10,000 - 13,200 within 6 Months
A likely massive stimulus plan will bolster the economy somewhat into 2009 for a likely rebound in the Dow to between 10,000 and 13,200. A projected bullish scenario puts the Dow between 12,000 and 13,200 between April and September 2009 if the Treasury rescue plan takes hold with the markets anticipating a recovery. A projected bearish scenario assumes that if the recovery is at best rocky, or at worst that we were to move more into a depression in 2009 than a serious recession, that the Dow would only get back to 10,000 to 11,000 and not last as long.
Oil will Increase to $180 - $215+ by 2010 and then Decline to $40 - $60 by 2015
Oil prices will likely rise to a commodity bubble peak of between $180 and $215, possibly even more, and if not that high then, at an absolute minimum, retest its 2008 high of $147, between late 2009 and mid-2010 unless the economy implodes earlier in 2009. We should then see a major crash in oil prices, beginning in 2010, back into the $40 - $60 range, and possibly even lower, between 2012 and 2015 which will continue for years.
Commodities will Peak between 2009 and mid-2010
Commodities in general, including gold and other precious metals despite their crisis hedge qualities in the past, will likely peak between mid- to late 2009 and mid-2010. It will probably be 2020 or 2023 before we see the next sustained commodity boom and bubble which should last into 2039 - 2040.
Dow will Fall to 3,800 - 4,500 by 2012
The next accelerated stock crash, led by emerging markets, Asian stocks, financial stocks and tech stocks - and finally by oil and commodity stocks - will likely occur between mid- to late 2009 and late 2010, when most of the damage will occur, and continue off and on into mid- to late 2012. The Dow will fall at least to 4,500 and more likely as low as 3,800 by mid-2012, the 1994 low where the stock market bubble first began.
Nasdaq will Fall Below 1,100, its 2002 low, by late 2010 or mid-2012 at the latest.
Market will Rally from 2012 until 2017
A substantial bear market rally will likely occur between around mid-2012 and early to mid-2017 and then a less severe downturn will occur from around mid-2017 into early 2020 or as late as early 2023.
Economy will be in a Depression by 2011
The worst of this next depression is likely to hit between mid-2010 and mid-2013, especially around early 2011, but if the banking system continues to implode a deep downturn or depression could begin sometime in 2009 instead of 2010.
Editor's Note: According to a recent research paper on "Stock-Market Crashes and Depressions" by David Barro, a professor of economics at Harvard, there is a 20% probability that a stock-market crash such as what we are currently experiencing will result in a minor depression - where the economic decline is between 10% and 25% - and a 28% possibility if it is associated with a major war of the magnitude of World War 1 and World War ll. Conversely, if a minor depression occurs first we can expect a market crash to follow 69% of the time and 83% of the time if the depression is major i.e. the economic decline is in excess of 25%. As such, should our current recession escalate and culminate in a minor or major depression by 2011 it may well follow that we will indeed experience another major stock market crash in 2012 as Dent forecasts.
Unemployment could Increase to 12 - 15% by 2011
Unemployment could reach 12-15%, or possibly higher at the peak of the depression.
Inflation will Increase until mid- 2010 and then turn to Deflation
A rise in inflationary trends from mid-2009 into late 2009 or early mid-2010 will then reverse to an ominous deflationary trend in prices, as the economy slows and all assets deflate, as they have done after every bubble boom in history. It is not that the government will not try to inflate its way out of this next crisis by cutting interest rates and undertaking public works projects, etc. but that the massive write-off of real estate and business loans will outweigh those efforts and contract the money supply.
Interest Rates will Increase
The Federal Reserve will raise interest rates aggressively from mid-2009 forwards due to rising inflationary pressures which will contribute to the on-going crash of the stock market down to the 3,800 to 4,000 level.
U.S. Dollar will Decline
The U.S. dollar, which declined in early 2008 in the face of a strong stock market and which strengthened considerably during the Crash of '08, is likely to decline again into 2010 - 2012 as the stock market declines considerably further. The dollar will then strengthen again before we see the second milder stage of the depression between mid-2017 and early 2020 or 2023.
Housing will Decline by 40 - 60% from Today's Levels
A more severe deflation cycle in housing will begin between late 2009 and mid-2010 and will likely last until somewhere between mid-2011 and 2013, and possibly as late as early 2015 in larger homes. During that period the average American house price will fall at least a further 40% and as much as a further 60% from today's market prices.
Housing has remained essentially flat when adjusted for inflation over the last century except during the extreme bubble after 2000 and the deflation cycle of the early 1900s and 1930s. As such, the current grossly overvalued house prices of today, coupled with expected rising unemployment deflationary trends and the continued real estate slowdown due to the aging of the massive baby-boom generation, will likely make such a decline in house prices a reality.
Greatest Economic and Banking Crisis since the 1930s will Occur Between 2010 and 2012
Dent concludes by saying "If you thought 2008 was scary, 2010 to 2012 will be the greatest economic and banking crisis since the 1930s. You must be prepared in advance to survive this most difficult season. Do not accept the proposition that you cannot, or should not, take steps to guard against losses. As an investor, it is your money, your future, and your responsibility to protect yourself in the best way possible and there will be the greatest reward for those who do prepare during this once-in-a-lifetime 'great sale' in financial assets."
How Best to Invest and Prosper during the Tumultuous Times Ahead (according to Dent)
1. Early to mid 2009:
a) Sell stocks, except commodity and energy sectors.
b) Allocate between commodities and T-bills or money markets and /or safe currencies.
2. Late 2009 to mid-2010:
a) Sell commodities and commodities and energy stocks.
b) Allocate 100% to T-bills or money markets and safe currencies.
3. Mid- to late 2010:
Start to allocate to 30-year Treasury bonds only after their yield begins to spike.
4. Late 2010 to mid- 2011:
a) Allocate to 20-year corporate bonds when yields go to extremes.
b) More conservative investors should focus on AAA corporate, more aggressive investors toward BAA.
c) All investors must recognize, however, that even high-quality bonds will be in question as to their viability, given that the downturn between mid-2009 and 2012 is anticipated to be more extreme than anything we have seen since the early 1930s, mid-1970s, or early 1980s.
5. Mid-2011 to mid-2012:
Allocate to long-term municipal bonds when yields seem to be peaking (high-tax-bracket investors).
6. Mid- to late 2012:
a) Aggressive/growth investors: allocate majority into Asian stocks and lesser into U.S. multinational, technology and health care, with minor allocation in long-term corporate, Treasury, or municipal bonds.
b) Conservative investors: focus largely on 10- to 30-year Treasuries and 20-year corporate AAA bonds, with minor allocations in multinational, health-care, and Japanese stocks.
7. Late 2011 to early 2015:
Look for selected opportunities in real estate (small condos and starter homes early on; vacation and retirement homes later; trade-up homes by 2015).
8. Mid- to late 2014:
Aggressive/growth investors: allocate more to leading stock sectors such as China, India, health care, multinational, technology, and financials on a likely short-term correction between late 2013 and late 2014.
9. Early to mid-2017:
a) Sell stocks in all sectors.
b) Convert largely back into long-term bonds and, to a lesser degree, into T-bills or money markets.
Editor's note: His book goes on to provide additional advice on which assets to invest in up to 2036 which I have excluded here as our interest and focus is much more short-term given our current economic, fiscal and investment environment.
If you doubt the validity of Dent's above mentioned predictions and advice consider this: 'The Great Depression Ahead' was written in the fall of 2008 yet Dent projected on page 56 that a) many banks would fail - that has already happened; b) or have to merge with others - that has already happened; c) or have to be bailed out by the government - that has already happened; d) the Fed would have to cut short-term interest rates to near zero - that has already happened; e) the federal deficit would soar to in excess of a trillion dollars - that is already a reality and f) the 30-year Treasury bond would eventually fall to something like 2% in yields (3.77% as of March 16th, 2009). Dent has an extremely good track record of telling us what we would rather not hear and acknowledge as most likely the case so it behooves us to make the most of this important information. Dent encourages everyone to apply for his free periodic e-mail updates to his basic forecasts and investment strategies and to check out 'Free Downloads' at www.hsdent.com for further and more current information. I encourage those readers who have found the above forecasts and investment advice to be informative to buy his latest book for a greater understanding of the study of demographics and other key cycles that allow him to determine the future so precisely.
Russell Napier is the author of the book "Anatomy of the Bear", a professor at the Edinburgh Business School and a consultant to CLSA Ltd. which is one of the top research houses in Asia. Napier's research indicates (and I paraphrase) that:
The S&P 550 will Reach an Interim Bottom by 1Q'09
The S&P 500 now trades at below fair value based on Tobin's "q" ratio (which compares the market value of companies to the cost of their constituent parts) which has dropped below its long-term average of 0.76 to 0.68 from a peak of 1.9 in 1999, and the cyclically adjusted 10-year price-to-earnings (CAPE) ratio and, as such, should bottom by the end of the 1Q'09.
The S&P 500 will Rally between 2009 and 2010
The S&P 500 will experience a significant rally from the end of the 1Q'09 until mid-2010 to late 2010.
The S&P 500 will Decline to 400 by 2014 (the Dow 30 to 3800)
The S&P 500 will then undergo a major crash that will see U.S. equity prices bottom at almost 50% below current levels (i.e. to 400 or less; the Dow 30 to 3800 or less) sometime around 2014 as Tobin's "q" drops to 0.3 signaling the end of the bear market, as it has done at the end of the four largest U.S. market declines in 1921, 1932, 1949 and 1982.
U.S. Treasury Sales Could Collapse Leading to End of U.S. Dollar as Reserve Currency
The crisis of 2008 will force key large global economies such as China, India and Russia to target domestic consumption-driven growth to replace sales to the U.S. and Europe. When China, in particular, succeeds in shifting to a consumer-driven growth model it will clearly provide the key marginal demand for most global consumer goods and this will further reduce the need for the current export-oriented growth countries to manage their currencies relative to the U.S. dollar in pursuit of export growth to the U.S. The fewer countries that pursue such a policy, the less foreign support there will be for the U.S. federal debt market. This could well be the cataclysmic event that forces U.S. equities to the massive under-valuations seen at the previous major bottoms of 1921, 1932, 1949 and 1982 and the end of the U.S. dollar as the de-facto reserve currency.
Deflation Expected until 2015
The yield on treasury inflation-protected securities (TIPS) shows (using the yield differential between Treasuries and TIPS) that deflation is now expected and forecasts that the average prices in the U.S. will decline every year between now and 2015. Such a deflationary economic contraction would be a major shock to the business community and earnings damage associated with such a contraction would probably be larger than normal initiating a significant decline in the U.S. equities markets.
Continued Deflation or Renewed Inflation are Possibilities
The supply of U.S. Federal debt will be soaring just as foreign demand for that debt is waning and this combination will produce an up-shift in the yield curve which, if it were not met by a Federal Reserve reaction, would be highly deflationary for the U.S. On the other hand, if the Fed were to decide to open its balance sheet to buy Treasuries and keep interest rates low, then the consequences would be an inflationary scare that would further exacerbate capital outflow and the collapse of the dollar.
Sell U.S. Treasuries Soon, Buy Equities in 2014
Bond investors are already being presented with a once-in-a-lifetime opportunity to get their money out of U.S. Treasuries. Equities will look truly terrible by 2014 but they will be so cheap they will once again represent excellent long-term value as they did in 1921, 1932, 1949 and 1982. Should the world lose faith in U.S. Treasuries sooner and suddenly then U.S. equities would decline the projected 50% very quickly thereafter.
Foreign central banks' faith in Treasuries can be monitored by checking the value of marketable securities held in custody for foreign official and international accounts at www.federalreserve.gov/releases/h41/Current/. Any marked decline would be a warning to investors in U.S. securities that the end game was in progress.
Editor's note: What is truly remarkable about Messrs. Dent's and Napier's predictions is that they approached their economic and financial analyses from totally different perspectives - Dent using demographic trend analyses and Napier using technical and fundamental economic analyses - yet came to the same conclusions by and large. It really makes you want to sit up and take notice as to what they have to say.
Robert R. Prechter Jr. is author of a number of books including "Elliott Wave Principle" (1978) in which he predicted the super bull market of the 1980s; "At the Crest of the Tidal Wave - A Forecast of the Great Bear Market" (1995) in which he predicted a slow motion economic earthquake, brought about by a great asset mania, that would register 11 on the financial Richter scale causing a collapse of historic proportions; and "Conquer the Crash: You can Survive and Prosper in a Deflationary Depression" (2002) in which he described the economic cataclysm that we are just beginning to experience and advised how to position one's self financially during that period of time. Prechter also publishes two newsletters, the 'Elliott Wave Theorist' and the 'Elliott Wave Financial Forecast' both of which are paid subscription based. The Elliott Wave Theory takes a 'socionomic' approach to forecasting which contends that markets are driven by psychology and, while it is relatively easy to understand in concept, the interpretation and resultant application of the trends are difficult to implement consistently.
The above being said, there are no shortage of senior economists, analysts and financial industry executives who sing the praises of his work. Such words as "ignore Bob's books at your peril"; "it could help you save your financial future"; "the closest thing to a crystal ball we could look for...it is a road map that no investor should be without"; "ignorance may not be bliss - it may mean bankruptcy. Ignore the message at your risk"; "knowing long term risks and opportunities in financial markets ahead of time is absolutely the key to consistent investment success"; "if you want to preserve your wealth (or what little is left of it) I urge you to follow Prechter's advice. You will be grateful that you did". There are more words of praise to be had but I'm sure you get the idea of what astute professionals think of Prechter's work.
So what does Prechter have to say about the current situation and how we should deploy our assets? He is not as exact with free advice as Dent and Napier are but, as a result of his analyses, he has the following to say about the economic and financial environment (and I paraphrase):
A Deflationary Crash and Depression is Imminent
Deflation requires a precondition: a major societal buildup in the extension of credit and its flip side, the assumption of debt. Credit expansion continues as long as there are those willing to lend and borrow and there is the general ability of borrowers to pay interest and principal. These components depend upon whether both creditors and debtors think that debtors will be able to pay, and the trend of production, which makes it either easier or harder in actuality for debtors to pay. So long as confidence and productivity increase, the supply of credit tends to expand. The expansion of credit ends when the desire or ability to sustain the trend can no longer be maintained. The supply of credit contracts as confidence and productivity decrease.
The social mood trend changes from optimism to pessimism when creditors, debtors, producers and consumers change their respective primary orientation from expansion to conservation. As creditors become more conservative, they slow their lending. As debtors and potential debtors become more conservative, they borrow less or not at all. As producers become more conservative, they reduce expansion plans. As consumers become more conservative, they save more and spend less. These behaviors reduce the 'velocity' of money, i.e. the speed with which it circulates to make purchases, thus putting downside pressure on prices.
At some point, a rising debt level requires so much energy to sustain - in terms of meeting interest payments.... chasing delinquent borrowers and writing off bad loans - that it slows overall economic performance. When this burden becomes too great for the economy to support the trend reverses causing reductions in lending, spending, and production which, in turn, cause debtors to earn less money with which to pay off their debts, so defaults rise.
Default and fear of default exacerbate the new trend in psychology, which in turn causes creditors to reduce lending further. A downward "spiral" begins, feeding on pessimism just as the previous boom fed optimism. The resulting cascade of debt liquidation is a deflationary crash. Debts are retired by paying them off, by "restructuring" or by default. In the first case, no value is lost; in the second, some value; in the third, all value. In desperately trying to raise cash to pay off loans, borrowers sell all kinds of assets to market - including stocks, bonds, commodities and real estate - causing their prices to plummet. (Sound familiar? It should because such behavior is unfolding as you read this very article!) The process ends only after the supply of credit falls to a level at which it is collateralized acceptably to the surviving creditors.
Editor's note: Where are we at this point in time? Let's take a look again at the various stages of decline to determine where we are:
Stage one
The major banks of the world major are concerned that any credit obligations that they were to enter into with other banks would not be honored because of the unknown extent of toxic assets (such as derivatives and sub-prime Mortgage Backed Securities) on their books - as was/is the case on their own books.
This, in turn, has caused them to go from an expansion mode to a conservation mode resulting in a credit crisis such as we currently are experiencing.
Stage two
The major banks' refusal to lend money to business has caused, or is causing, business to go from an expansion mode to a conservative mode which has, in turn, adversely affected the trend of production.
This is evidenced by the 6.2% seasonally adjusted annualized decline in GDP during the 4th Qtr. of 2008 which was the worst decline since a 6.4% decrease in the 1st qtr of 1982. To make matters worse, economists don't expect any relief in the current quarter, which ends March 31st, projecting a further -4.8% annualized rate which would be the first time since 1947 that the GDP has fallen by more than 4% for two quarters in a row.
Stage three
a) The reduction in production by business has, in turn, led to or is leading to, over-capacity which has increased employee layoffs.
Indeed, unemployment soared to 8.1% in February, the highest rate in over 25 years. The consensus of private forecasters is for the unemployment rate to get close to 9% in 2010 with some forecasters suggesting a 10% rate. The Federal Reserve, itself, doesn't expect the unemployment rate to fall below 7% until 2011.
b) The increase in unemployment has, in turn, reduced the affected consumers' ability to buy goods and services.
c) The consumers' inability to buy goods and services has, in turn, reduced company sales and profits.
d) The reduction in company sales and profits has, in turn, caused the price of their stock to decline.
e) The lack of easy credit and/or loss of employment has meant that home "owners" (i.e. mortgagees in some degree of co-ownership with whichever financial institution holds their mortgage) have not been able, in increasing numbers, to re-finance and/or afford to re-finance their mortgages and, as such, have not been able to make their escalating monthly mortgage payments which have, in turn, led to a record high number of mortgage foreclosures.
Indeed, as of the end of 2008 12% of Americans with a mortgage were at least 1 month late or in foreclosure which was up from 8% a year earlier. Even worse, a stunning 48% of home "owners" who have sub-prime, adjustable-rate mortgages are currently behind in their payments or in foreclosure which, in turn, has resulted in ever more distressed house sales by the mortgagors and other neighborhood homeowners with, or without, a mortgage.
Stage four
The dire economic scene (fear of loss of job, loss of money invested in the stock market, reduced resale value of their house, etc.) has seen, in turn,
a) a major increase in savings (the personal savings rate rose by 5.0% in January, the highest rate since 1995)
b) a reduction in spending (it dropped 0.2% in December)
c) a reduction in the sale of goods and services
d) a decline in the price of such goods and services (as evidenced by the U.S. GDP Price Index which declined by 0.1% on a quarter-over-quarter annualized basis in the 4th Qtr of 2008 - the 1st decline since 1954 - and supporting the Fed's obtuse view that "inflation pressures will remain subdued in coming quarters." That tells us that deflation is imminent.
Stage five
We are going to see a self-reinforcing escalating vicious cycle of stage two, stage three and stage four over and over again. The downward "spiral' is in progress.
So there you have it! We are in the early weeks of stage five. As such, it is fully understandable why the governments of the world are throwing money at the credit problem so excessively in an attempt to get the wheels of industry turning to stem the decline before it takes hold. It is an extremely dire situation with no end in sight at the moment.
Gold and Silver Beginning a Decline to Under $680 and $8.39 respectively
Gold and silver will fall into their final dollar price lows at the bottom of the deflation...after which time these metals should soar in price. Given the likely political inflationary forces following the period of deflation the rebound could be much stronger than anticipated so owning precious metals prior to the onset of the post-depression recovery is desirable.
Should you buy gold and silver now? If you are willing to accept the dollar value of the precious metals dropping another 30% ($680 gold represents a 26% decline from the early March 16, 2009 price of approximately $923) or more before they rise substantially....but are willing, nevertheless, to pay such a price for its current availability and for the 'insurance' of greater portfolio stability under an unexpected inflation scenario, then the answer is yes.
The above being said, it is probably not as good an idea to invest in gold stocks because in common stock bear markets stocks of gold mining companies usually go down with the overall market trend except in relatively rare 5 to 10- year periods of accelerating inflation. As such, in this early stage of deflation gold mines will enjoy no false advantage over any other companies. Their stocks will probably rally when the overall stock market rallies. Owning gold shares is fine at the top of the Kondratieff economic cycle when inflation is raging and political tensions are their most severe.
DJIA Should Fall Below 777
The Dow Jones Industrial Average will go down to at least 1000, most likely to below 777 which was the starting point of its mania back in August 1982, and quite likely drop below 400 at one or more times during the bear market.
Editor's note: To Prechter's credit he acknowledges that these aforementioned forecasts are considered to be impossible by virtually everyone. He is of the opinion that the price swings will be dramatic over the course of the decline - as evidenced by recent swings in the Dow 30 from 11,723 on Jan.14th, 2000 to 7286 on Oct.9th, 2002 (-37.8%); to 14,165 on Oct.9th, 2007 (+94.4%); to 6594 as of March 5th, 2009 (-53.4%) - providing phenomenal investment returns to the successful long term in-and-out investor. Even short term in-and-out investors can profit considerably from the current market volatility as the market swings up and down (October '08 low of 7774 to a November '08 high of 9654 (+24.2%), to a late November '08 low of 7449 (-22.8%), to a January '09 high of 9088 (+22.0%): to an early March '09 low of 6594 (-27.4%). Is another 20% to 25% increase about to occur in the very near future (i.e. to approx. 8250) followed by an even lower low of 25% to 30% (i.e. to 6000 or so)? Only time will tell but Prechter sees money to be made during such times for those astute and fortunate investors who choose not to park their money in some form of cash or just 'buy and hold' as so many financial/investment advisors are so prone to recommend.
U.S. Dollar Index to Continue to Rise
It is important to make a distinction between the dollar's domestic and international values. In a deflation, the value of any currency - the U.S. dollar, in this case - rises domestically while the USD's international value, as represented by the U.S. Dollar Index, can rise or fall relative to other currencies in a deflation. In a time of financial crisis, however, the U.S. dollar is considered to be a safe-haven currency. This time is no exception, particularly given that the Euro, a major component of the USD Index, is going through extremely trying times itself. As the deflationary depression proceeds over the next few years demand for U.S. dollars should increase even further. In such a deflationary environment, where a strong dollar still persists, you want to be in safe cash equivalents such as U.S. T-bills.
Treasury Bonds are in a Bear Market
The 10-year Treasury note yield has been in a sharp decline since the early '80s when it reached 15.84% at the height of inflation and is at a deflationary level of 2.89% as of March 13, 2009. The gargantuan government bond issuance to fund the U.S. debt bubble, however, may push yields, which move inversely to prices, steeply higher in the years ahead.
Prechter has been quoted as saying "The reason that I remain willing to express my unconventional view is that I believe that my ideas of finance and macroeconomics are correct and the conventional ones are wrong. True, wave analysts make mistakes, but they also make stunningly accurate long-term forecasts." Updates to Prechter's insights and predictions on all asset classes can be found at www.elliottwave.com. I encourage those readers who have found his above forecasts and investment advice to be informative to buy Prechter's books for a more in-depth read and understanding of the basis for his making such projections of future events with such confidence.
What is so intriguing here is that Messrs. Dent and Napier, using totally different analytical approaches, have come to much the same conclusions as Prechter. Again, when analysts with different approaches to a situation agree, more or less, with the outcome it is something to take very seriously indeed. And such is the case here!
If you still need to be convinced that extremely difficult times are ahead and that action must be taken please refer to www.kiplinger.com/features/archives/2008/12/they_were_right_08.html for an article entitled "They Called it Right (Plus Predictions for 2009)". This article reviews the correct predictions of 8 noted investors, analysts and academics for the year 2008 and their outlook for 2009. The individuals are: Nouriel Roubini, Peter Schiff, Meredith Whitney, David Tice, Jeremy Grantham, Robert Shiller, Bob Rodriguez/Tom Atteberry and Mark Kiesel. Their forecasts are much more general than those of Dent, Napier and Prechter but clearly indicate what is in store for us in 2009 and beyond.
In summary, we are being forewarned yet again about yet another economic and financial crisis coming down the pike. This time don't get burned as you most likely did during the Credit Crisis and Crash of '08. Instead, position what is left of your portfolio such that you will actually prosper during this ongoing financial hurricane. Now that you know what is about to happen, take action, now! To just hope that everything will turn out okay would be downright foolish.
Weekly look at the SPX:VXO ratio: http://investorshub.advfn.com/boards/read_msg.aspx?message_id=36123853
Lower Prices to come:
http://www.financialsense.com/fsu/editorials/walayat/2009/0225.html
TREND ANALYSIS - Many stock market analysts that have been banking on a rally from January into April have been painfully proved wrong, as the bear market reasserted itself by busting through the November 7449 low on the DJIA. The markets attempts at rallying during late January and early February proved feeble, as correctly anticipated in the original forecast (20th Jan 09). This area of indecision now creates a resistance area for the stock market of between 8400 and 7,900 which is likely to contain any bounce so as to maintain the strongly bearish stock market trend.
PRICE TARGETS - The Dow has breached the 2003 low of 7197 which is bearish and confirms lower prices, longer range support exists at 6,400 and heavy support at 5700. Which implies that there is not much support on the way down to 6,400, a break of which would target a trend to below 6,000 for overshoot to 5,700. On the upside targets as illustrated above are contained by the consolidation area of 7900 to 8400 and therefore projects to a target price point of 7,900 to 8,100.
MACD - The MACD indicator has again turned lower, however it does support the original analysis of a significant low in the making by mid year, in that the February decline has not resulted in a significant breakdown on the MACD indicator which to me strongly suggests that the MACD is heading to make a higher low during mid 2009. I.e. a strongly bullish long-term signal.
SEASONAL TREND - The seasonal tendency is for the stock market to rally into late April / early May. This therefore could support a corrective rally from current levels for the stock indices, i.e. setting the market up for the final push lower into July.
ELLIOTT WAVE THEORY - My interpretation of Elliott wave theory implies that stock market has begun its 5th Major Wave lower of which the current impulse wave lower counts as wave 1, time wise this targets a decline for another 5 months which confirms the original forecast for a July 2009 low. However price wise EW targets much lower prices than the original target of 6,600 therefore there exists a strong probability of the Dow now busting below 6,600, slicing through 6000 enroute to the revised target of 5,700. which would represents a decline of about 23% on the last close. On a longer-term basis this interpretation also implies the bull market that starts in mid 2009 may now prove to be corrective, which will be come much clearer during the second half of 2009.
DJIA Forecast Update Conclusion
The above analysis confirms the bear market trend into mid July 2009. However it is increasingly unlikely that DJIA 6,600 will hold and therefore the bear market is targeting a trend towards a break of the lower target of 6,000. The anticipated trend is as illustrated in the below graph as after possible further immediate term selling is for the DJIA to target a rally to resistance of 7,900 and thereafter resumption of the bear trend to below 6000. However my longer term forecast of a multi-year bull run 'so far' still stands as after the bankrupt financial stocks have reached total wipeout, well there is not much further lower that the markets can be dragged following the July lows as evidenced by the Nasdaq's relative strength due to the fact it contains no financial stocks.
Posting McLaren's latest here.
http://www.mclarenreport.net.au/articles/articles/195/1/October-29-2008-CNBC-PowerLunch-Europe/Page1.html
There are a number of indexes that appear to be setup for a low being in place or the next new low will be THE low. It would actually be a “perfect setup” from the analysis of this pattern of trend if there was one more new low to the move down. Just one more day up and two days down to a new low would set in the low we have been forecasting to occur this week. But sometimes the perfect doesn’t appear so there is a good chance this could be a solid low for an intermediate term counter trend rally of 60 or more likely 90 calendar days. The very significant factor has been the ability of the index to move above the low of the 16th. The NASDAQ 100 and the MIDCAP 400 have this same pattern of trend.
NOW LET’S LOOK AT THE S&P 500 INDEX
I am very disappointed this index did not go to a new low yesterday as that would have really set this low up well. But I’ve been saying this week was going to bring in a low and I haven’t changed my mind. There are only two options now it either moves to a marginal new low and then runs to 1060/1070 and corrects or continues up from yesterday to the same price level and corrects. Either way the index will likely run out 90 days of rally before the downtrend will resume. So by next week we’ll know for sure which of the two scenarios will have played out and the index will be trending up. I don’t believe this is the end of the bear campaign but it the end of playing the short side for a while. There will be a lot of traders selling into this rally as that has been the successful strategy for some time. If there is one more two or three day move down it would be a good opportunity for the long side but either way the risk is now on the short side.
LET’S LOOK AT THE FTSE 100
It doesn’t matter which index the FTSE, DAX or CAC 40 all have the same pattern of trending and the same exact probability. There was the exhaustion low followed by a marginal new low. This was followed by a second new low and this rally has moved above that second new low. Thus indicating this trend is struggling down. It presents the same circumstance either a solid low is in place or there may be one more marginal new low for the very high probability of sitting in a low and the start of an intermediate term counter trend rally. If this rally can exceed three days the low is in place.
There are a few commodities that are also starting to look like a bounce is possible.
There never was a moment, and never will be, when we are without the power to alter our destiny. This second, we can turn the tables on Resistance. This second, we can sit down and do our work.
Hmmm, not so fast.
Looks like option A won.
Two ways you can look at this chart. Either a bullish divergence (Lower prices, but higher NYSI.) or, we have sooooo much farther to fall!
http://stockcharts.com/h-sc/ui?s=$NYSI&p=D&yr=0&mn=6&dy=0&id=p36257148787
Foot's Trend Finder chart. I don't know what it is or how it works, but it seems to work!
http://investorshub.advfn.com/boards/read_msg.aspx?message_id=32218030
Bullish divergences abound on the NDX --
http://stockcharts.com/h-sc/ui?s=$NDXA50R&p=D&yr=0&mn=6&dy=0&id=p63276388518
http://stockcharts.com/h-sc/ui?s=$BPNDX&p=D&yr=0&mn=6&dy=0&id=p63276388518
Lower price lows, and higher $NDXA50R and the $BPNDX as well.
Another sort of divergence -- the small caps have held up very well in this weeks sell off. Did not get anywhere near the July lows. This is a positive for the markets. Smaller cap companies tend to have a more difficult time raising money and getting loans when the economy is weak. When there is relative strength in small caps, the economy is not as bad as "we" think.
http://stockcharts.com/h-sc/ui?s=$NDXA50R&p=D&yr=0&mn=6&dy=0&id=p95590132733
NYA, ugly price action, but stronger internals as well: http://stockcharts.com/h-sc/ui?s=$BPNYA&p=D&yr=0&mn=6&dy=0&id=p28923128376
http://stockcharts.com/h-sc/ui?s=$NYA50R&p=D&yr=0&mn=6&dy=0&id=p28923128376
BKX even better -- the BKX did not even breach its Aug low, while the RUT did. Happy days are here again!!
http://stockcharts.com/h-sc/ui?s=$BKX&p=D&yr=0&mn=6&dy=0&id=p95590132733
And besides SPX:VXO, another way to look at the trend:
NYSI: http://stockcharts.com/h-sc/ui?s=$NYSI&p=D&yr=0&mn=6&dy=0&id=p96864866486
NASI: http://stockcharts.com/h-sc/ui?s=$NASI&p=D&b=5&g=0&id=p65120742578
There never was a moment, and never will be, when we are without the power to alter our destiny. This second, we can turn the tables on Resistance. This second, we can sit down and do our work.
THanks, have a good evening.
Ya did it do it's thing yesterday on my "B" day and I was out B ing around town LOL.
Thank you for the chart.
Ok have a wonderful day.
$SPX:$VXO still doing its thing.
http://investorshub.advfn.com/boards/read_msg.aspx?message_id=23876528
NYSI
http://stockcharts.com/h-sc/ui?s=$NYSI&p=D&yr=0&mn=6&dy=0&id=p03055176539
Try NASI also.
BKX:SPX Since the banks lead, this is probably another good one to watch.
http://stockcharts.com/h-sc/ui?s=$BKX:$SPX&p=D&yr=0&mn=6&dy=0&id=p35442683556
And the small caps are said to lead also.
http://stockcharts.com/h-sc/ui?s=$RUT:$SPX&p=D&yr=0&mn=6&dy=0&id=p19598342468
SPX:VXO MACD crossed up in November:
http://investorshub.advfn.com/boards/read_msg.asp?message_id=23876528
That's great gloe. I use NDX/VXN with Bollinger Bands & Stochastics on all time frames up to day. I have never looked at MACD. It occurs to me that vxo would be a better indicator than the vix for the spx because the oex option players are considered 'smart money'. IB has a webinar at 4:30 EST today entitled CME - Swing Highs and Swing Lows: Are We There Yet? You may be interested.
Found it. SPX:VXO. Top picker. Notice the MACD cross down week of Oct 8th. (MACD crossed back up from the summer sell off the 3rd week in Aug. Unfortunately, there was a sloppy top in June/July).
http://investorshub.advfn.com/boards/read_msg.asp?message_id=23607284
Here's late 2005 to early 2006:
http://stockcharts.com/h-sc/ui?s=$SPX:$VXO&p=D&st=2005-10-21&en=2006-03-21&id=p43908...
A collection of charts and notes on the BIG picture. So I remember to look.
My Blog: http://glorytrades.blogspot.com/
Incomplete List of index and indicator charts http://www.trending123.com/index/
For a very complete list, go directly to stockcharts.com and search for the symbol "$". If the SP symbols don't come up, search again for "$SP"
Cycles: http://www.investorshub.com/boards/read_msg.asp?message_id=16264316 2/27/07 identified as the next cycle top.
I want to collect the links to all the different "tells" for market trend direction here. The Summation Indices; the BP indices: the Index:Volatility charts; and the Percent above 50 MA indices. I keep getting them lost in posts. 
Breadth Indicator: http://stockcharts.com/h-sc/ui?s=$NYAD&p=D&yr=0&mn=6&dy=0&id=p21412390974
Trend finders:$NDXA50R $BPNDX $NASI $NDX:$VXN $BPNYA
$SPXA50R; $BPSPX; $NYSI (don't have one for SPX?); $SPX:$VXO
http://stockcharts.com/h-sc/ui?s=$NASI&p=D&yr=0&mn=6&dy=0&id=p55405337048
a different view of the NASI: http://stockcharts.com/h-sc/ui?s=$NASI&p=D&yr=0&mn=6&dy=0&id=p09126389824&a=153380860
http://stockcharts.com/h-sc/ui?s=$BPCOMPQ&p=D&yr=0&mn=6&dy=0&id=p63276388518
http://stockcharts.com/h-sc/ui?s=$NDX:$VXN&p=D&yr=0&mn=6&dy=0&id=p45673669706
http://stockcharts.com/h-sc/ui?s=$VIX:$VXV&p=D&yr=0&mn=6&dy=0&id=p34584423371
Two views of NYSI: http://stockcharts.com/h-sc/ui?s=$NYSI&p=D&yr=0&mn=6&dy=0&id=p35833172763
This one based on Foot's chart: http://stockcharts.com/h-sc/ui?s=$NYSI&p=D&yr=1&mn=0&dy=0&id=p75399844370
http://investorshub.advfn.com/boards/read_msg.aspx?message_id=35950537
http://stockcharts.com/h-sc/ui?s=$BPSPX&p=D&yr=0&mn=6&dy=0&id=p63276388518
SPX:VXO go here: http://investorshub.advfn.com/boards/read_msg.aspx?message_id=23876528
http://stockcharts.com/h-sc/ui?s=$RUT:$RVX&p=D&yr=0&mn=6&dy=0&id=p57524880609
NYAD breadth oscillator (with NYAD invisible, showing only the MAs; Mamis-Meisler use the 10 SMA; I am using 10 ema cross 30 SMA):
http://stockcharts.com/h-sc/ui?s=$NYAD&p=D&yr=0&mn=3&dy=0&id=p67877040310
Daily VIX and VXN (RVX as well but it is whippier) with 20 CCI. Cross check the other charts with these for the CCI to cross the zero line.
http://stockcharts.com/h-sc/ui?s=$VXN&p=D&yr=0&mn=6&dy=0&id=p09126389824
http://stockcharts.com/h-sc/ui?s=$VIX&p=D&yr=0&mn=6&dy=0&id=p01939788787
Risk Appetite: Emerging markets relative to the DJ world index:
http://stockcharts.com/h-sc/ui?s=$MSEMF:$DJW&p=D&yr=1&mn=0&dy=0&id=p57237750023
Small caps lead: http://stockcharts.com/h-sc/ui?s=$RUT:$SPX&p=D&yr=0&mn=3&dy=0&id=p76090031787
Extreme lows in this usually lead to moves up: http://stockcharts.com/h-sc/ui?s=$NYUPV:$NYTV&p=D&yr=0&mn=6&dy=0&id=p07479356074
| Volume | |
| Day Range: | |
| Bid Price | |
| Ask Price | |
| Last Trade Time: |