 News
News  Market Data
  Discover
Support: 888-992-3836
Copyright © 2023 InvestorsHub Inc.


Register for free to join our community of investors and share your ideas. You will also get access to streaming quotes, interactive charts, trades, portfolio, live options flow and more tools.
Conclusions
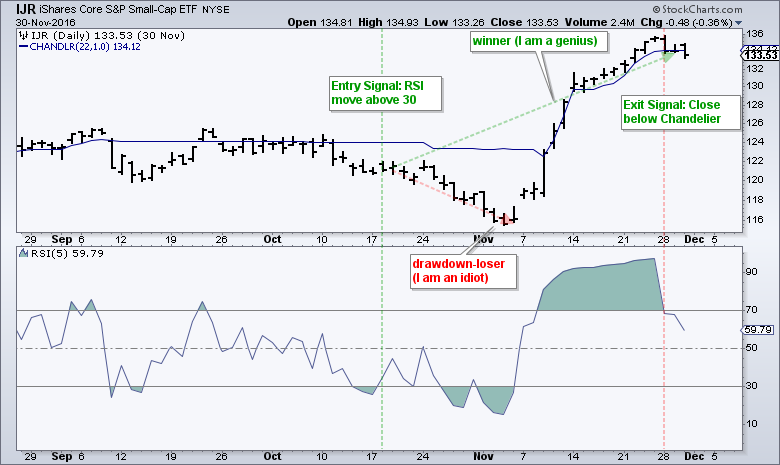
The table below shows two system tests from last week and two from this week. Overall, I am impressed with the IJR system that waits for RSI to cross above 30 and then uses the Chandelier Exit (22,1). The last row highlights this system with the second highest CAR, the second lowest MDD, the second highest exposure and the highest CAR/MDD ratio. It does, however, have the lowest gain/loss ratio, but the winning percentage is quite high. Over the 16 year test period, this particular system generated 80 trades and was in the market 35% of the time (5.6 years or 67.2 months). It is not a full-time system.

Even though the results for IJR look pretty good, keep in mind that past performance does not guarantee future performance. Also keep in mind that this system will perform differently for other ETFs and stocks. The results based on taking EVERY trade and STICKING with the system, which can be hard in real life. The chart below shows IJR with an entry signal on October 18th and subsequent 4.8% decline (drawdown). There are no stops and this system does not even consider an exit until price moves above the Chandelier, which occurred right after the election. The exit triggered on 28-Nov and IJR advanced another 3-5% afterwards. The system is far from perfect, but neither are traders.
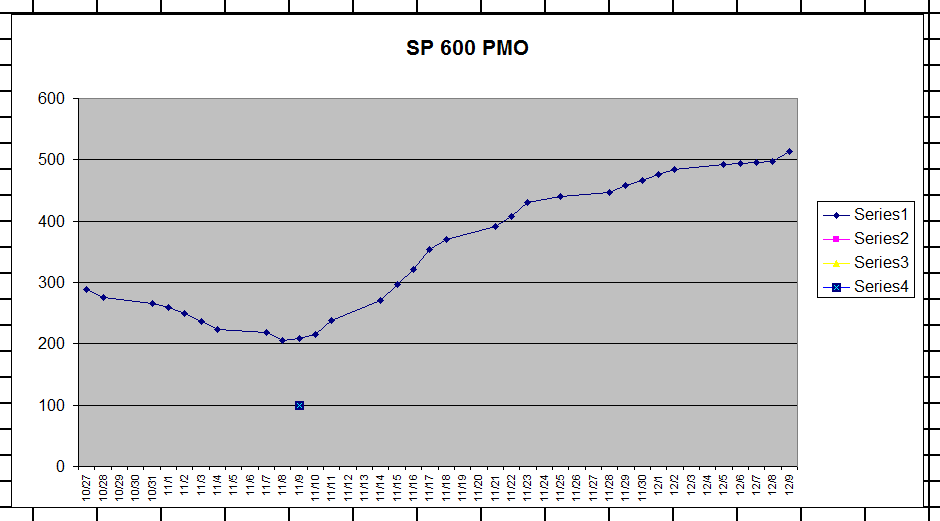
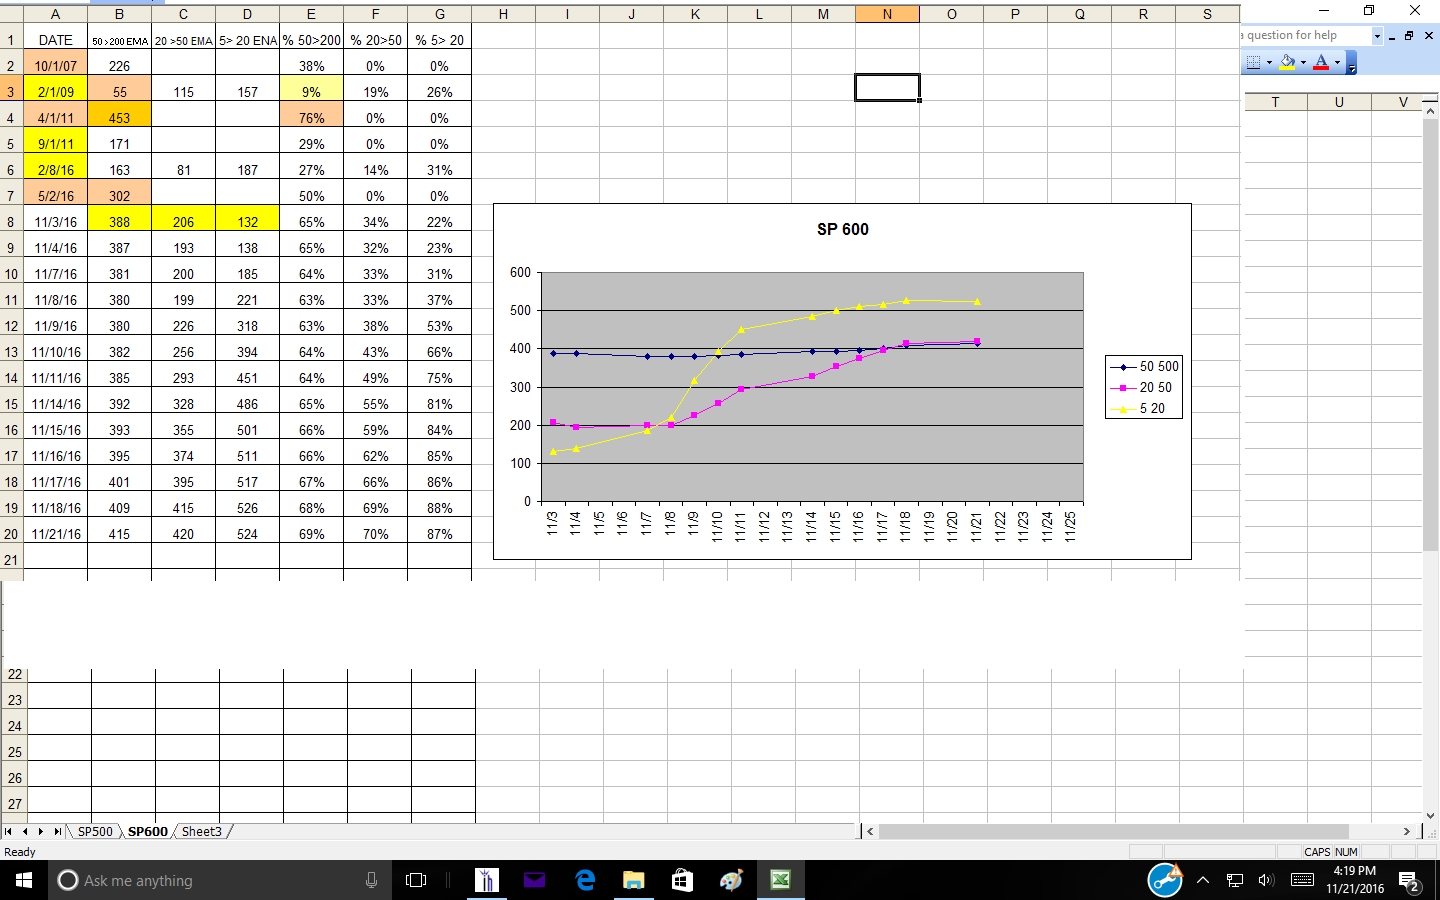
ALL SP 600 STOCKS WITH PMO > 0
2/8/16 WAS 82
Supply Continues to Shrink
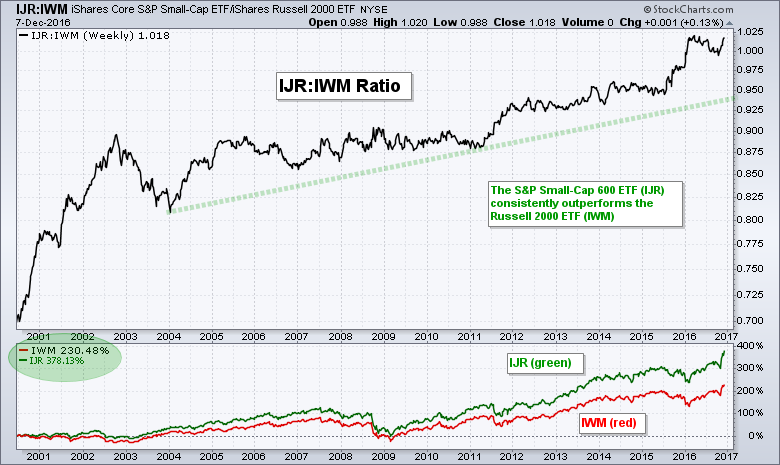
I found a FTSE Russell document from June 2016 that pegs the total market capitalization of the small-cap Russell 2000 at $1.9 trillion and the large-cap Russell 1000 at $22.1 trillion. Together, these two form the Russell 3000 (market cap $24 trillion) and this index covers around 98% of the total US stock market. This means the Russell 2000 accounts for around 8% of the Russell 3000. This document also notes a decrease in market cap from 2015 to 2016. The total market cap of the Russell 1000 decreased 4% and the total market cap of the Russell 2000 decreased 14%. This means the supply of available stock decreased.
ALSO IJR GREATR THEN IWM
Charting 52-week Highs on SPY by ART HILL
The S&P 500 is the most important benchmark for the stock market and the long-term trend is clearly up. This means we are in a bull market. This weekly candlestick chart shows the 40-week EMA in red, 52-week price channels in gray and the PPO(10,40,1) in the indicator window. SPY turned bullish in March with the breakout, close above the 40-week EMA and positive PPO (green dashed lines). The ETF also recorded a 52-week high with a move above the 52-week Price Channel in mid April. The upper line marks a 52-week high, the lower line marks a 52-week low and the middle line (dashed) is the average of the two. A move above the upper line denotes a 52-week high, while a move below the lower line marks a 52-week low.
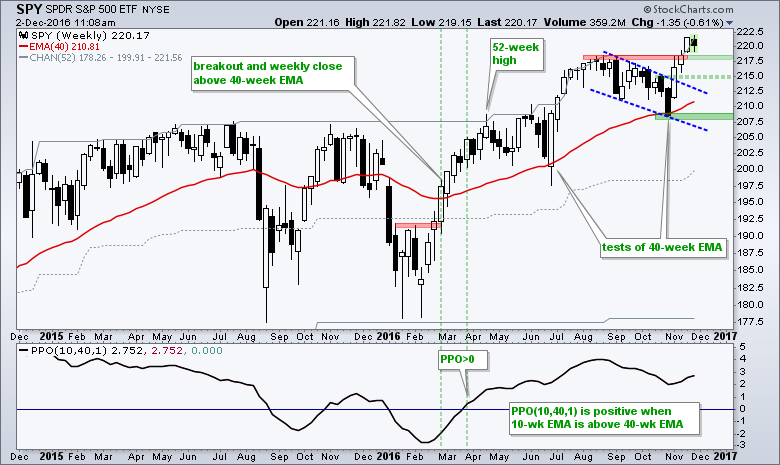
We can debate overbought readings and the validity of the breakout, but I do not think we can debate the overall trend (up). I will remain long-term bullish on the broader market as long as 208 holds on a closing basis and the PPO remains positive. At this point, I am looking to identify levels where SPY could reverse after a pullback, which everyone seems to be waiting for. Broken resistance marks the first area around 218 and the channel breakout marks the second area around 215. Perhaps a reversal will materialize between 215 and 218 if we see a pullback.
The Overbought Progression BY ART HILL
Lots of traders and investors are looking for a pullback. However, the pullback crowd has been waiting since mid November because the major index ETFs became overbought two weeks ago. The chart below shows the Russell 2000 iShares (IWM) with 5-day, 10-day and 14-day RSI to illustrate the overbought progression. 5-day RSI became overbought first with a move above 70 on 9-Nov, 10-day RSI followed with a move above 70 on 11-Nov and 14-day RSI became overbought on 14-Nov. The ETF is up 3.7% since 14-day RSI became "overbought" and remains "overbought". Clearly, overbought is not as clear-cut as it seems.
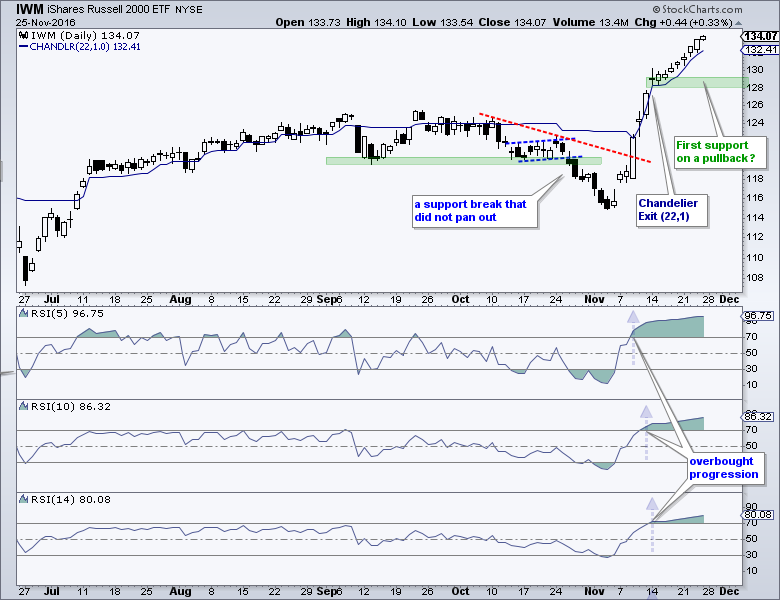
Identifying overbought conditions is the easy part. It is much harder to time a pullback, especially when the bigger trend is up and a buying binge is underway. At this point I am not interested in bearish setups, bearish signals or trying to make money on a pullback. Instead, I would simply trail stop-losses on short-term positions using a Chandelier Exit and hold existing long-term positions. A pullback, when and if it does occur, will provide the next bullish setup or signal. Whatever you do, make sure to plan your trade first and then trade your plan! Here is a recent article on finding pullbacks and upturns within a bigger uptrend. The chart below shows SPY with first support marked in the 218 area.

For every stock in the SP 600
Note line 3 for 2/1/2009 they were only 55 stocks in the SP 600 where the 50 was above 200 EMA
BY ART HILL XLK
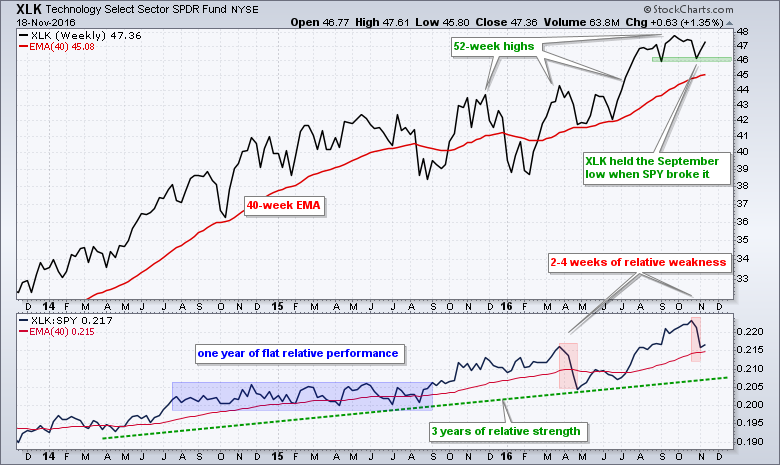
Despite relative weakness the last few weeks, XLK remains in a clear uptrend and shows no signs of weakness on the price chart. First, note that XLK recorded 52-week highs throughout 2016 and is currently less than 2% from a new high. Second, XLK held the September low when the market swooned and SPY broke its September low. Third, XLK is showing signs of life with a surge off the support zone at 46.
--------------------------------------------------------------------------------
The lower window shows the price relative, which is the XLK:SPY ratio. Overall, XLK outperformed SPY for over three years because this ratio rose. The blue rectangle shows a long period of flat relative performance because the ratio moved sideways. The red areas show short and sharp pullbacks in April 2016 and October 2016. I would not read to much into the most recent pullback because the overall trend is clear up and this is the dominant force at work.
50 ABOVE 200 EMA
SEE FEB 2009 = 3%
AND APRIL 2011=89%

2/8/16 Last low in stock market = 50 above 200 EMA = 168 = 33%
Interesting 1/3 to 2/3
11/3/16 Last top in TZA = NOV 3 = 50 above 200 ema in SP500 =338 = 68% SAME AS TODAY 11/17/16
Conclusion It is still a BULL market
11/17/16 SP500 50 ABOVE 200 EMA = 341 = 68%
Trading with MACD-Histogram and RSI
The Industrials SPDR (XLI) is another sector that surged and became short-term overbought. Instead of the PPO, I am showing this chart with the MACD Histogram (5,30,5) and RSI(5). The overall trend is up because the 50-day EMA has been above the 200-day EMA since late March and XLI started hitting 52-week highs in April. This bigger uptrend meant that the decline from mid August to early November was a correction within an uptrend. Defining the bigger trend is very important because it sets my trading bias (bullish).
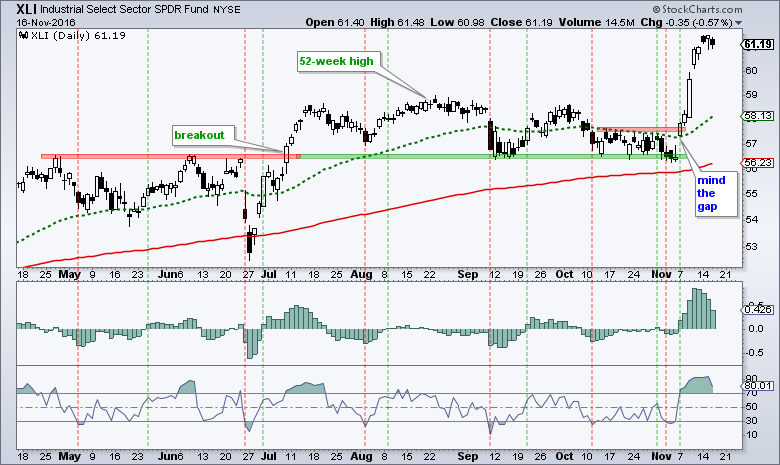
The MACD Histogram (5,30,5) measures the difference between MACD (5,30,5) and its signal line. Thus, the histogram turns positive when MACD moves above its signal line and negative when MACD moves below its signal line. This makes it easy to spot signal line crossovers. The red lines show when RSI(5) becomes oversold and the green lines mark a subsequent move into positive territory for the MACD Histogram. The signals are not perfect, but it is a strategy chartists can use to filter their trading universe. Note that the PPO and MACD are basically the same indicators. MACD measures the absolute difference between two EMAs and PPO measures the percentage difference between two EMAs.
11/16/16 TZA KEY POINTS TODAY
1 ...CANDLE NOT TOUCHING LOWER BAND ON DAY CHART.
2 ...CCI(20) ABOVE -200 ON DAY CHART.
HOME DEPOT BY ART HILL
Home Depot is the perfect cyclical stock because it sits at the crossroads of retail, housing and the consumer. The stock was a poster child of the bull market with a 200+ percent gain from 2013 to 2015. It did not stop there and even managed to hit new highs into 2016. More recently, HD fell on hard times the last few months with a move below the June low and relative weakness since May. Notice that the price relative peaked in May and the StockCharts Technical Rank (SCTR) has not been above 60 since early May.

Even though the current evidence is bearish, I am watching HD closely because it surged over 7% last week and quickly recovered after the lower low. This is potentially bullish price action because it created a "bear trap", which is essentially a failed support break. Even though the bear trap is positive, the stock has yet to follow through and remains an underperformer. I am looking for a weekly close above resistance at 131 for a breakout on the price chart and an SCTR move above 60 to signal a return to relative strength. Such a move would suggest that retail, housing and the consumer are back.
RUT 2000 FUTURES
1 UP TREND
2 BUT LOWER HIGH

0044 new highs last 5 days for 153 industries = 37 = 24%
new highs last 5 days for s&p 500 = 118 = 24 %
today = doji candle = Candlesticks and candlestick patterns are the foundation to trading in my view.
If you're a daytrader or swing trader, trading without the knowledge of reversing candlesticks is doing yourself a great disservice.
While not every uptrend or downtrend ends with a reversing candlestick, most reversing candlesticks do end a trend if a prior trend is in place.
by Tom Bowley
SPY DAY WITH !CVISPX
FOLLOW DP BOARD AT
http://investorshub.advfn.com/TRADING-DP-30267/
11/11/16 DP
Ultra-Short-Term Indicators: The climactic readings are not visible today, but the previous days' readings appeared to be a selling exhaustion. Something we picked up on this chart before the election. Now we are looking at a likely buying exhaustion as these climactic readings recede. Notice breadth is also not supporting this move as it has continued. The VIX still hasn't reached extremes which suggests there is possibly some more upside or at a minimum consolidation for the first part of next week.
CCI(20) < -200 AND BREAK TO UP SIDE ON DAILY TNA CHART SEEMS TO WORK THE BEST.
SP1500 3 BREADTH INDICATORS BY ART HILL
Indicators are Not Bearish until they Trigger
The broad market breadth indicators remain on a bullish signal since March and have yet to signal a bearish reversal. The chart below shows breadth indicators for the S&P 1500, which includes large-caps, mid-caps, small-caps, Nasdaq stocks and NYSE stocks. All major groups need to be present when measuring breadth. The signal levels are set to filter out noise and focus on significant shifts in participation. Breadth is net bullish when at least two of the three indicators are on bull signals (green lines) and net bearish when two of the three are on bear signals (red lines).
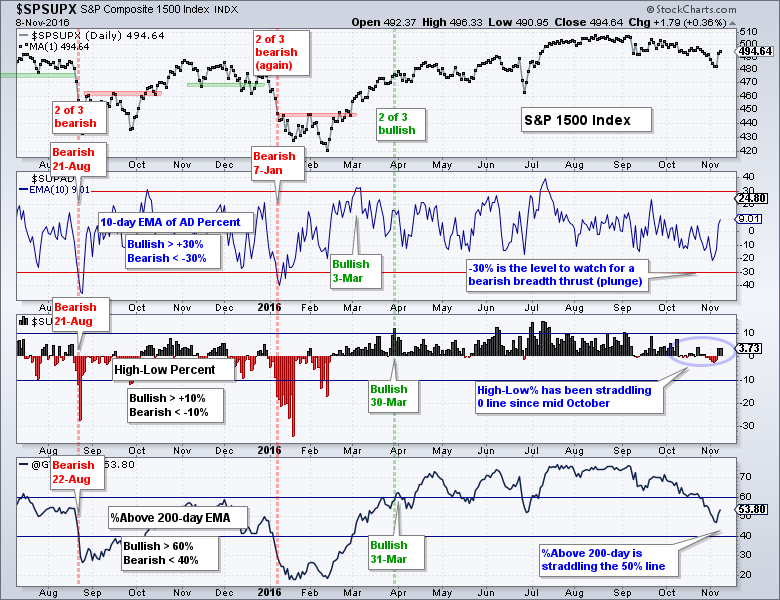
1 ...The 10-day EMA of AD Percent triggers bullish with a surge above +30% and bearish with a plunge below -30%. It is currently at +9% and far from a bearish signal.
2 .... High-Low Percent triggers bullish with a move above +10% and bearish with a move below -10%. It is currently at +3.73% and far from a bearish signal.
3 .... The %Above 200-day EMA triggers bullish with a move above 60% and bearish with a move below 40%. It is currently at 53.8% and also fairly far from a bearish signal.
Bottom Line: Regardless of recent events and the sharp drop in stock futures, the stock market remains in a bull market environment and I have yet to see any evidence to the contrary.
VIX BY ART HILL
The S&P 500 fell softly (~3%) over the last nine trading days and the S&P 500 Volatility Index ($VIX) surged over 70%. This surge puts $VIX at its highest level in over three months, but this is not necessarily bearish. VIX is a coincident indicator that moves opposite of stocks. This means it is supposed to move higher when stocks decline. From a contrarian perspective, these surges signal an increase in fear that could foreshadow a trough in the S&P 500. The trick is to measure this fear and today I will show a measuring technique using the PP
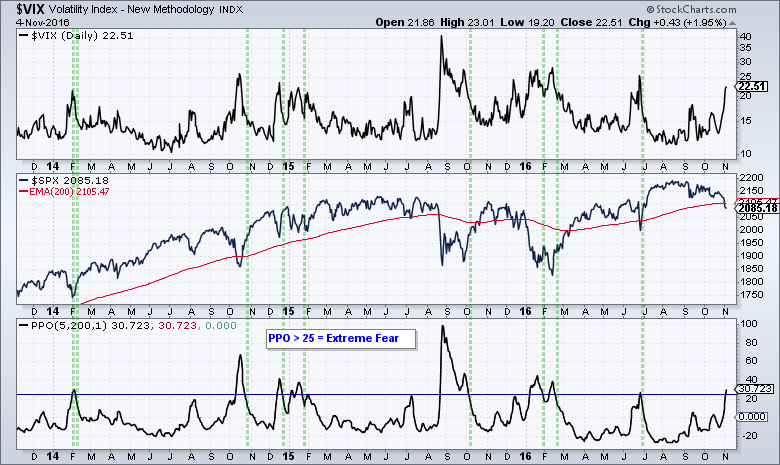
I think $VIX is best used as a mean-reversion type indicator because certain level of fear can lead foreshadow a reaction low (trough) in the S&P 500. Instead of using actual $VIX levels, I am applying the Percentage Price Oscillator (PPO) to "normalize" $VIX a bit. The bottom window shows the PPO(5,200,1), which measures the difference between the 5-day EMA and the 200-day EMA. $VIX signals extreme fear when the PPO moves above 25%, which means the 5-day EMA of $VIX is 25% higher than the 200-day EMA. The green vertical lines on the chart below show when the PPO moves back below 25%, which means fear is subsiding and the S&P 500 is turning up. A sustained bounce in stocks today could push the PPO back below 25%.
TRADING SECTORS
SEE
http://investorshub.advfn.com/boards/read_msg.aspx?message_id=126351614
VIX DAY is above 20 = bearish
|
Followers
|
164
|
Posters
|
|
|
Posts (Today)
|
0
|
Posts (Total)
|
17387
|
|
Created
|
07/03/08
|
Type
|
Free
|
| Moderators | |||
TADEING TNA AND TZA .... (1) No penny stocks (2) No Politics nor religion (3) No one who sells on
| Volume | |
| Day Range: | |
| Bid Price | |
| Ask Price | |
| Last Trade Time: |


