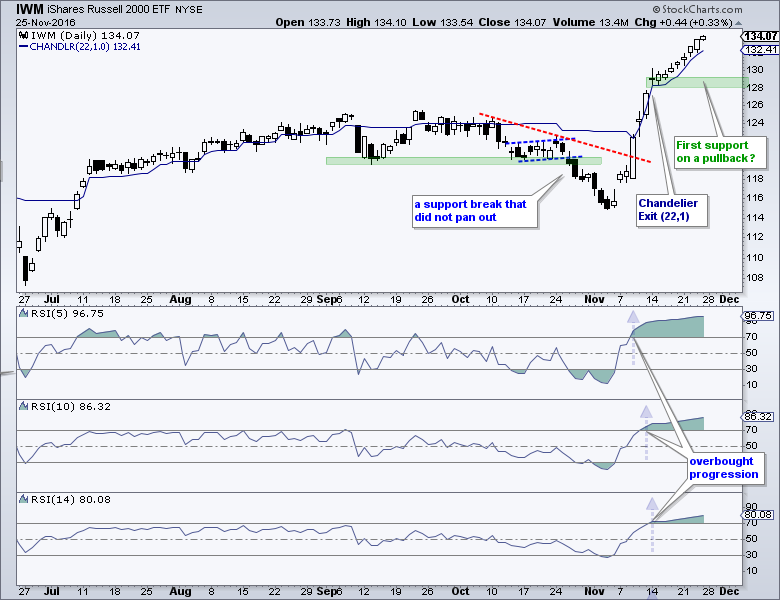
Lots of traders and investors are looking for a pullback. However, the pullback crowd has been waiting since mid November because the major index ETFs became overbought two weeks ago. The chart below shows the Russell 2000 iShares (IWM) with 5-day, 10-day and 14-day RSI to illustrate the overbought progression. 5-day RSI became overbought first with a move above 70 on 9-Nov, 10-day RSI followed with a move above 70 on 11-Nov and 14-day RSI became overbought on 14-Nov. The ETF is up 3.7% since 14-day RSI became "overbought" and remains "overbought". Clearly, overbought is not as clear-cut as it seems.
Identifying overbought conditions is the easy part. It is much harder to time a pullback, especially when the bigger trend is up and a buying binge is underway. At this point I am not interested in bearish setups, bearish signals or trying to make money on a pullback. Instead, I would simply trail stop-losses on short-term positions using a Chandelier Exit and hold existing long-term positions. A pullback, when and if it does occur, will provide the next bullish setup or signal. Whatever you do, make sure to plan your trade first and then trade your plan! Here is a recent article on finding pullbacks and upturns within a bigger uptrend. The chart below shows SPY with first support marked in the 218 area.
Register for free to join our community of investors and share your ideas. You will also get access to streaming quotes, interactive charts, trades, portfolio, live options flow and more tools.
 News
News  Market Data
  Discover