Register for free to join our community of investors and share your ideas. You will also get access to streaming quotes, interactive charts, trades, portfolio, live options flow and more tools.
thanks! '~6979~' . . great stuff and board.
keep it up !!
Hi Blasher, well said & you are right...There should always be the drop below foundation strike plan...
All of these things are calculated & weighed before any entry...
Not a whole lot of traders here have been interested in spreading options so I've been focusing on sharing directionals...
In time, when there are more traders here interested in Debit Spread LEAP's
I will put out a lot more content...
70% of all my trading are these Debit Spreads...I only trade 5% total allocation for directionals...
Blasher~"However, since correct market-action-direction forecasting is still necessary..."
Thanks for your comment Blasher...Thats what I like to hear... {Intelligent trade feedback & opinions}
~6979~ . . you forgot one more calculation you must do before entering this position . . .
Your "Ford drops below $12.50" Plan.
Forgetting option-price decay for the moment . . .
~F~ can drop to 12.50 - 0.57 = $11.93 and you would still break-even
BUT, you must also take into account option-price decay . . .
so after several months, if ~F~ were to drop to 11.93,
you would NOT be able to see the Jan 12.50 call @ 3.20 - 0.57 = $2.63
so you would actually fall below break-even.
BUT, you would have to factor in the Profits you have made during those several months . . .
so you would STILL be ahead of the game.
AND .. let's not forget that commissions would also be eating some of your Profits as well.
It does get to be complicated mathematically . . .
but if your underlying stock action is behaving, it is a nice longer-term plan.
However, since correct market-action-direction forecasting is still necessary,
I have chose to just Trade the straight directional Options/ETFs and get in/out of them as they are Profitable.
Good Board you have here !!!
thanks 4 letting us know. am following you & RT you. ![]()
@TA FAnaTicks: I will be posting mostly on the ScalpSwingStraddle board...
Unfortunately, I am way too active on the net to update so many boards...
I cannot allow posting to interfere with my trading so Im limiting the places that I post/share...Thanks for marking the board...
judging by the intraday action, looks like the hedge funds are dumping into the end of day POMO rally.
~AXL~ 11.13
sounds good bro
ty & of coarse backatcha
Hey man, feel free to post any set-up youd like...
Love the charts...Im still holding ~CREE~ btw...got a covered call on it now...Traded the options quite a few times already...Basis is down to $36-37 from $40.30-40.50
thx bro
nice look'n setup so i fig. i post it
happy trading
nice mtcinc0,
Small stock (37.6 mil) but definitely an eye catcher for a Double Bottom
~HRZ~
Double Bottom Reversal
The Double Bottom Reversal is a bullish reversal pattern typically found on bar charts, line charts and candlestick charts. As its name implies, the pattern is made up of two consecutive toughs that are roughly equal, with a moderate peak in-between. Note that a Double Bottom Reversal on a bar or line chart is completely different from Double Bottom Breakdown on a P&F chart. Namely, Double Bottom Breakdowns on P&F charts are bearish patterns that mark a downside support break.
http://stockcharts.com/school/doku.php?id=chart_school:chart_analysis:chart_patterns:double_bottom_revers
thanks...definitely a useful tool...
LUV the COT reports ~6979~, and you posting in full image format with notable observations is a powerful tool for many to note and use....
~S&P500 COT & Chart Update~ ...Power View...
Image #1:
Here we see the slow continuation of De-leveraging by asset managers...Hedge funds continue to decrease their long positions and slowly are increasing their short positions...The same goes for other big investors (Other-Reportables), a note about them is that they still have a massive short position relative to long positions...OR's also have a bigger short position than both Asset Managers and Hedge Funds...It's getting bigger every week for the last three weeks...Open interest is rising...
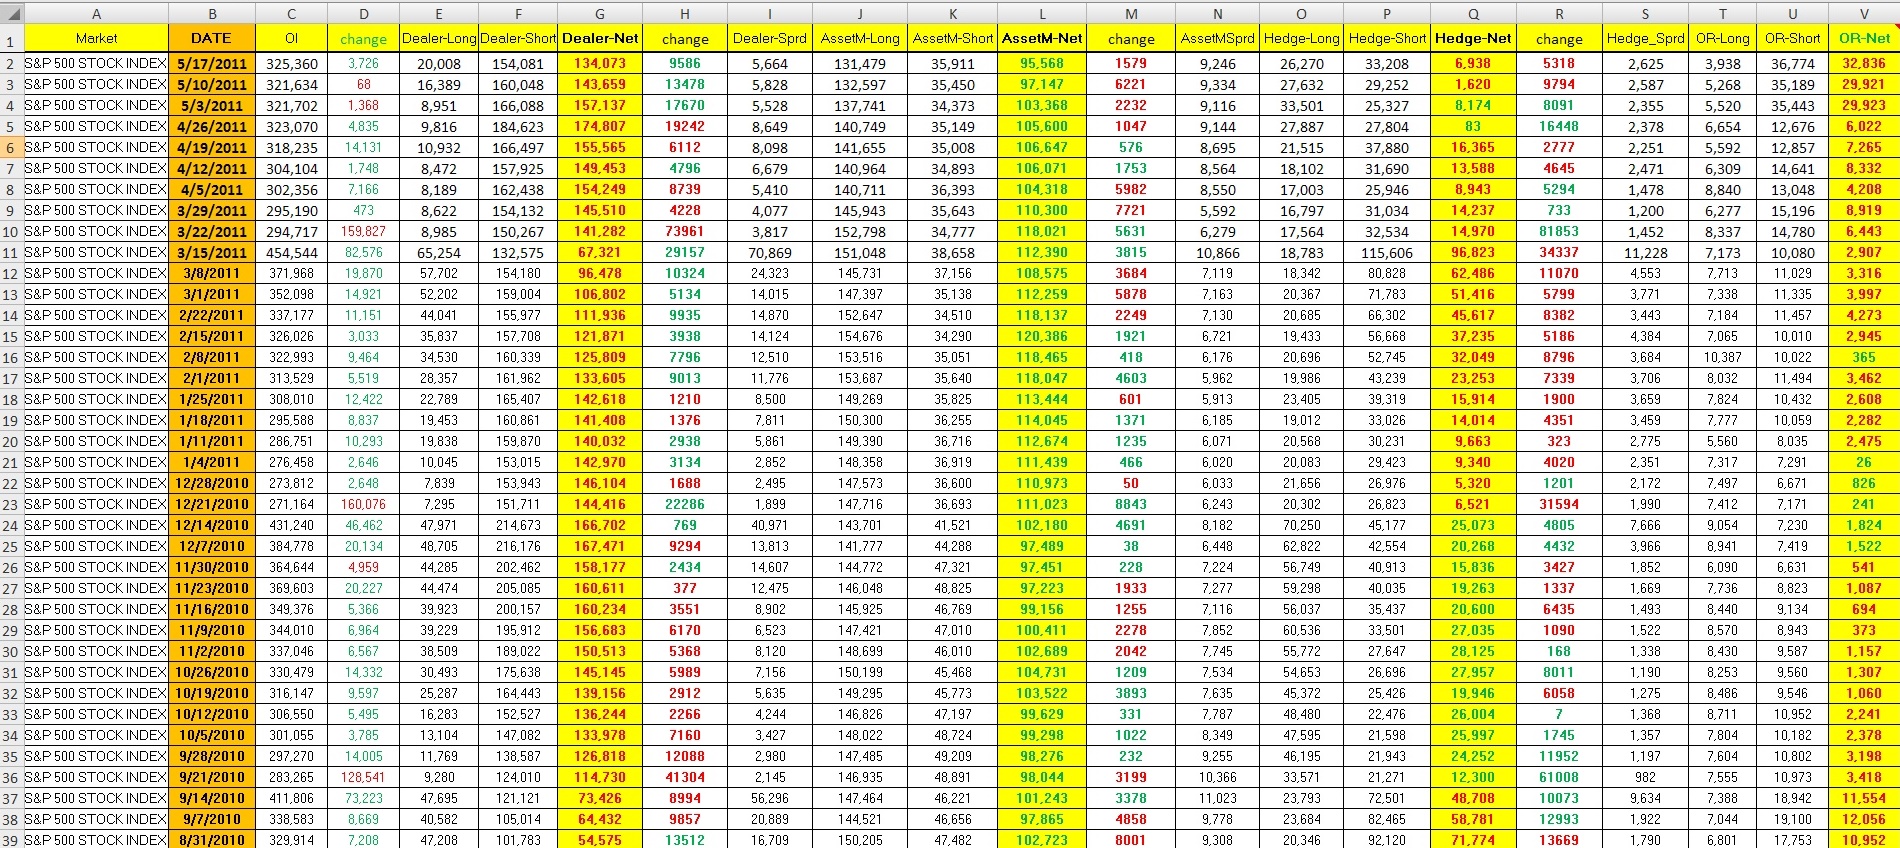
Image # 2:
Here we see the consolidated view of Net Positions...You can see that Large Investors (Asset Manager,Hedge Funds,and OR's) had another big drop this week...Net Long positions have been heavily decreasing for three straight weeks...Retail traders continue to increase their Net Long positions (buying the dip apparently)...This week they had a decent jump in Long positions but also increased their short positions a bit so the NET position only increased slightly...It's still an increase though...This is an excellent opportunity to see if "Fading the Little Guys" will be true in this market situation, as they are obviously going against the Larger Traders (supposedly the Smart Money)...
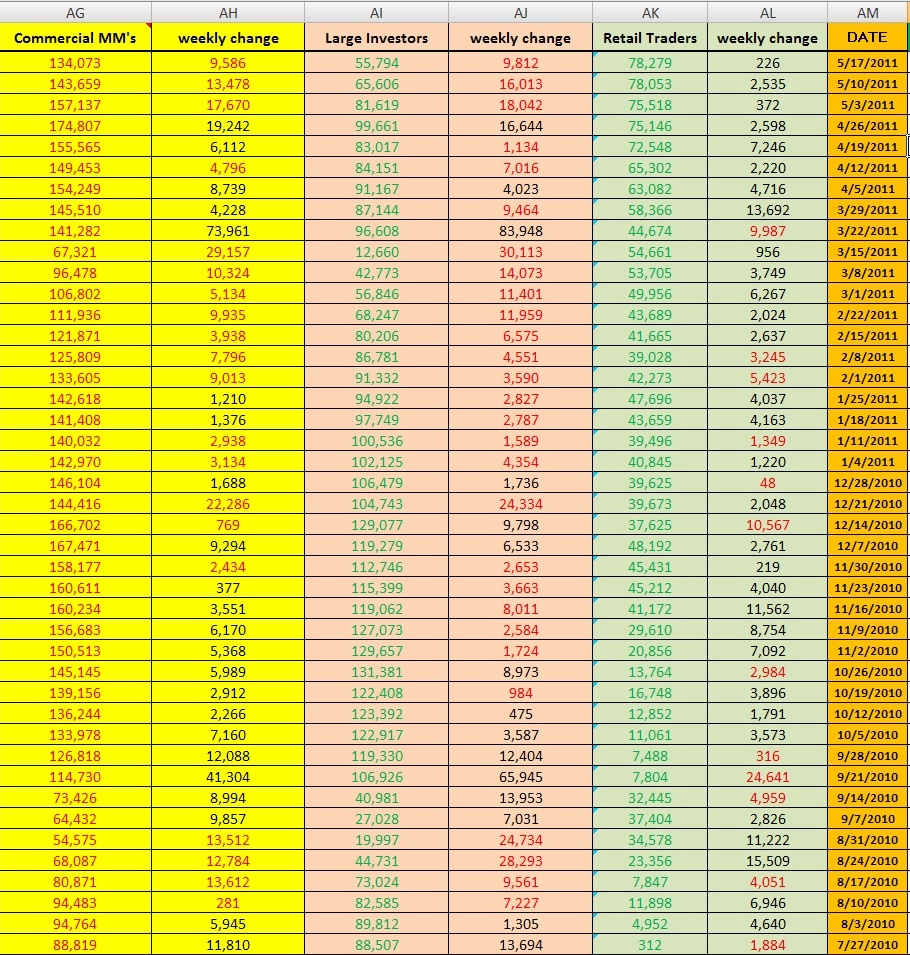
Image # 3:
Here we can view the depth of the total NET positions (minus the market maker positions)...
As you can see here the total Net Long positions have been in decline for the last two weeks (but only slightly) while the Net Short positions have been increasing for the last three weeks...What to note here is that the Short positions are increasing a lot faster than the Long positions are decreasing...This is causing this correction to have an orderly feel to it...Another view is that they are establishing a bigger short stance before they really start to decrease Long positions at a faster rate...Only time will tell...
In summation, Large Trader Long positions have not decreased a significant amount (yet), but a heavy short stance is being structured...This can be interpreted in several ways but the reality is more data is needed to determine if this downward move will have legs...So far, this position only tells me that I wouldnt want to make any big directional bets at this time...There is a temporary bias to the downside, but how much more down will depend a lot on whether Large Traders decide to decrease their Long Positions to a heavier degree...So far that has not happened...Outlook for next week continues to be cautious...
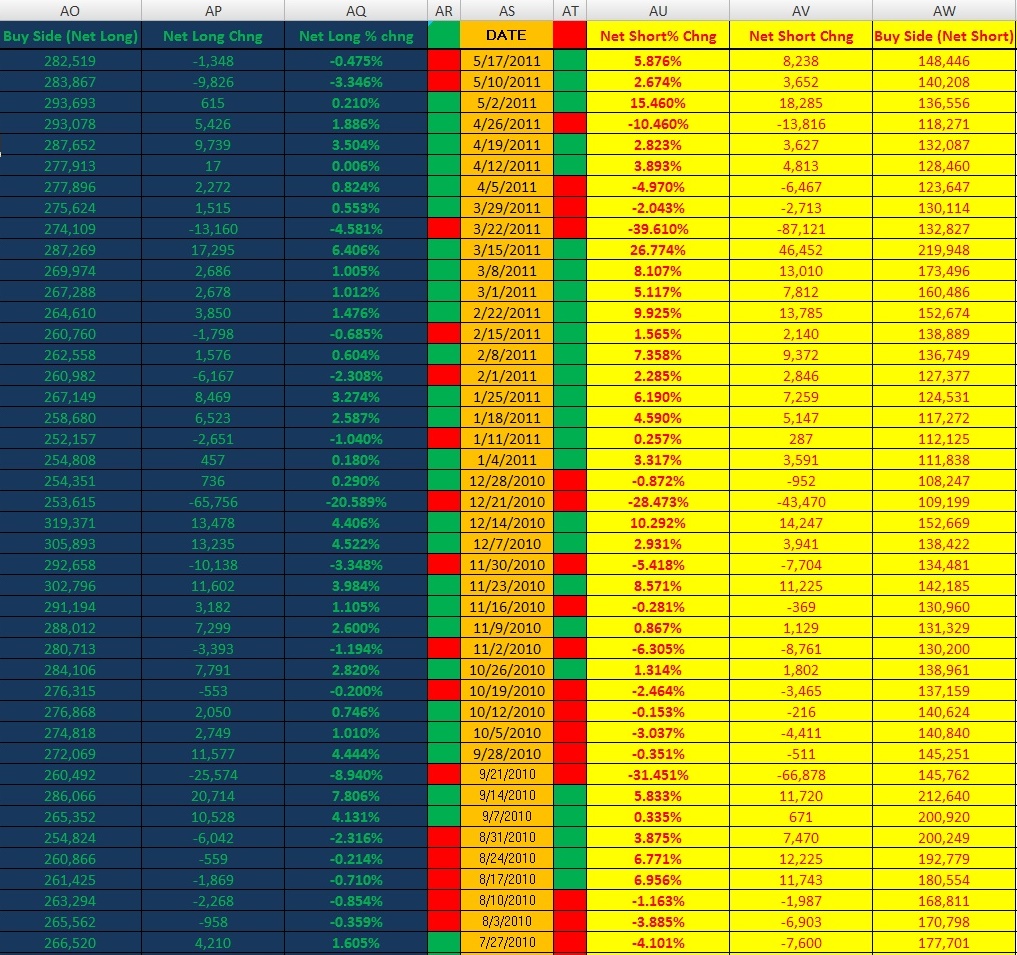
Image # 4:
Daily view ~$SPX~...
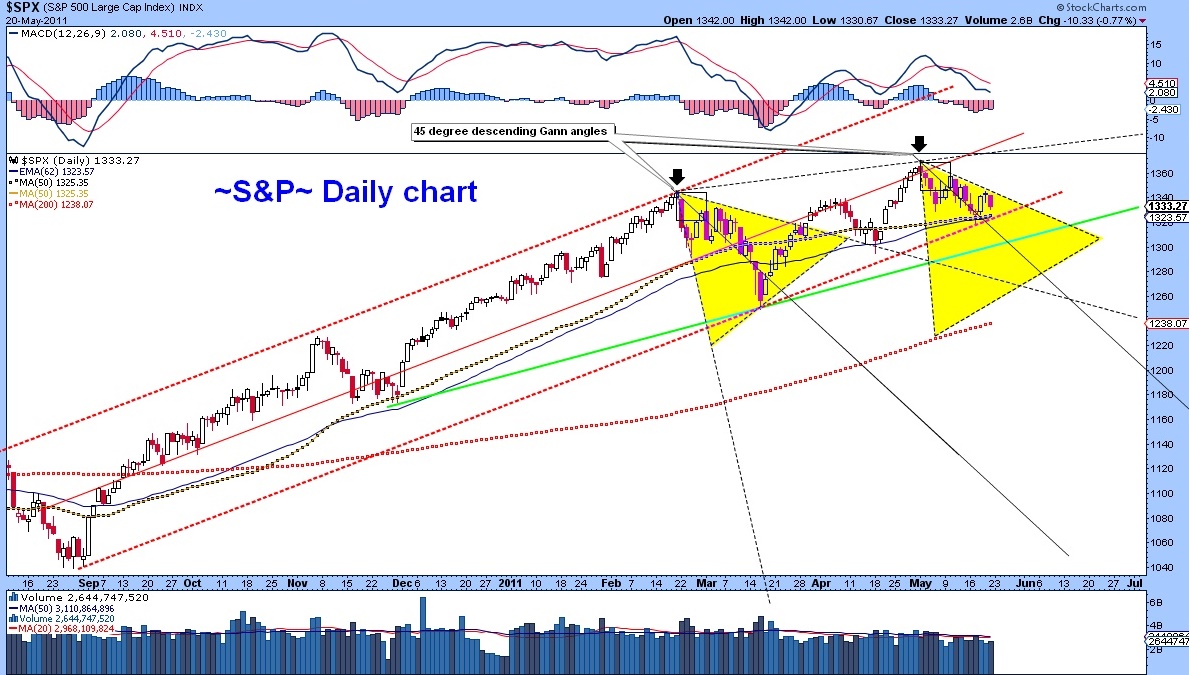
Image # 5:
Weekly View ~$SPX~
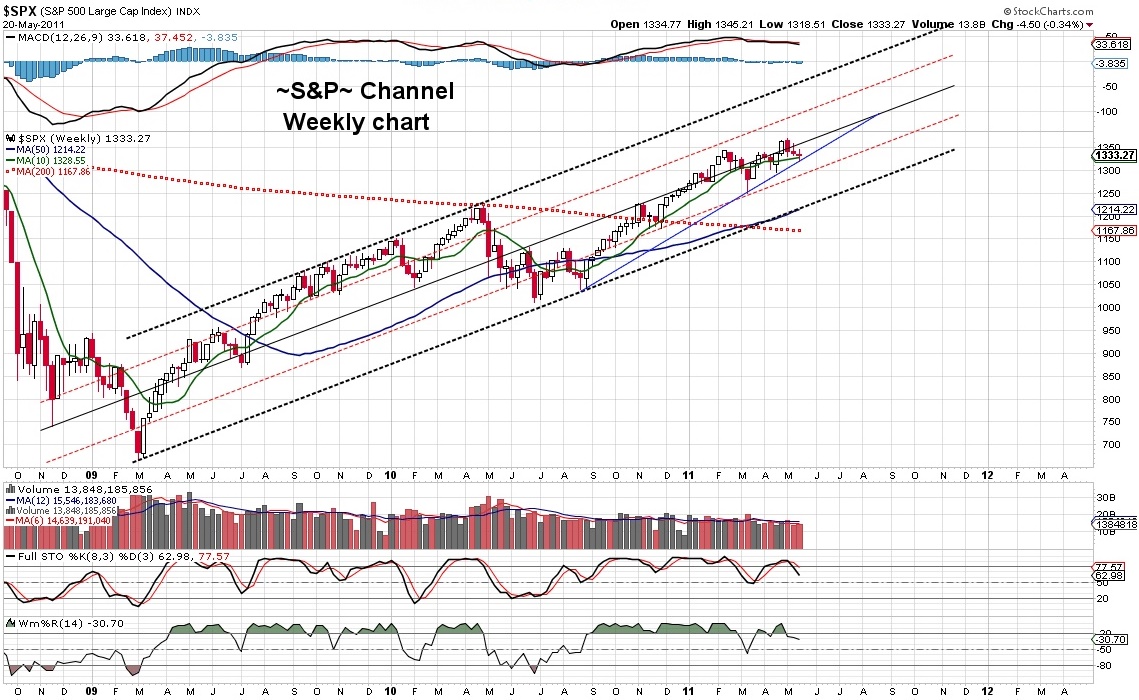
Image # 6:
Monthly View ~$SPX~
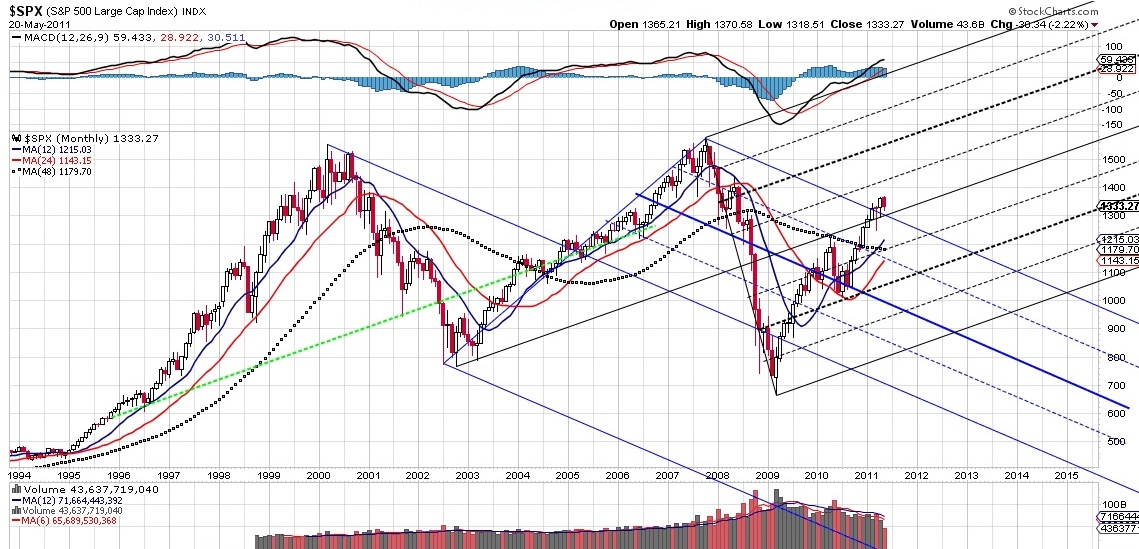
~The Mathematical Dynamics of Covered LEAP's~
Let me go through the math of an entire position set-up so it can give you guys more clarity...Let's use my Ford position since we've been referencing that one anyway...
When structuring these positions, you always want to have two key numbers in mind...
1) Your called return = (the return that you get if your position is called out)
2) Your unCalled Return = (the return that you get if your position is not called out)
...Before establishing any Covered LEAP position, you need to know exactly what these two returns are so you can weigh the risk/reward...
Figuring out the "Called Return"...To get called out, that means that ~F~ trades above $15 a share by the end of the June expiration...This is what happens...
1) We owe the buyer of our June 15 call one-hundred shares of ~F~ at a price of $15...
2) We are owed one-hundred shares of ~F~ at a price of $12.50 from the seller of our ~F~ 12.5 call...
3) Your broker will automatically handle this transaction...(It is called exercising an option or being "Called Out"...
4) So we buy 100 shares of ~F~ for $12.50 and instantly sell those shares for $15.00...Leaving us a profit of $2.50...We add that to the Debit we received for selling the 15 call, which was 0.57...So 0.57 plus 2.50 = $3.07...but, remember, we paid $3.20 to establish the position...
5) So with this covered LEAP position established the way that it is, our "Called Out Return" equals negative .13 cents...(3.2 minus 3.07)...which is also a loss of 4.06%...
6) In summation, we paid out $3.20 and were returned $3.07 which is a 4.06% loss...So if ~F~ trades above $15 by the end of June exp. we can expect a max loss of 4.06%...
Figuring out the "Un-Called Return"...For the position not to get called out, ~F~ needs to trade below $15 a share by the end of the June expiration...This is the mathematics involved...
1)We paid out 3.20 and recieved 0.57...
2)3.20 divided by 0.57 = 5.614
3)100 divided by 5.614 = 17.81
4) So $0.57 cents is equal to 17.81% of $3.20...
5) In summary, if ~F~ is below $15 by June options exp. then we keep a profit of 17.81%...Our "Un-Called Return" is +17.81%...Since we did not get called out, we have the choice to sell another front month and bring in more money...
+++the "my horns are better than your claws" trader psychology+++
I'll be day/position-trading options tomorrow up & down/calls & puts...then again, I may just sit-on-hands...The plan is to trade what I see...not what I hear...
Stocks may go up tomorrow, maybe even the next day (maybe not at all)...lets be realistic here...Today the markets crashed through their 50 day moving averages...and then slowly rallied back up the rest of the day (barely even closing back above the 50dma)...I just dont see how that is something to get overly excited/Bullish about... I'll get bullish when we break through the descending trendline made from connecting the last two swing highs...
Im looking for some calls now, but even if I do trade some calls, there is absolutely nothing to suggest that this correction is over yet...
I did some board surfing and I see so many traders that are "stuck" "debating against" the bulls or the bears...lol...I have never figured out why they waste the time...Its like they completely fail to realize that Everyone is a Bull and a Bear... ...No matter which direction we are going, we are bullish our open positions... ...and when we close those positions, we are all Bearish...
So many traders feel the need to categorize themselves and then waste unbelievable amounts of time defending their stance...= an unconscious weakness... Meanwhile the market just keeps on moving...
...heres my .69 cents = let the hardcore bulls and bears waste all the time that they want arguing or deliberating in a perpetual state of confused uncertainty... ...Always Play the middle...because if you are positioned in the middle...you have 360 directions to go if need... ...bulls & bears arent the only animals to choose from either...I would rather be a Chameleon, which can adapt and jump into any environment...unseen...
Right now, the market is in a period of uncertainty (no-mans-land)...so the bulls as well as the bears are both miserable...& misery looooves company...you are always invited...lol
Im glad that you are actively looking through the site & see value in the reports...This information is unbelievably not advertised very much...Thats how .gov works though...
If you or anyone else really get deep with the data in the future, theres a book that I highly recommend...Written by the worlds real COT expert...
It's called...
The Commitments of Traders Bible by Stephen Briese
This book is worth it's weight in gold...
http://www.amazon.com/Commitments-Traders-Bible-Insider-Intelligence/dp/0470178426

And if any of you ever talk to Steve Briese...tell him ~6979~ sent you...
I see. Thanks for the explanation. I was combing through the datas and found a few I like...the Euro FX in particular since I trade forex.
All of them are important...I just focus on the Futures only S&P500 report because thats where the big money plays...Anyone can trade the E-minis but the big contracts are extremely expensive...I just find it to be the most reliable (personal preference), but I also watch the others closely as well...
I dont want to overload traders here with data...
thanks for the link! it's definitely a gold mine of information O_O
I saw in the report there are S&P 500 consolidated, S&P 500 stock index, and E-MINIS S&P 500 stock index, and your data matches that of S&P 500 Stock Index. Is there a reason to follow this one in particular as opposed to the others?
Government website: CFTC (US Commodity Futures Trading Commission)
http://www.cftc.gov/marketreports/commitmentsoftraders/index.htm
Its full of information...
thanks for that it was very informative. where do people usually get the COT report from?
~S&P500 COT Report~ (explained a little deeper)
...The reports come out every friday @ 3:30pm......Very powerful data, and to those interested, feel free to ask questions...
Image # 1:
Below is the raw data organized in excel...The important columns to pay attention to is the "NET Positions" (yellow highlighted)...This is just a basic subtracting the short positions from the long positions...
Last week shows us how the Asset Managers are slowly decreasing long holdings and slightly increasing short holding...(De-Leveraging)
The Hedge Funds NET Positions, shows a moderate swing last week from net long right back to net short... ...This is a powerful piece of data to be aware of...Remember,this data was available last friday...Sometimes we can catch these big traders making big moves like this and "follow them"...

Image # 2:
In this image, we basically consolidate all the raw data and get a different view of the same information...Here we can see that the Large Investors (which is simply the combination of the NET positions of Asset Managers, Hedge Funds, and OR = Other Re-portables)...We see that they have been dramatically reducing long positions...Now in the Retail Traders category, notice how they are actually still increasing their Net long positions...Now you can see why they say "Follow the Smart Money"...Most of the time = "Fade the Little guys"...
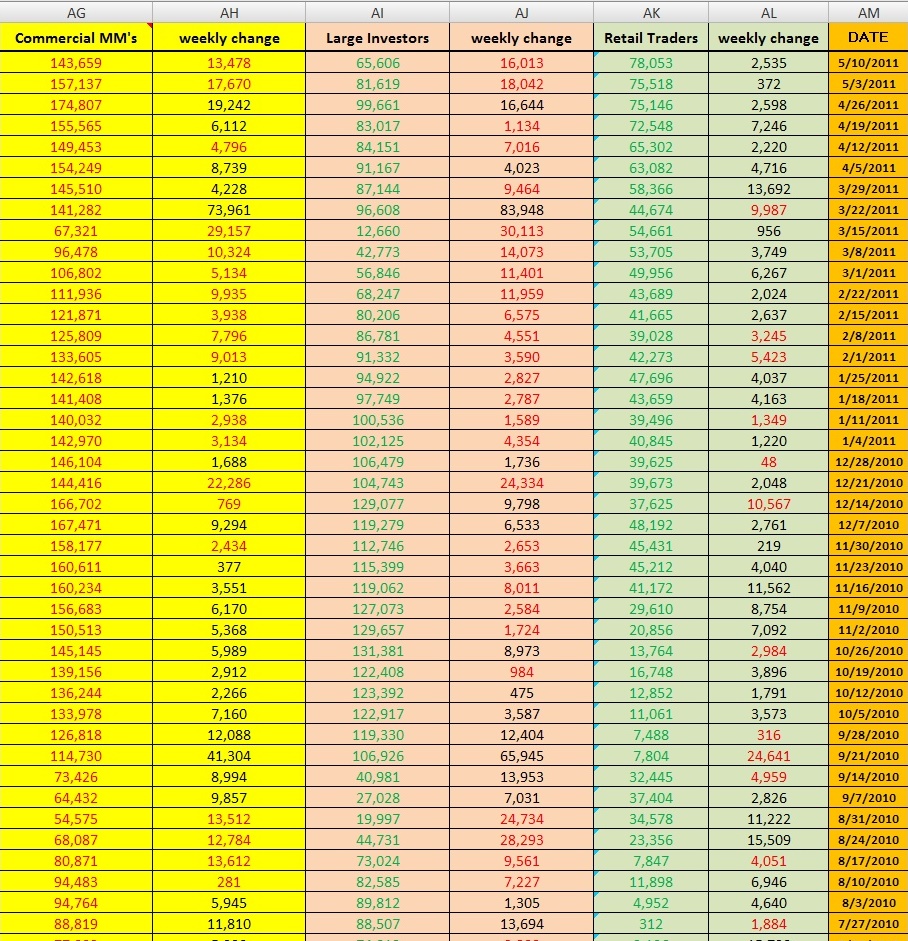
Image three:
This third image is just another view of the same information = perspective...Here, I add all the long positions up and add all the short positions up and give them their own space...(These positions do not include market maker positions also known as Dealer Intermediary Positions)...
This view gives us a powerful perspective and tool to potentially nail tops and bottoms...The Short positions of all have been dramatically increasing for the last two weeks...The long positions are decreasing, but not as fast as the shorts are increasing...
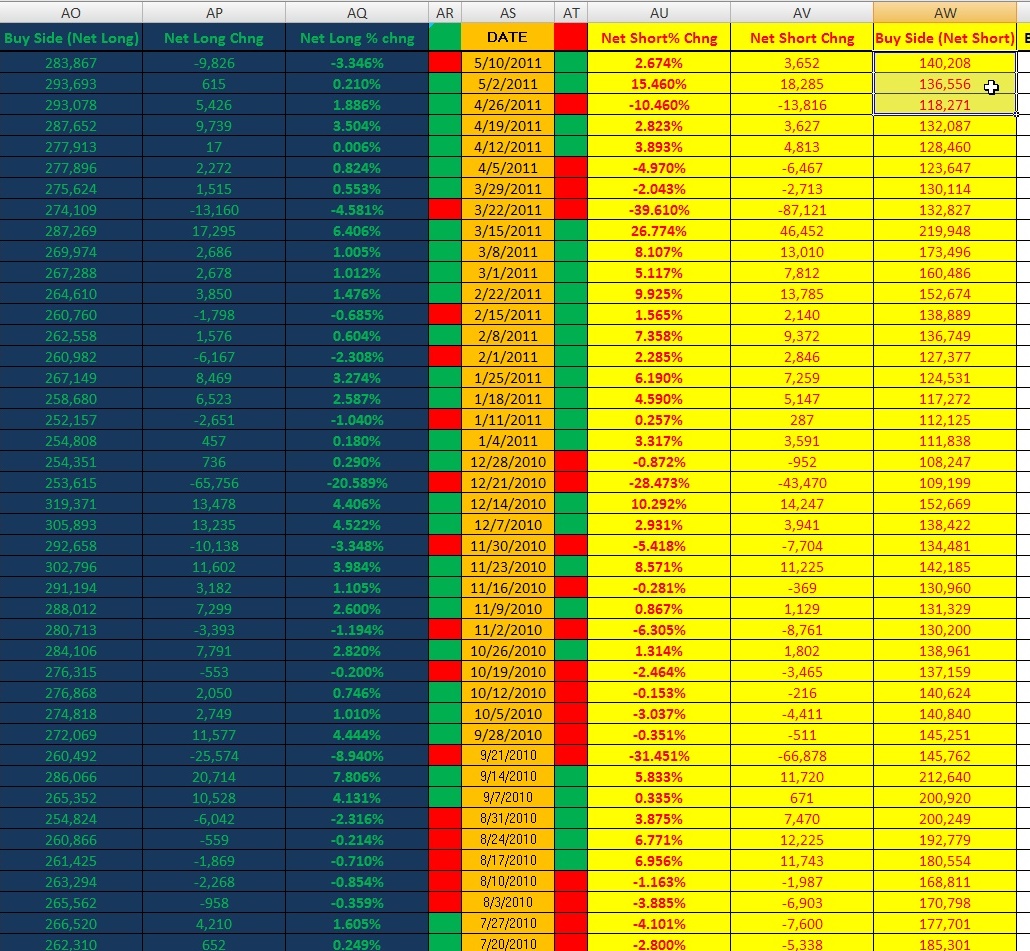
Again, this information is extremely powerful and as time goes on many of you will learn to literally love this data...I know its a bit complicated at first glance, but give it a chance and you will not regret it...I cannot tell you how many times this data has put me on the right path in terms of broad market direction...You will not find this data organized like this anywhere on the internet, because it is out of my own personal excel workbook...
Enjoy Traders...~6979~
How I trade Covered LEAPS
~NVDA~ credit management Part 1
http://investorshub.advfn.com/boards/read_msg.aspx?message_id=63137774
~NVDA~ credit management Part 2
http://investorshub.advfn.com/boards/read_msg.aspx?message_id=63161739
sold the 21 (june calls) @ .88 & bought back today @.15(bestPP) =+$730
@ that time my 17.5 LEAP's were @ 2.89...(down over 1k)...Im going to hold those directional for now in anticipation of a bounce...(already @ 3.00x3.05)
...will re-estab short side post bounce (better premiums)
this all = turning a loser into a winner
~NVDA~ credit management part 3 (Summation)
http://investorshub.advfn.com/boards/read_msg.aspx?message_id=63171163
There are many ways to view this...This is how I look @ it...
I originally bought the ~NVDA~ Jan 17.50's for (link back)
so my basis is 4.35 = $4,350.00
I then sold the June 21's for .88 = $880.00
I bought back today @ .15 = $150.00 = profit of $730.00
So I basically reduced my Basis (& it looks like this)
4.35 - .73 = 3.58
So my new basis is now 3.58 or $3,580.00
I then waited for a bounce...got it...re-established a new short
(~NVDA~ Jun 19 calls @ .60 = $600.00)
So in effect my new basis is 3.58 - .60 = 2.98 (I might not get the whole .60, but you can see what I am doing...Eventually, my long LEAP position will pay for itself...
Hope this helps some see what this method is about...(this is just my view & how I learned)

Knowledge = 1T/A69888
we'll be riding this one together bro, should make for a very nice summer,,,;)
ty very much, as always & right backatcha
Im not even going to chart this one man...your chart says all I need to know...
Im a strong believer in "if it aint broke...dont fix it"
you are one of the few chartist's that can make me jump quick...no need to add to perfection...
sounds like a great plan,,,;)
enjoy my friend,,,;)
LoL...Im putting the chicken breast back in the freezer...Its $teak tonite...
CREE @43 now see you @46 tomorrow,,,;)
link back
no complaints here, i'm up around 2k or 7% in a day and a half so far,,,;)
ty
Fantastic!
should see $44 sometime b4 tomorrows close imo,,,;)
CREE long term play w/ target pps @60.73+- on the Falling Wedge (Reversal) and/or diamond bottom (pattern) in play
now lets bank as we enjoy the summer months,,,;)
yeah man, thanks for your chart...It took all but 10 seconds for me to see what we had here...I called my dad and told him it's a pre-breakout (double bottom) and about the diamond wedge...he did some quick valuation analysis and came up with a margin of safety of 30...thats all it took...
This is an excellent valuation play...really appreciate it...
best of luck to the 3 of us then,,,;)
this should help us on the way up!;)
Short % of Float
23.61M 25.9 %
weeeeeeeeeeeeeeeee,,,;)
ha ha...great call man...me & dad loaded up...lol...up 3.72% on just the stock...weeeeeeeeeeeeeeeeeeeeeeeeee
I definitely will man...Im looking at the jan12' LEAP's right this second (1.26x1.32)...Seriously, I completely missed this one...
I might need to get on the phone this morning indeed...Thanks
kool!
love to see what you come up with if/when you have the time to work the charts
thx bro
Hey Mtcin0...man I believe that your on to something with ~CREE~...
Ive been in sort of an agreement with the talking heads in terms of sector rotation...~CREE~ does fit the description indeed...
And it's hovering right above it's 200wma (in a huge a,b,c correction Diamond) ...Exactly the kind of play that Im looking for...thanks man...seriously
~CREE Weekly Chart~
long term play w/ target pps @60.73+- on the Falling Wedge (Reversal) and/or diamond bottom (pattern) in play
Diamond Bottom (Pattern)
http://thepatternsite.com/diamondb.html
Falling Wedge (Reversal)
The falling wedge is a bullish pattern that begins wide at the top and contracts as prices move lower. This price action forms a cone that slopes down as the reaction highs and reaction lows converge. In contrast to symmetrical triangles, which have no definitive slope and no bias, falling wedges definitely slope down and have a bullish bias. However, this bullish bias cannot be realized until a resistance breakout.
The falling wedge can also fit into the continuation category. As a continuation pattern, the falling wedge will still slope down, but the slope will be against the prevailing uptrend. As a reversal pattern, the falling wedge slopes down and with the prevailing trend. Regardless of the type (reversal or continuation), falling wedges are regarded as bullish patterns.
http://stockcharts.com/help/doku.php?id=chart_school:chart_analysis:chart_patterns:falling_wedge_revers
"...there are three things that really make an excellent Trader... Self-Control ...Peripheral Vision ... & Depth Perception ..." ~6979~}{ 2-22-11
| Volume | |
| Day Range: | |
| Bid Price | |
| Ask Price | |
| Last Trade Time: |
