...The reports come out every friday @ 3:30pm......Very powerful data, and to those interested, feel free to ask questions...
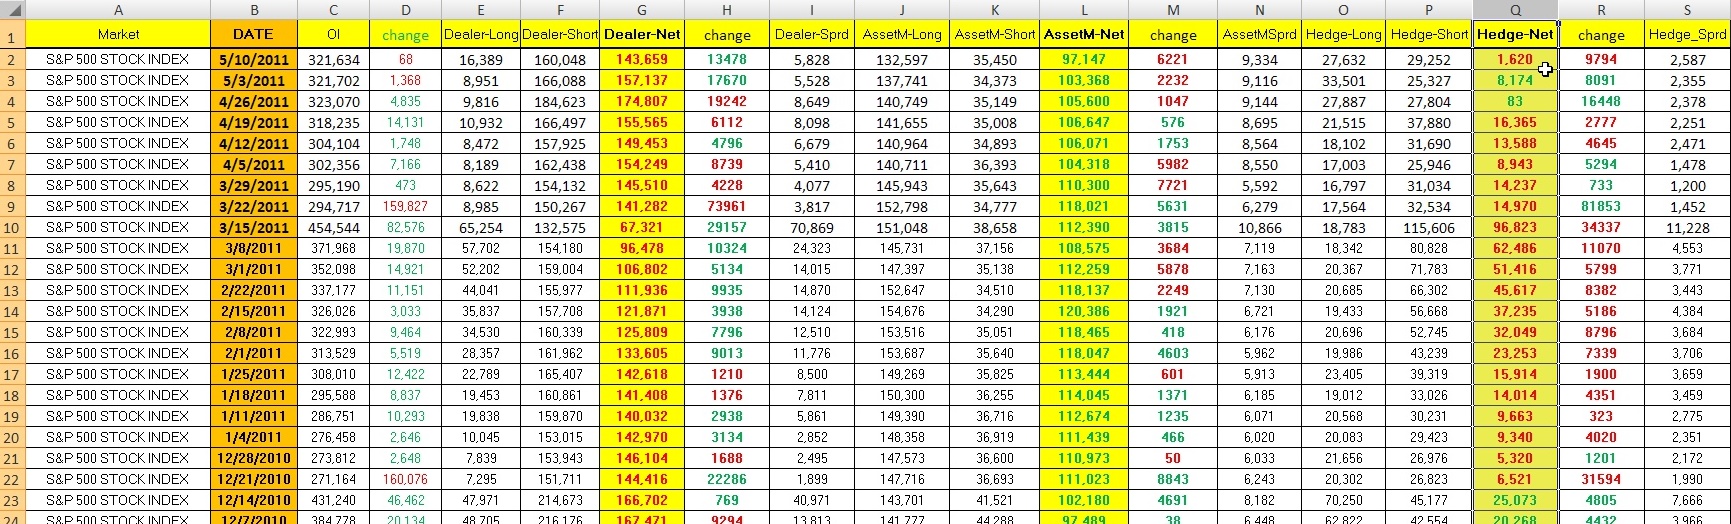
Image # 1: Below is the raw data organized in excel...The important columns to pay attention to is the "NET Positions" (yellow highlighted)...This is just a basic subtracting the short positions from the long positions...
Last week shows us how the Asset Managers are slowly decreasing long holdings and slightly increasing short holding...(De-Leveraging) The Hedge Funds NET Positions, shows a moderate swing last week from net long right back to net short... ...This is a powerful piece of data to be aware of...Remember,this data was available last friday...Sometimes we can catch these big traders making big moves like this and "follow them"...
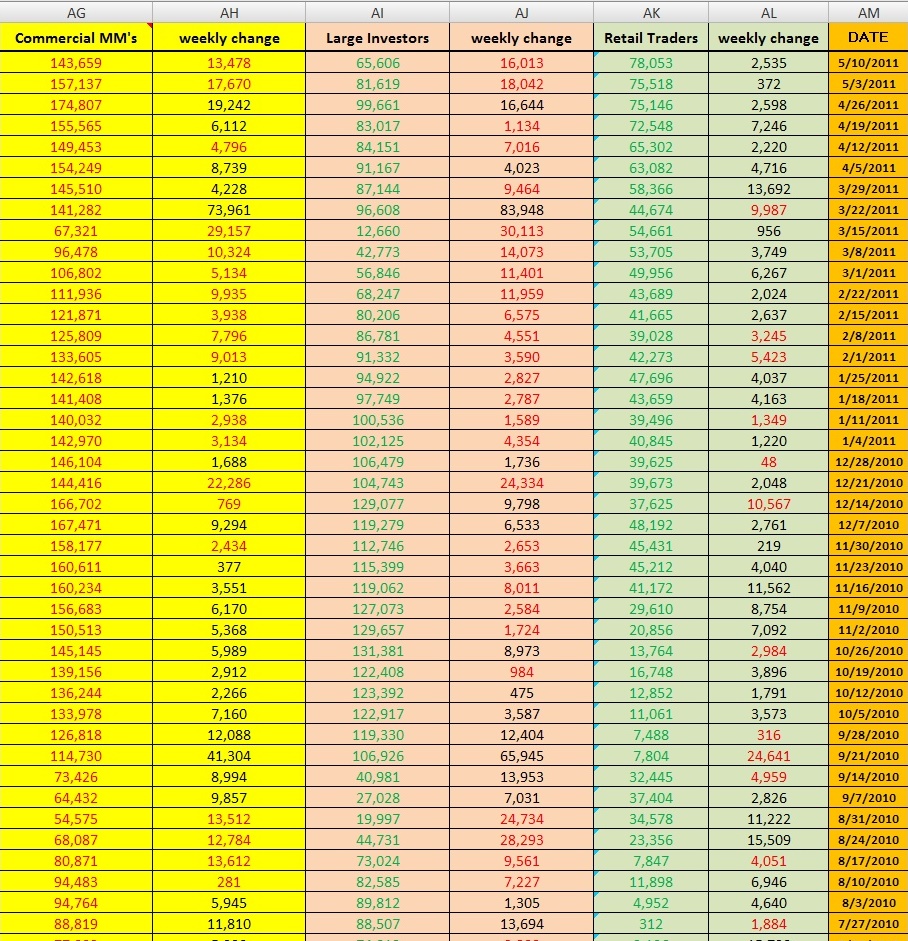
Image # 2: In this image, we basically consolidate all the raw data and get a different view of the same information...Here we can see that the Large Investors(which is simply the combination of the NET positions of Asset Managers, Hedge Funds, and OR = Other Re-portables)...We see that they have been dramatically reducing long positions...Now in the Retail Traders category, notice how they are actually still increasing their Net long positions...Now you can see why they say "Follow the Smart Money"...Most of the time = "Fade the Little guys"...
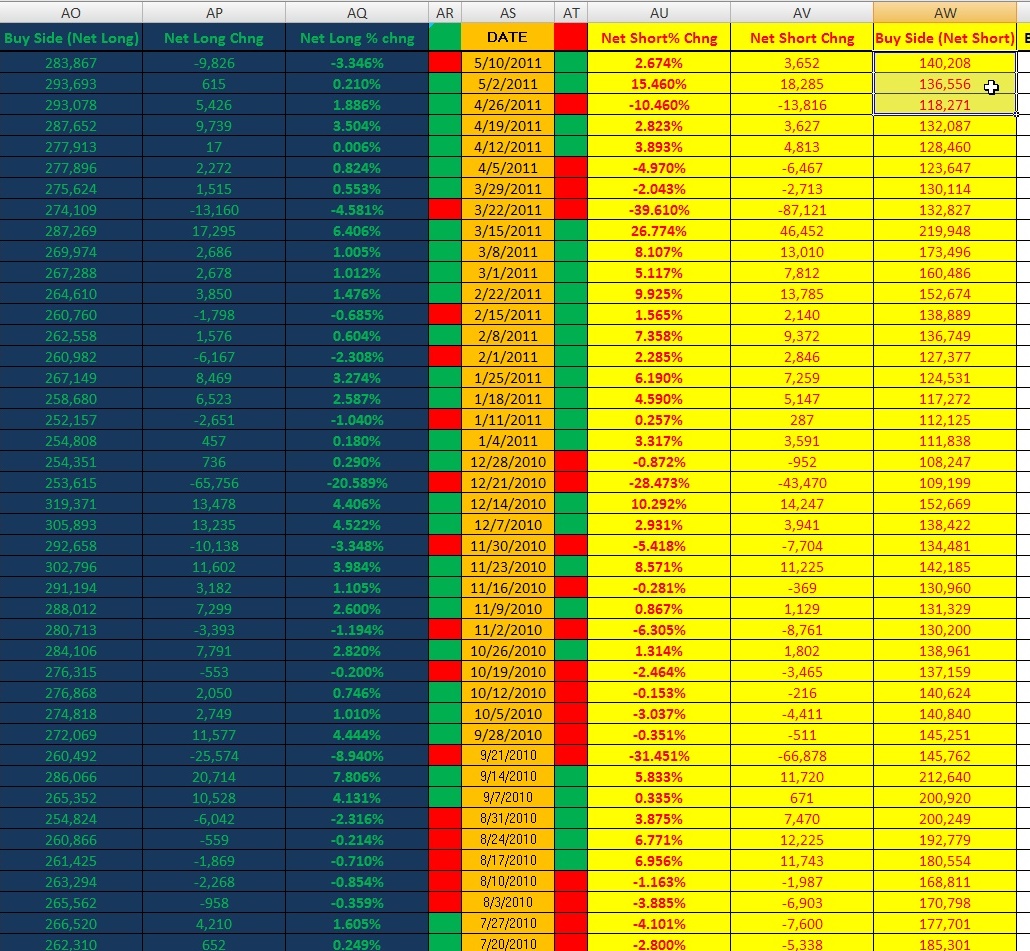
Image three: This third image is just another view of the same information = perspective...Here, I add all the long positions up and add all the short positions up and give them their own space...(These positions do not include market maker positions also known as Dealer Intermediary Positions)...
This view gives us a powerful perspective and tool to potentially nail tops and bottoms...The Short positions of all have been dramatically increasing for the last two weeks...The long positions are decreasing, but not as fast as the shorts are increasing...
Again, this information is extremely powerful and as time goes on many of you will learn to literally love this data...I know its a bit complicated at first glance, but give it a chance and you will not regret it...I cannot tell you how many times this data has put me on the right path in terms of broad market direction...You will not find this data organized like this anywhere on the internet, because it is out of my own personal excel workbook...
Register for free to join our community of investors and share your ideas. You will also get access to streaming quotes, interactive charts, trades, portfolio, live options flow and more tools.
 News
News  Market Data
  Discover