 News
News  Market Data
  Discover
Support: 888-992-3836
Copyright © 2023 InvestorsHub Inc.


Register for free to join our community of investors and share your ideas. You will also get access to streaming quotes, interactive charts, trades, portfolio, live options flow and more tools.
= WATCH LIST UPDATE =
Moving ARYC/ASNA/HSGX/JCP/SHMP to WATCH.
Link to main watch list here - https://docs.google.com/document/d/1QYXojMENZc1frWydzOJO6jil6N2l3WAXf9ifaFZd-go/edit
WATCH: ARYC, ASNA, HSGX, JCP, SHMP
BUY: CEI, CGIX, ENDV, FCEL, HEMP, INPX, SLS, YRIV
HOLD:
TAKE PROFIT / SELL:
= BUY ALERT = FCEL = $0.358
= Moving FCEL back to BUY =
= WATCH LIST UPDATE =
Moving FCEL/HSGX to SELL, ASNA/JCP/SHMP to HOLD, ENDV/SLS/YRIV to BUY
Link to main watch list here - https://docs.google.com/document/d/1QYXojMENZc1frWydzOJO6jil6N2l3WAXf9ifaFZd-go/edit
WATCH:
BUY: ARYC, CEI, CGIX, ENDV, HEMP, INPX, SLS, YRIV
HOLD: ASNA, JCP, SHMP
TAKE PROFIT / SELL: FCEL, HSGX
$NIO NIO Inc. reinstated with a Buy at Goldman Sachs Goldman Sachs analyst Fei Fang reinstated NIO Inc with a Buy and $10.70 price target. Fang said shares have corrected following Q4 results and sees key drivers that include a light business model, successful premium segment branding, economically constrained competitors, and a large volume opportunity for the ES6.
Read more at:
https://thefly.com/landingPageNews.php?id=2875719
$HEMP up 10% last week. Shes a going on up
NIO was moved to BUY on the main watch list on 8/30/19 - https://docs.google.com/document/d/1QYXojMENZc1frWydzOJO6jil6N2l3WAXf9ifaFZd-go/edit
$NIO $5 Billion Electric Vehicle Charging Stations Market, 2023: Market to Grow at a CAGR of 41.8% - Government Funding, Subsidies, and Incentives Expected to Drive the Market https://markets.businessinsider.com/news/stocks/5-billion-electric-vehicle-charging-stations-market-2023-market-to-grow-at-a-cagr-of-41-8-government-funding-subsidies-and-incentives-expected-to-drive-the-market-1026694008
$NIO Just Remember One of #Tesla $TSLA biggest investors took 11.4% stake in rival $Nio
https://techcrunch.com/2018/10/09/one-of-teslas-biggest-investors-took-an-11-4-stake-in-rival-nio/
$NIO One for the record books
Shortly after NIO's successful IPO, the company found itself sitting on top of the world -- literally. On Sept. 24, 2018, the company achieved a new Guinness World Record when Chen Haiyi from China ascended the Purog Kangri glacier in Tibet and reached an altitude of 18,751 feet in the NIO ES8, setting a record for the highest altitude achieved in an electric car. According to the company, the feat was meant to demonstrate the EV's prowess in high altitude and extreme cold. https://guinnessworldrecords.com/news/commercial/2019/1/electric-car-sets-record-after-climbing-more-than-5-000-m-to-reach-glacier-546361/
Nio $NIO takes on Tesla $TSLA with a car half the price of Model X
https://investorplace.com/2019/02/if-you-liked-tesla-then-you-have-to-love-nio-now-fimg/
= WATCH LIST UPDATE =
Moving CGIX/INPX to BUY
Link to main watch list here - https://docs.google.com/document/d/1QYXojMENZc1frWydzOJO6jil6N2l3WAXf9ifaFZd-go/edit
WATCH: ENDV, SLS, YRIV
BUY: ARYC, ASNA, CEI, CGIX, FCEL, HEMP, INPX, JCP, SHMP
HOLD: HSGX
TAKE PROFIT / SELL:
= WATCH LIST UPDATE =
Adding HEMP as BUY.
Link to main watch list here - https://docs.google.com/document/d/1QYXojMENZc1frWydzOJO6jil6N2l3WAXf9ifaFZd-go/edit
WATCH: CGIX, ENDV, INPX, SLS, YRIV
BUY: = SHMP = BUY ALERT = ARYC, ASNA, CEI, FCEL, HEMP, JCP
HOLD: HSGX
TAKE PROFIT / SELL:
$HEMP bi-coastal processing centers including the 85,000 square-foot multipurpose industrial hemp processing facility in Spring Hope, North Carolina, a state of the art processing center in Medford, Oregon, and a 500-acre hemp growing Eco-Village in Golden Valley, Arizona, Hemp, Inc. showed over an 1,800% increase in sales from previous year 2017.
Good call on HEMP!
= WATCH LIST UPDATE =
Adding ASNA as BUY. Moving CGIX/SLS/YRIV to WATCH
Link to main watch list here - https://docs.google.com/document/d/1QYXojMENZc1frWydzOJO6jil6N2l3WAXf9ifaFZd-go/edit
WATCH: CGIX, ENDV, INPX, SLS, YRIV
BUY: = SHMP = BUY ALERT = ARYC, ASNA, CEI, FCEL, JCP
HOLD: HSGX
TAKE PROFIT / SELL:
SLS R/S .. unfortunate.
https://www.streetinsider.com/dr/news.php?id=15743322&gfv=1
Nice. HEMP is actually on my main watch list and chart is starting to look good - https://docs.google.com/document/d/1QYXojMENZc1frWydzOJO6jil6N2l3WAXf9ifaFZd-go/edit
$HEMP Entertainment
Hemp, Inc.’s newest division, Entertainment, will cover everything from investing in the movie The King of Pot and other historical movies representing our industry up to the docuseries on the Modern Day History of Hemp. https://www.globenewswire.com/news-release/2019/08/30/1909261/0/en/Hemp-Inc-Announces-Credit-Unions-Now-Allowed-to-Offer-Services-to-Hemp-Industry-Businesses.html
= BUY ALERT = SHMP = on news of quarantine lifting at Texas production facility.
Natural Shrimp Announces Lifting of Quarantine at its La Coste, Texas, Production Facility - https://finance.yahoo.com/news/naturalshrimp-inc-ceo-letter-shareholders-133738919.html
DALLAS, TX, Sept. 04, 2019 (GLOBE NEWSWIRE) -- via NEWMEDIAWIRE -- NaturalShrimp Inc., the aquaculture company that developed and patented the first commercially-operational Recirculating Aquaculture System (RAS) for shrimp, announced today that the Texas Parks and Wildlife Department (TPWD) in cooperation with the U.S. Department of Agriculture/Animal Plant Health Inspection Services (USDA/APHIS) has officially lifted the quarantine at the Company's facility in La Coste, Texas caused by the detection of infectious hematopoietic virus (IHHNV).
NaturalShrimp worked closely with both the TPWD and the USDA/APHIS for the last several weeks in order to quickly remove the IHHNV from the facility. Hatcheries are required to guarantee virus free post larvae (PL) shrimp supplies through their own independent laboratory testing. This is the first time that the Company has detected the presence of IHHNV infected shrimp indicated by a much slower than normal growth throughout its 18 years of receiving PL shrimp from hatcheries.
“Although this virus was not caused by NaturalShrimp or our systems, we are happy to help with the eradication of this virus at our facility,” said Gerald Easterling, CEO. “Our systems continue to operate at the highest levels of efficiency and safety. Because of our technology, the shrimp were able to survive despite the virus breakout. Although this virus does not affect people, we are still happy that no human consumption of the ill shrimp took place,” said Tom Untermeyer, Chief Technology Officer.
In the future, the Company's isolated nursery tanks will add an extra measure of safety protocol through early detection of the IHHNV prior to the stocking of growout tanks in case this remote possibility happens again. The Company will begin restocking during the month of September with new PLs in its newly installed nursery systems.
= SHMP = Announces Lifting of Quarantine at its La Coste, Texas, Production Facility - https://finance.yahoo.com/news/naturalshrimp-inc-ceo-letter-shareholders-133738919.html
DALLAS, TX, Sept. 04, 2019 (GLOBE NEWSWIRE) -- via NEWMEDIAWIRE -- NaturalShrimp Inc., the aquaculture company that developed and patented the first commercially-operational Recirculating Aquaculture System (RAS) for shrimp, announced today that the Texas Parks and Wildlife Department (TPWD) in cooperation with the U.S. Department of Agriculture/Animal Plant Health Inspection Services (USDA/APHIS) has officially lifted the quarantine at the Company's facility in La Coste, Texas caused by the detection of infectious hematopoietic virus (IHHNV).
NaturalShrimp worked closely with both the TPWD and the USDA/APHIS for the last several weeks in order to quickly remove the IHHNV from the facility. Hatcheries are required to guarantee virus free post larvae (PL) shrimp supplies through their own independent laboratory testing. This is the first time that the Company has detected the presence of IHHNV infected shrimp indicated by a much slower than normal growth throughout its 18 years of receiving PL shrimp from hatcheries.
“Although this virus was not caused by NaturalShrimp or our systems, we are happy to help with the eradication of this virus at our facility,” said Gerald Easterling, CEO. “Our systems continue to operate at the highest levels of efficiency and safety. Because of our technology, the shrimp were able to survive despite the virus breakout. Although this virus does not affect people, we are still happy that no human consumption of the ill shrimp took place,” said Tom Untermeyer, Chief Technology Officer.
In the future, the Company's isolated nursery tanks will add an extra measure of safety protocol through early detection of the IHHNV prior to the stocking of growout tanks in case this remote possibility happens again. The Company will begin restocking during the month of September with new PLs in its newly installed nursery systems.
= WATCH LIST UPDATE =
Moving HSGX to HOLD.
Link to main watch list here - https://docs.google.com/document/d/1QYXojMENZc1frWydzOJO6jil6N2l3WAXf9ifaFZd-go/edit
WATCH: ENDV
BUY: ARYC, CEI, CGIX, FCEL, INPX, JCP, SHMP, SLS, YRIV
HOLD: HSGX
TAKE PROFIT / SELL:
SHMP dipped below $0.12 intraday on Tuesday, a good entry point or adding more shares to dollar cost average - https://en.wikipedia.org/wiki/Dollar_cost_averaging
Anyone who followed your "technical" SHMP advice and bought on Friday is now underwater, with no prospect of breaking even any time soon.
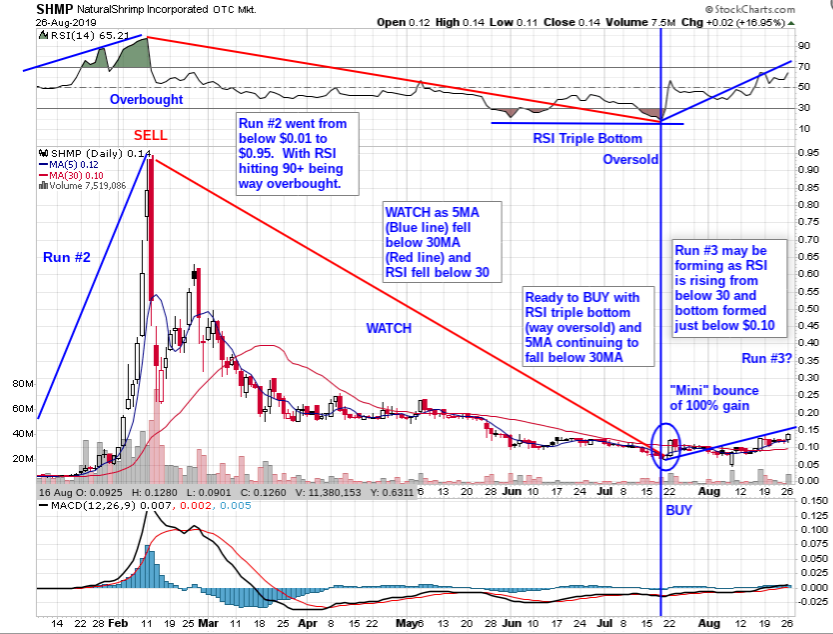
= Chart Review = SHMP

JoshTaeger - "Please stick to discussion of technical trading"
Well, here are some posts from December of 2018 where I correctly called Run #2 based on technicals (And I do believe Run #3 has started for SHMP, of course based on technicals):
12/16/18 "I think SHMP is getting ready for another bounce and I will definitely be looking for entry point for another ride back up." https://investorshub.advfn.com/boards/read_msg.aspx?message_id=145484839
12/18/18 "Moving SHMP ... to BUY" https://investorshub.advfn.com/boards/read_msg.aspx?message_id=145529092
12/19/18 "= BUY ALERT = SHMP" https://investorshub.advfn.com/boards/read_msg.aspx?message_id=145553894
12/20/18 "= SHMP = 60% gain intraday" https://investorshub.advfn.com/boards/read_msg.aspx?message_id=145582814
12/23/18 Chart review https://investorshub.advfn.com/boards/read_msg.aspx?message_id=145655037

12/26/18 Chart bullish (What's happening now for SHMP for Run #3) https://investorshub.advfn.com/boards/read_msg.aspx?message_id=145696787

12/31/18 "= BUY ALERT =" Chart review https://investorshub.advfn.com/boards/read_msg.aspx?message_id=145791287

1/3/19 "= BUY ALERT =" Chart review https://investorshub.advfn.com/boards/read_msg.aspx?message_id=145852828

1/5/19 Chart review https://investorshub.advfn.com/boards/read_msg.aspx?message_id=145903231

1/8/19 Chart review https://investorshub.advfn.com/boards/read_msg.aspx?message_id=145942943

1/9/19 Chart review https://investorshub.advfn.com/boards/read_msg.aspx?message_id=145971684

8/27/19 And current charts showing rebound https://investorshub.advfn.com/boards/read_msg.aspx?message_id=150773780

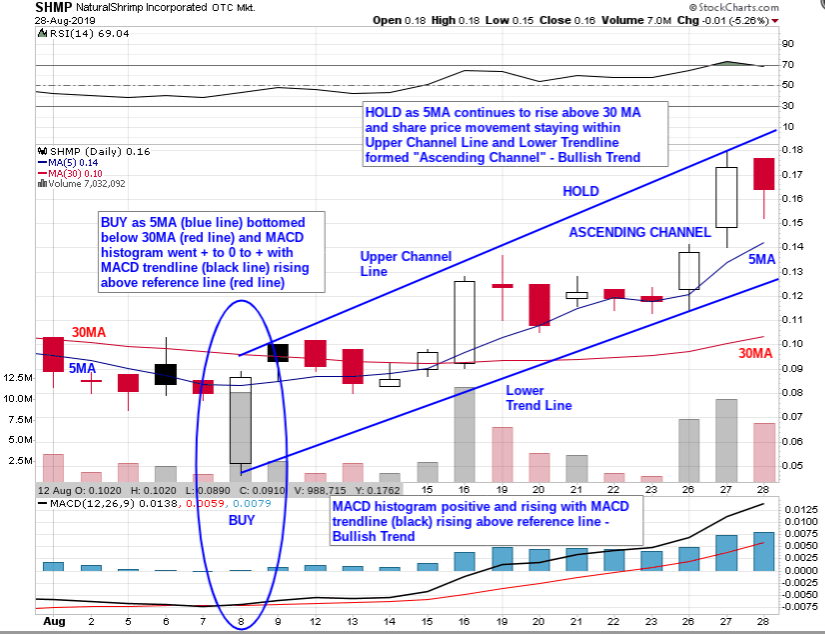
8/28/19 "Ascending Channel" formed https://investorshub.advfn.com/boards/read_msg.aspx?message_id=150819608
Post #234 is off topic and should be deleted. Please stick to discussion of technical trading and avoid posting unsubstantiated rumors about subject companies.
Please read post #234 and post fundamental analysis related replies on SHMP board as this is a technical analysis board.
Thank you.
JoshTaeger - "You really need to understand the relationship between F&T, Hydrensis, and SHMP before you can say it's "another business office" for SHMP."
Post #234 - https://investorshub.advfn.com/boards/read_msg.aspx?message_id=150819780
Confirmation to SHMP opening another business office in Floria - https://investorshub.advfn.com/boards/read_msg.aspx?message_id=150819715
12Retyr - "Regarding the new office in Pompano Beach:
Q:'F&T office or [Natural Shrimp]?'
Peter Letizia: 'It is our new Hydrenesis office and ours under our partneship with Natural Aquatic Systems and Natural Shrimp. I just left there an hour ago.'"
https://investorshub.advfn.com/boards/read_msg.aspx?message_id=150798893
BRITT2575 - "They just opened another SHMP business office ten minutes down the street from me in Pompano Beach Florida!!"
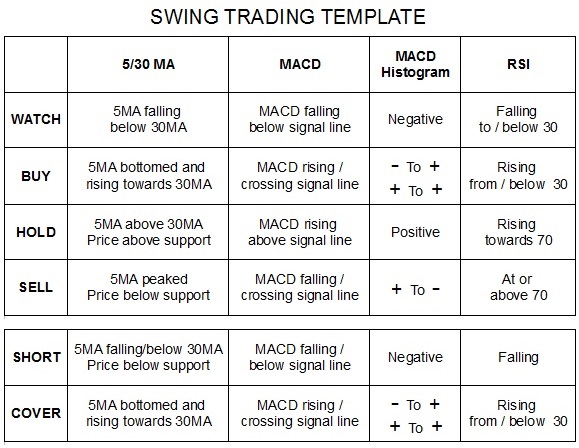
This is a "Technical" Swing Trading board under "Penny Trading - Technical" IH forum subcategory.
Swing Trade Buy/Sell recommendations are made based on technical indicators outlined in the Swing Trade Template.
Please post fundamentals on SHMP board.
Thank you.
You really need to understand the relationship between F&T, Hydrensis, and SHMP before you can say it's "another business office" for SHMP.
Hydrenesis is a vendor of SHMP. That is all. Whatever relationship Hydrenesis has with F&T isn't to SHMP's benefit.
You are welcome and welcome to Swing Trading.
Just found you - thanks for sharing!
= WATCH LIST UPDATE =
Moving ARYC/FCEL/SHMP to BUY.
Link to main watch list here - https://docs.google.com/document/d/1QYXojMENZc1frWydzOJO6jil6N2l3WAXf9ifaFZd-go/edit
WATCH: ENDV
BUY: ARYC, CEI, CGIX, FCEL, HSGX, INPX, JCP, SHMP, SLS, YRIV
HOLD:
TAKE PROFIT / SELL:
Thanks LiveLife. 2/5 is interesting. I see what you're saying.
Use of Technical Indicators - Over the decades, I have used faster and faster technical indicators to enter the position at the bottom of the rebound.
So 50/200 MA became 5/30 MA and now I am finding even 5/30 MA is too slow for my swing trades (The template is 15 years old). I am actually thinking about updating the template with 2/5 MA which is faster. (Rerun the chart with 2/5 MA and it should give you a better indicator for entry point)
Now, I find MACD blue histogram bars going negative to positive (or + down to 0 and back up +) and MACD line (black) crossing above reference line (red) or MACD line falling to reference line and rising above better indicate BUY point.
And RSI falling below 30 (red), especially double/triple bottom helps to avoid false rebound. And RSI rising above 70 (green) indicates you should be looking for profit taking points, especially intraday spikes as selling at the HOD/intraday high allows you to buy back when the price falls back down as price movement trades within the ascending channel or break out.
For the most part, my current swing trading is focusing on high/super high volume stocks undergoing rebound to essentially make swing trades on Technical Rally/Short Squeeze and capturing as much of the gains by entering close to the bottom of rebound and exiting at the peak of bounce. And capturing any rebound/cup and handle movement after retracement/pullback (And why the "Breakdown Table" for the watch list has 2 cycles of Watch/Buy/Hold/Sell).
And what happens afterwards?
For this swing trader, since I always have other rebounding stocks lined up to trade, I will move to next stocks to trade after I exit the position. Yes, there are exceptions as some stocks continue to gain after "cup and handle" but refocusing on other rebounding stocks will produce higher percentage gains.
Pland the trade and trade the plan.
Does the 5 always have to cross over the 30 for you or do you ever consider a buy when the Price crosses over the 5 SMA?
TTOO is having a pretty good run. Looked at it with your 5/30 SMA chart settings. I'm not in it. I was and sold way too early. I've been using an 8/34 EMA setting when looking at bottom plays. Pretty similar I think. I set up a 5/30 chart on my stockcharts.com
Great. I used to use Google Stock Screener but it was discontinued.
I actually find the FinViz stock screener to be easier and quicker to use as once the settings are made, I can simply use the saved "favorite" link instead of having to redo the settings on the now defunct Google Stock Screener.
I'm glad I found this board. Really like it. Funny, I use the same Finviz set up for most of my scans. Sometimes I narrow it down with percentage up. I like the educational part of your board too. kudos.
Cool. I like a little better Avg Vol too. This looks good to me though.
I usually look for higher average volume stocks (unless I traded them before and familiar) but PDS looks to be rebounding from recent bottom of $1.05.
Nice. Will add PDS to my main watch list - https://docs.google.com/document/d/1QYXojMENZc1frWydzOJO6jil6N2l3WAXf9ifaFZd-go/edit
Take a look at PDS for a potential move higher. Looking at 1.38 /1.47.
Thank you and enjoy!
Like your watch List
= WATCH LIST UPDATE =
Adding CGIX/JCP/SLS as BUY.
Link to main watch list here - https://docs.google.com/document/d/1QYXojMENZc1frWydzOJO6jil6N2l3WAXf9ifaFZd-go/edit
WATCH: ARYC, ENDV, FCEL
BUY: CEI, CGIX, HSGX, INPX, JCP, SLS, YRIV
HOLD: SHMP
TAKE PROFIT / SELL:
Confirmation to SHMP opening another business office in Floria - https://investorshub.advfn.com/boards/read_msg.aspx?message_id=150819715
12Retyr - "Regarding the new office in Pompano Beach:
Q:'F&T office or NS?'
Peter Letizia: 'It is our new Hydrenesis office and ours under our partneship with Natural Aquatic Systems and Natural Shrimp. I just left there an hour ago.'"
https://investorshub.advfn.com/boards/read_msg.aspx?message_id=150798893
BRITT2575 - "They just opened another SHMP business office ten minutes down the street from me in Pompano Beach Florida!!"
Chart Review = SHMP = Formed "Ascending Channel" - Bullish Trend
From SHMP board - https://investorshub.advfn.com/boards/read_msg.aspx?message_id=150819554
This is very good point as the new CEO can breath fresh/different life into the future of SHMP.
nsomniyak - "I would add that the recent management change at the top signals that SHMP is now going to be a BUSINESS as opposed to a long-running biology experiment."
Ascending Channel: An ascending channel is the price action contained between upward sloping parallel lines. Higher highs and higher lows characterize this price pattern. Technical analysts construct an ascending channel by drawing a lower trend line that connects the swing lows, and an upper channel line that joins the swing highs - https://www.investopedia.com/terms/a/ascendingchannel.asp
Here's 3 week chart posted on Swing Trading board - https://investorshub.advfn.com/Swing-Trading-Model-36395/
And 7 month chart showing Run #3 in progress - https://investorshub.advfn.com/boards/read_msg.aspx?message_id=150773758
SHMP CEO retiring effective 8/31/19 and remaining as Chairman Emeritus of the Company - https://www.globenewswire.com/news-release/2019/08/28/1907839/0/en/NaturalShrimp-Inc-CEO-Letter-to-Shareholders.html
= SHMP and Watch List Update =
Unconfirmed post from SHMP board - https://investorshub.advfn.com/boards/read_msg.aspx?message_id=150798893
BRITT2575 - "MAYBE BUYOUT OR GAME CHANGING NEWS ON THE WAY!!! They just opened another SHMP business office ten minutes down the street from me in Pompano Beach Florida!!"
= WATCH LIST UPDATE =
Moving SHMP to HOLD. Adding INPX/YRIV as BUY, ARYC as WATCH.
Link to main watch list here - https://docs.google.com/document/d/1QYXojMENZc1frWydzOJO6jil6N2l3WAXf9ifaFZd-go/edit
WATCH: ARYC, ENDV, FCEL
BUY: CEI, HSGX, INPX, YRIV
HOLD: SHMP
TAKE PROFIT / SELL:
DISCLAIMER: Content on this board is for educational purposes only. Please conduct your own due diligence for your stock trades.
INTRODUCTION: Welcome to "my" world of SIMPLIFIED TECHNICAL SWING TRADING.
Stock trading has been my hobby for 25+ years and I use technical swing trading to manage my 401K/Roth IRA accounts for retirement.
This board represents stocks I track/trade and continues the watch list that was started in 5/17/15 to teach my supervisor who lost her husband unexpectedly and since has been used to teach many groups of people new to stock trading how to set BUY/SELL points based on basic technical indicators (I consider this my "give back" to life's many wonderful blessings) - https://stocktradingmodel.wordpress.com/
PAPER TRADING:
If you are new to stock trading, instead of starting out trading with money, consider following this board and learn to technically swing trade by practicing on paper known as "Paper Trading" - https://www.investopedia.com/terms/p/papertrade.asp
SELECTING BROKERAGE:
I started out using Scottrade due to lower online commission but since has merged with TD Ameritrade. For those starting out with lower $500 - $1,000 account balance, commission cost can negate account growth and I recommend Firstrade due to $0 commission fee, yes, no commission fee (Only downside compared to other brokerages is restriction of very low priced OTC stocks) - https://www.firstrade.com/content/en-us/pricing
UPDATE 10/3/19: TD Ameritrade went to $0 commission fee - https://www.tdameritrade.com/pricing.page
SELECTING TYPE OF TRADE ACCOUNT:
I recommend opening Roth IRA trade account due to no tax paperwork for IRS each year and not paying tax when you draw from account after 59.5 years of age. (You can take out money deposited into Roth IRA after 5 years).
FOLLOWING CRITERIAS ARE USED FOR THIS BOARD:
- Listed and OTC/Pinksheet stocks priced below $5 (With the exception of high volume gainers)
- High volume stocks with 500,000+ average volume and 1,000,000+ daily volume (with exceptions of stocks I have traded previously)
- Stocks approaching or undergoing rebound (according to Swing Trading Template)
TECHNICAL CHARTS AND INDICATORS USED:
- Stock charts: https://stockcharts.com/h-sc/ui
Under "Chart Attributes", uncheck "Log Scale" and "Y-Axis Labels". Change "Overlays" to 5 and 30 Simple Moving Averages.
Start with 6 month chart to get a "big picture" then zoom into 3 and 1 month charts to get more detailed information.
- 5/30 Moving Averages: Blue and Red lines superimposed over price movements (Usually displayed as candle sticks). Instead of slower default 50/200 MA, faster 5/30 MA are used to better reflect price movements. (If price movement is too fast for 5/30 MA, use faster 2/5 MA)
WATCH as 5 MA/2 MA (Blue line) falls below 30 MA/5 MA (Red line). BUY as 5 MA/2 MA bottoms and rises towards 30 MA/5 MA. HOLD as 5 MA/2 MA rises above 30 MA/5 MA. SELL as 5 MA /2 MA peaks.
- MACD and Histogram (Moving Average Convergence Divergence): Black and Red signal lines with Blue Bars used primarily to set BUY and SHORT points.
BUY as MACD (Black line) crosses above Signal line (Red line) and Histogram goes negative to positive (sometimes positive down to zero and back to positive).
SHORT as MACD crosses below Signal line and Histogram goes positive to negative; then COVER as MACD crosses above Signal line and Histogram goes negative to positive.
- RSI (Relative Strength Index): Scaled from 0 to 100 with reference lines at 30 and 70 used primarily to set SELL points.
BUY as RSI rebounds from/below 30 (Red color on chart). HOLD as RSI rises above 50. SELL as RSI is above 70 (Green color on chart).
HOW TO USE STOCK SCREENER TO IDENTIFY REBOUNDING STOCKS:
Usually on a weekly basis, I will run the stock screener to identify stocks that may be rebounding or about to rebound.
Currently I am using FinViz with following filters and sorted by price - https://finviz.com/screener.ashx?v=141&f=geo_usa,sh_avgvol_o500,sh_curvol_o1000,sh_price_u5&o=price
- Price under $5
- 500,000+ average volume
- 1,000,000+ daily volume
HOW TO SET BUY/SELL POINTS USING TECHNICAL INDICATORS:
I will then do a technical chart review (using the Swing Trading Template) for each stock and if a stock is about to rebound, I will add to the watch list as WATCH. If a stock is rebounding, I will add as BUY. (Since OTC stocks carry potential for large gains, I also include them in my watch list)
* 12/16/18 - Adding WATCH LIST BREAKDOWN TABLE (at bottom of intro page) to make tracking/following stocks easier to determine BUY/SELL points at a glance.
Here's an example of swing trading template applied to 6 month chart of Yahoo using 5/30 MA – http://stockcharts.com/h-sc/ui
- WATCH indicated as 5MA (Blue line) fell below 30MA (Red line).
- BUY indicated as 5MA rebounded and MACD (Black line) crossed over signal line (Red line) and histogram went from negative to positive along with RSI rebound from 30.
- HOLD indicated as 5MA crossed above 30MA and stayed above 30MA.
- SELL indicated with RSI at 70 with price/MACD peaking and 5MA fell towards 30MA.

INVESTOPEDIA DEFINITIONS (From BUY to SELL and SHORT to COVER):
Dead Cat Bounce (Even stocks with bad fundamentals can bounce if they fall hard enough) - https://www.investopedia.com/terms/d/deadcatbounce.asp
Technical Rally (Share price rising against company fundamentals usually caused by Short Positions Covering) - https://www.investopedia.com/terms/t/technicalrally.asp
Reversal (Stock trend changing direction) - https://www.investopedia.com/terms/r/reversal.asp
Rounding Bottom (The Swing Trading Template is used to BUY at the bottom of the rebound for higher trade return) - https://www.investopedia.com/terms/r/roundingbottom.asp
Triangle (Share price swing narrows) - https://www.investopedia.com/terms/t/triangle.asp
Triangle will lead to Breakout Up/Down - https://www.investopedia.com/terms/b/breakout.asp
Cup and Handle (After initial rebound and profit taking, continued gain upward) - https://www.investopedia.com/terms/c/cupandhandle.asp
Trading Channel (After 5MA crosses above 30MA and continues to rise above 30MA within SUPPORT/RESISTANCE lines) - https://www.investopedia.com/terms/t/tradingchannel.asp
Rounding Top (Time to SELL) - https://www.investopedia.com/terms/r/roundingtop.asp
Profit Taking (Locking in profit. You don't make money until you SELL) - https://www.investopedia.com/terms/p/profittaking.asp
Pull Back (Share price falling) - https://www.investopedia.com/terms/p/pullback.asp
Short Selling (Making money while share price falls) - https://www.investopedia.com/terms/s/shortselling.asp
Short Covering (Usually causes Technical Rebound against company fundamentals) - https://www.investopedia.com/terms/s/shortcovering.asp
Short Squeeze (Shorts covering in a frenzy panic to stop loss) - https://www.investopedia.com/terms/s/shortsqueeze.asp
Buying or going Long (And we repeat the cycle of BUY/SELL) - https://www.investopedia.com/terms/l/long.asp
MANAGING 401K/ROTH IRA WITH MUTUAL FUNDS:
Simply putting money into 401K/ROTH IRA without managing could cause you to lose hundreds to thousands of dollars each day as fund balances grow. You can use technical charting to manage mutual funds to reduce loss of account balance each month (Also consider using funds with lower cost/fees).
For Large Cap Index mutual fund - Run DJIA chart and when BUY is signaled, move money into fund then when SELL is indicated, move money to cash.
For Small Cap Index mutual fund - Run Nasdaq chart and when BUY is signaled, move money into fund then when SELL is indicated, move money to cash.
Hope you are successful in your trades and if you benefit from information on this board, please "Pay It Forward" to someone deserving in your life in need and start checking off items on your bucket list. And more closer to my heart, consider supporting these radio stations. Thank you and God bless.
KLOVE - http:/http://www.klove.com/about/mission/
Air1 - http://www.air1.com/about/support.aspx'
The Dove - https://www.thedove.us/
RECENT ANNOTATED CHART REVIEWS:
11/26/18 ONCS - https://investorshub.advfn.com/boards/read_msg.aspx?message_id=145103738
11/26/18 SFOR - https://investorshub.advfn.com/boards/read_msg.aspx?message_id=145103665
11/27/18 HMNY - https://investorshub.advfn.com/boards/read_msg.aspx?message_id=145104641
11/27/18 PXS / DNR - https://investorshub.advfn.com/boards/read_msg.aspx?message_id=145128173
11/27/18 SHMP - https://investorshub.advfn.com/boards/read_msg.aspx?message_id=145130130
11/28/18 SHMP - https://investorshub.advfn.com/boards/read_msg.aspx?message_id=145156403
12/3/18 SHMP - https://investorshub.advfn.com/boards/read_msg.aspx?message_id=145231067
12/4/18 SHMP - https://investorshub.advfn.com/boards/read_msg.aspx?message_id=145244268
12/6/18 SN - (Intraday 5 min chart) - https://investorshub.advfn.com/boards/read_msg.aspx?message_id=145293630
12/10/18 SHMP - (14 day chart from last rebound) - https://investorshub.advfn.com/boards/read_msg.aspx?message_id=145350408
12/11/18 XSPA - https://investorshub.advfn.com/boards/read_msg.aspx?message_id=145396972
12/15/18 ZIOP - https://investorshub.advfn.com/boards/read_msg.aspx?message_id=145477421
12/15/18 ZN - https://investorshub.advfn.com/boards/read_msg.aspx?message_id=145477734
12/19/18 STNG and CANB - https://investorshub.advfn.com/boards/read_msg.aspx?message_id=145582502
12/19/18 SHMP (Intraday 5 min chart and detailed explanation of BUY speculation) - https://investorshub.advfn.com/boards/read_msg.aspx?message_id=145582814
12/22/18 SHMP - https://investorshub.advfn.com/boards/read_msg.aspx?message_id=145655037
12/24/18 SHMP (Chart at bottom of link) - https://investorshub.advfn.com/boards/read_msg.aspx?mess1/age_id=145687930
12/26/18 SHMP - https://investorshub.advfn.com/boards/read_msg.aspx?message_id=145696787
1/3/19 CANB - https://investorshub.advfn.com/boards/read_msg.aspx?message_id=145854768
1/3/19 SHMP - https://investorshub.advfn.com/boards/read_msg.aspx?message_id=145852828
1/4/19 SHMP - https://investorshub.advfn.com/boards/read_msg.aspx?message_id=145903231
1/8/19 SHMP-CLD-SSOF - https://investorshub.advfn.com/boards/read_msg.aspx?message_id=145971684
1/18/19 SHMP - https://investorshub.advfn.com/boards/read_msg.aspx?message_id=146243970
1/21/19 SHMP - https://investorshub.advfn.com/boards/read_msg.aspx?message_id=146243970
1/30/19 HMNY Short percent/Chart - https://investorshub.advfn.com/boards/read_msg.aspx?message_id=146463712
1/31/19 HMNY Short percent/Chart - https://investorshub.advfn.com/boards/read_msg.aspx?message_id=146498674
2/1/19 DRUS - https://investorshub.advfn.com/boards/read_msg.aspx?message_id=146542493
8/26/19 SHMP 7 month - https://stocktradingmodel.files.wordpress.com/2018/12/shmp-lg-8-26-19.png?
8/26/19 SHMP 3 month - https://stocktradingmodel.files.wordpress.com/2018/12/shmp-2mo-8-26-19.png?
8/28/19 SHMP 3 week "Ascending Channel" formed - https://stocktradingmodel.files.wordpress.com/2018/12/shmp-8-28-19.png?
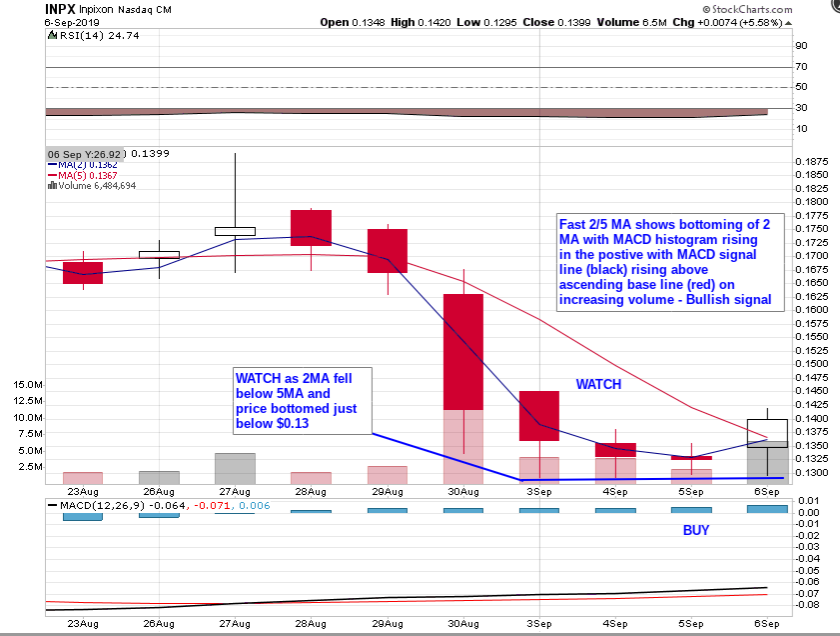
9/6/19 INPX 10 day - https://stocktradingmodel.files.wordpress.com/2018/12/inpx-9-6-19.png?
10/11/19 SLS 4 month - https://stocktradingmodel.files.wordpress.com/2018/12/sls-10-11-19.png
10/11/19 NAKD 3 month - https://stocktradingmodel.files.wordpress.com/2018/12/nakd-10-11-19.png
RECENT WATCH LIST TRADE RANGES:
- NOVEMBER 2018: 11/27 RGSE 100%+, NLST 100%+, 11/28 SHMP 75% (Intraday), 11/29 SHMP 48% (Intraday)
- DECEMBER 2018: 12/4 SFOR 90%, 12/6 CRMD 85%/SN 35%+ (Intraday), 12/12 SGYP 75%+ (Intraday)/SN 50%, 12/17 SGYP 30% (Intraday), 12/19 SHMP 60% (Intraday), 12/20 HEMP 100%/MJNA 65%/SHMP 30% (Intraday), 12/24 SHMP 125% (Cumulative), 12/26 SHMP 50% (Intraday, 175% Cumulative), 12/28 ONCI 100%/VTVT 240% (Intraday), 12/31 HMNY 90%
- JANUARY 2019: 1/2 SGYP 150% (Intraday), 1/3 SGYP 250% (Intraday cumulative), 1/4 CGIX 65% (Intraday)/CRMD 21% (Intraday)/FLKS 100%/HSGX 22% (Intraday)/PIR 23% (Intraday)/VTL 20% (Intraday), 1/7 ADXS 50% (Intraday, 100% Cumulative)/BW 45% (Intraday)/MTNB 22% (Intraday), 1/8 GSAT 100%/VTVT 31% (Intraday), 1/9 BPMX 100%, CRMD 45%, 1/10 AMRH 100%/DCIX 50% (Intraday, 100% Cumulative)/MOSY 30%, 1/11 ENDV 40% (Intraday), 1/14 ENDV (49% Intraday, 90% Cumulative)/MTNB 100% (Intraday)/TRVN 45% (Cumulative)/VTL 45% (Cumulative), 1/15 APRN 60%/BW 100%/CNET 80%/RXMD 50%/VLRX 45%, 1/17 SSOF 30% (Intraday), 1/18 UPL 29% (Intraday), 1/22 APRN 50%/MTNB 70%, 1/23 ACHN 50%/CLDX 75%/NSPR 45% (Intraday Cumulative since 1/5/19)/SHMP 75% (400% Cumulative since 12/19/18 for Run #2), 1/24 SGYP 100% (Intraday), 1/28 HMNY 60% (Intraday)/MNGA 21% (Intraday)/RAD 30%/SHMP 90% (Intraday, 600% Cumulative since 12/19/18 for Run #2)/TRVN 120% (Intraday), 1/29/19 HMNY 90% Cumulative/SGYP 80% Cumulative, 1/30/19 APRN 50% Cumulative, 1/30/19 AMMA 80% (Intraday), 1/31/19 APRN 100% Cumulative/BW 24% (Intraday)/HSGX 50%/ONCS 50% Cumulative/SHMP 31%
- FEBRUARY 2019: 2/1 DRUS 100% (Intraday)/ECR 45% (Cumulative)/TTNP 94% (Pre-market)/SHMP 29% (900% Cumulative)/WFT 19%, 2/4 PHOT 32%/SHMP 90% (Intraday, 1800% Cumulative)/SN 21%, 2/5 CLDX 200%/GERN 40%/PHOT 50%/SHMP 80% (Intraday, 2000% Cumulative), 2/6 POTN 100% (Intraday)
= Break from posting due to medical reasons/surgeries/retirement = Main Watch List resumed in June
- AUGUST 2019: 8/12 YRIV 100% (Cumulative), 8/19 NVAX 50% (Cumulative)
- SEPTEMBER 2019: 9/9 FCEL 78% (Intraday), 9/10 ASNA 90% (Intraday), FCEL 90%/HSGX 90% (Cumulative), 9/11 SHMP 70% (Cumulative), 9/12 JCP 90% (Cumulative), 9/18 GHSI 180% (Intraday from main WL), 9/20 HMNY (100% Intraday from main WL), 9/23 HMNY (200% intraday Cumulative), 9/24 HMNY (300% Cumulative), 9/25 GHSI (280% Cumulative), 9/30 AMRQQ (50% Intraday)
- OCTOBER 2019: 10/1 SNNA (100% Intraday/Cumulative), SPNV (100% Cumulative), 10/2 ENDV (60% Intraday), NAKD (90% Intraday), SPNV (200% Cumulative), 10/8 ASNA (30% Cumulative), SNNA (100% Cumulative), SPNV (300% Cumulative), 10/11 CGIX (80% Cumulative), 10/14 ASNA (60% Intraday), 10/15 ASNA (75% Intraday), 10/16 ASNA (100% Cumulative)
- NOVEMBER 2019: 11/1 LGCYQ (200% Cumulative from main WL), 11/13 FCEL (250% Cumulative), 11/14 FCEL (300% Intraday/Cumulative), 11/19 ADXS (50% Cumulative)
= Due to unexpected family surgeries/medical issues, posting stopped - Will resume later =
- MARCH 2020: 3/30 TOPS (500% Intraday cumulative)
- APRIL 2020: 4/13 BIOC (100% Intraday), 4/16 HEMP (75% Cumulative)/TRNX (140% Intraday), 4/17 TRNX (300% Intraday cumulative), 4/20 EROS/VBIV (100% Intraday cumulative), 4/21 XSPA (200% Intraday cumulative), 4/23 DSS/FET (100% Intraday cumulative), 4/24 AXAS (200% Intraday cumulative)/HUSA (250% Intraday cumulative)/ENSV (200% Intraday cumulative)/DNR (100% Intraday cumulative), 4/28 FCEL (80% Intraday cumulative)/VISL (100% Intraday cumulative)
= WATCH LIST = (Intraday BUY/SELL alerts are updated as "AM" and end of day updates as "PM"): Watch List used for this board is a smaller version of my main watch list. Often, pre/post market and intraday changes will be made to the main watch list first then here on IH watch list - https://docs.google.com/document/d/1QYXojMENZc1frWydzOJO6jil6N2l3WAXf9ifaFZd-go/edit
* 3/26/20 NOTE: Speculate on all oil stocks and watch for false rebound *
UPDATE: Due to unexpected family trip, posting stopped - Will resume watch list updates after trip
401K/Roth IRA: Hold Cash (Dow chart bearish) - https://stockcharts.com/h-sc/ui
WATCH: AXAS, BIOC, DFODQ, DNR, DSS, ENSV, EROS, FET, GHSI, GSAT, HUSA, MJNA, SHMP, WTRH
BUY: ADXS, BIOC, BNGO, CBL, GNC, HEMP, KMPH, MVIS, ONTX, PEIX, RTTR, SCON, TBLT, TOPS, TMDI, TRNX, TTI, TTNP, VBIV
HOLD: FCEL, MNK, NIO, SWN, VISL, XSPA
TAKE PROFIT / SELL:
SHORT:
COVER:
= WATCH LIST BREAKDOWN TABLE below shows where each stock from the watch list is on the Watch/Buy/Hold/Sell stock trade cycle according to chart patterns as defined by Investopedia. The table provides a quick glance overview yet detailed technical placement to help make Watch/Buy/Hold/Sell decisions.
| TYPE | WATCH | BUY | HOLD | SELL | WATCH | BUY | HOLD | SELL | SHORT | COVER |
|---|---|---|---|---|---|---|---|---|---|---|
| Dead Cat Bounce | MJNA, MVIS, SHMP, TTOO | BNGO,CBL, GNC, KMPH, TTI | MNK, XSPA | VISL | DNR, ENSV, EROS, HUSA | HEMP | ||||
| Breakout Down | ||||||||||
| Breakout Up | GHSI | ONTX,RTTR, SCON,TBLT, TMDI,TRXC, TTNP | AXAS, FET, WTRH | TOPS, TRNX | ||||||
| Rounding Bottom | PEIX | FCEL | DSS | |||||||
| Cup and Handle | SWN | VBIV | ||||||||
| Trading Channel | ||||||||||
| Rounding Top | ||||||||||
| Profit Taking | ||||||||||
| Pullback | DFODQ, GSAT | ADXS | NIO | BIOC | ||||||
| Volume | |
| Day Range: | |
| Bid Price | |
| Ask Price | |
| Last Trade Time: |


