 News
News  Market Data
  Discover
Support: 888-992-3836
Copyright © 2023 InvestorsHub Inc.


Register for free to join our community of investors and share your ideas. You will also get access to streaming quotes, interactive charts, trades, portfolio, live options flow and more tools.
IWM Millions Worth of OTM Put Sweepers Hitting The Tape (Unusual)
By: Cheddar Flow | January 3, 2024
• $IWM Millions Worth of OTM Put Sweepers Hitting The Tape (Unusual)

Read Full Story »»»
 DiscoverGold
Shopify (SHOP) Has Unusual Stock Options Activity - Highlighting SHOP Stock's Value
By: Barchart | January 3, 2024
There is unusual options activity in Shopify Inc (SHOP) today. A large tranche of out-of-the-money put options were traded. Investors see SHOP as undervalued, especially given its growing free cash flow (FCF).
The stock is trading for $72.60 and a large tranche of over 8900 put options were traded at the $64.00 strike price for expiration on Feb. 2, 2024. That is significant both because the strike price is $8.60 below today's price (i.e., out-of-the-money) and because there are only 30 days until expiration.
This large trade was reported in Barchart's Unusual Stock Options Activity Report. It is also significant because it represents a huge positive bet on SHOP stock if the trade was initiated by a short-seller of those puts.

SHOP puts expiring Feb. 2, 2024 - Barchart Unusual Stock Options Report - As of Jan. 3, 2024
For example, a short seller would have had to secure $56.96 million with their brokerage firm to sell short these puts. But in return, since the strike price received was 56 cents on the bid side, the account received almost a half million dollars. That is seen by multiplying 8900 contracts by 100 and by 56 cents (i.e., $498.4K).
That works out to an immediate yield to the short seller of 0.875% for one month's yield-to-expiration. So, the annualized expected return (ER), if the trade can be repeated 12x, is 10.5% (i.e., 0.875% x 12). That could bring in $5.98 million to the short seller if repeated every month for a year.
They must have a bullish outlook on Shopify stock. Let's look at one reason why that might be the case.
Shopify's Free Cash Flow Could Rise
Last quarter Shopify generated $276 million in free cash flow (FCF) and a 16% FCF margin. This was the fourth quarter it has had positive FCF. I expect that the company could generate at least a 20% margin during 2024.
Given that analysts forecast $8.34 billion in revenue in 2024, that means with a 20% FCF margin, free cash flow could hit $1.668 billion. That could be 3x the FCF it generated in the last 12 months (LTM) - $548 million.
In other words, the stock could rise considerably based on higher FCF. But how much?
Price Target For SHOP Stock Based On FCF Yield
One way to judge this is to use a FCF yield metric. That means you divide the FCF by its market cap. For example, $548 million in LTM FCF divided by its market cap today of $93.5 billion gives us an FCF yield of 0.586%.
What this means is that the market believes that if the company were to pay out 100% of its FCF as dividends to shareholders the dividend yield would be 0.586%.
So, that implies that if we divide our projection of $1.668 billion in FCF for 2024 by 0.6% (rounded up), the market cap for Shopify should rise to $278 billion. That implies a potential upside of 200% in SHOP stock.
So, just to be conservative let's use a 1.0% FCF yield metric. So, by dividing our $1.668 billion FCF estimate by 1.0% we get a market cap target of $166.8 billion. That is 78.3% over today's market cap of $93.5 billion.
This works out to a price target of $129.46 per share (i.e., $72.61 x 1.783).
In other words, there is still a huge upside in SHOP stock, given its massive free cash flow and FCF margins. No wonder it makes sense to short OTM puts here, given that SHOP stock looks undervalued.
Read Full Story »»»
DiscoverGold
Applovin $APP Size ITM put writer into the 01/19/24 $45P at the Bid. They have also been building a position in the 01/19/24 $45 Calls
By: FLOWrensics | January 3, 2024
• $APP Size ITM put writer into the 01/19/24 $45P at the BID
They have also been building a position in the 01/19/24 $45 CALLS.

Read Full Story »»»
DiscoverGold
Oil prices gain 3% on supply concerns after oilfield shutdown in Libya
By: Investing | January 3, 2024
NEW YORK (Reuters) -Oil prices climbed about 3% on Wednesday after a disruption at Libya's top oilfield added to fears that tensions in the Middle East could reduce global oil supplies.
Brent futures rose $2.44, or 3.2%, to $78.33 a barrel by 11:06 a.m. EST (1606 GMT), while U.S. West Texas Intermediate (WTI) crude rose $2.45, or 3.5%, to $72.83.
That put both benchmarks up for the first time in five days and on track to rise by the most in a day since mid-November.
Protests forced a full shutdown of production at OPEC member Libya's 300,000 barrel per day (bpd) Sharara oilfield.
"The Sharara shutdown certainly adds to pricing upside, especially of Brent," said Viktor Katona from energy analytics firm Kpler, who assessed the disruption as likely short-lived.
Oil prices also climbed due to continued attacks on vessels in the Red Sea by Houthi fighters.
The Iran-backed group in Yemen said it had "targeted" a container ship bound for Israel, a day after the U.S. Central Command (CENTCOM) said the Houthis had fired two anti-ship ballistic missiles in the southern Red Sea.
Israel intensified its bombing of the Gaza Strip after the war stretched into Lebanon with the killing in Beirut of Hamas' deputy leader. Israel has neither confirmed nor denied responsibility.
Energy traders worried that a wider Middle East conflict could close crucial waterways like the Red Sea and Persian Gulf for oil transportation and disrupt trade flows.
Adding to Middle East uncertainty, two explosions killed more than 100 people in OPEC-member Iran and wounded scores at a ceremony to commemorate top commander Qassem Soleimani who was killed by a U.S. drone in 2020.
The Organization of the Petroleum Exporting Countries (OPEC) said cooperation and dialogue within the wider OPEC+ oil producer alliance will continue, after OPEC member Angola last month announced it would leave the group.
OPEC+ includes OPEC and allies like Russia.
UPCOMING U.S. REPORTS
Looking ahead, the energy market is waiting for key U.S. interest rate and oil inventory data over the next couple of days.
The U.S. Federal Reserve (Fed) will release the minutes of its December meeting at 2:00 p.m. EST on Wednesday.
While the Fed is widely expected to keep rates on hold in January, traders have priced in a 65.7% chance of a 25 basis point rate cut in March, as per CMEGroup's FedWatch tool.
Lower interest rates reduce consumer borrowing costs, which can boost economic growth and demand for oil.
The American Petroleum Institute (API), an industry group, and the U.S. Energy Information Administration will release their oil inventory reports one day later than usual due to the New Year holiday with API expected around 4:30 p.m. EST on Wednesday and EIA on Thursday.
Analysts forecast U.S. energy firms pulled about 3.0 million barrels of oil from storage during the week ended Dec. 29. [EIA/S] [EIA/A]
That compares with a build of 1.7 million barrels in the same week last year and a five-year (2018-2022) average decline of 4.0 million barrels.
Separately, the U.S. Department of Energy said it is seeking to buy up to 3 million barrels of U.S.-produced sour crude oil for delivery in April to help replenish the Strategic Petroleum Reserve (SPR).
Read Full Story »»»
DiscoverGold
Midday movers: Apple, Tesla, Eli Lilly and more
By: Investing | January 3, 2024
Main U.S. indexes traded lower Wednesday, with investors consolidating ahead of the release of the minutes from the December Federal Reserve meeting.
Here are some of the biggest U.S. stock movers today:
Apple (NASDAQ:AAPL) stock fell 1% after data from research group Counterpoint indicated that the tech giant's iPhone saw its share of the worldwide smartphone market fall in November.
Tesla (NASDAQ:TSLA) stock fell 3.4% after the electric car manufacturer’s sales in China surged by 68.7% on a yearly basis last month, new data from the China Passenger Car Association showed on Wednesday, with the U.S. carmaker facing intense competition in the world’s largest auto market.
Bloomin Brands (BLMN) stock rose 0.4% after the restaurant holding company added two new members to its board, in accordance with an agreement it had reached with activist investor Starboard Value.
Walt Disney (NYSE:DIS) stock declined 0.4% after the entertainment giant said investment firm ValueAct Capital will advise it on strategy and support its director nominees at the 2024 annual shareholder meeting. Separately, Blackwells Capital launched a campaign to nominate three directors and preserve CEO Bob Iger’s “value creation vision.”
SoFi Technologies (NASDAQ:SOFI) stock fell 12.3% after Keefe, Bruyette & Woods downgraded its rating on the online personal finance company to ‘underperform’ from ‘market perform’, citing its recent outperformance.
Coinbase (NASDAQ:COIN) stock fell 1.4%, with the cryptocurrency exchange suffering as bitcoin, the world’s favorite digital currency, retreated sharply.
Verizon Communications (NYSE:VZ) stock rose 1.2% after KeyBanc upgraded its stance on the telecoms giant to ‘overweight’ from ‘sector weight’, seeing the potential for it to outshine the sector.
Agios Pharma (NASDAQ:AGIO) stock rose 4.4% after the biotech announced positive results from a Phase 3 trial of a treatment for a rare blood disorder.
AIG (NYSE:AIG) stock fell 0.4% after Reuters reported that the company was the lead insurer on a $130 million "all-risks" policy for the Japan Airlines airplane which collided with another plane at Tokyo's Haneda airport.
Keurig Dr Pepper Inc. (NASDAQ:KDP) stock fell 2% after it was cut to 'equal-weight' from 'overweight' at Morgan Stanley. Analysts said they were moving to the sideline following recent gains.
CBRE Group (NYSE:CBRE) stock fell 4% after Evercore ISI downgraded it to 'in line' from 'outperform'.
Eli Lilly (NYSE:LLY) stock rose 3.3%, leading a surge in pharma stocks. Amgen (NASDAQ:AMGN) climbed 1.4% and Merck (MRK) climbed 1.7%.
Read Full Story »»»
DiscoverGold
US stocks retreat ahead of Fed meeting minutes; Tesla slips
By: Investing | January 3, 2024
U.S. stocks retreated Wednesday, continuing the slow start to the new year ahead of the release of the minutes from the December Federal Reserve meeting.
By 06:35 ET (11:35 GMT), the Dow Jones Industrial Average was down 130 points, or 0.3%, S&P 500 traded 20 points, or 0.4%, lower and NASDAQ Composite dropped 95 points, or 0.7%.
The benchmark S&P 500 and tech-heavy Nasdaq Composite both lost ground on Tuesday, the first day of trading of 2024, weighed down in part by ebbing hopes that the Fed will roll out interest rate cuts early this year.
The 30-stock Dow Jones Industrial Average gained just under 0.1%.
Fed meeting minutes in focus
These stock benchmarks enjoyed a stunning 2023, as the S&P 500 surged more than 24% and the Nasdaq jumped 43% for its best year since 2020, as easing inflation boosted expectations that this new year would mark the start of a global easing cycle.
However, investors have started to rein in these expectations, as typified by the yield on the benchmark 10-year Treasury note -- a key gauge of long-term estimates for borrowing costs -- climbing to an over two-week high.
Attention is now turning to the minutes from the Fed's December gathering, due later Wednesday, when the policymakers signaled interest rate cuts of 75 basis points this year.
Investors are now fretting that the minutes will offer up an outlook that is not as dovish as these projections suggested.
Tesla posts jump in Chinese sales
In the corporate sector, Tesla (NASDAQ:TSLA) stock fell 2.2% despite the electric vehicle manufacturer’s sales in China surging by 68.7% on a yearly basis last month, new data from the China Passenger Car Association showed on Wednesday.
Tesla faces intense competition in the country, with the latest CPCA numbers showing China's BYD (SZ:002594) unseated Tesla as the world's biggest EV maker earlier this week.
Bloomin Brands (NASDAQ:BLMN) stock rose 1.2% after the restaurant holding company added two new members to its board, in accordance with an agreement it had reached with activist investor Starboard Value.
Crude rises ahead of U.S. stockpiles
Oil prices rose Wednesday amid rising tensions in the Red Sea, ahead of the release of crucial weekly inventories data from the U.S., the world’s largest consumer.
By 09:35 ET, the U.S. crude futures traded 1.5% higher at $71.47 a barrel, while the Brent contract traded 1.6% higher at $77.14 a barrel.
U.S. crude stockpiles from the American Petroleum Institute industry group are due later Wednesday, a day later than usual due to Monday’s New Year’s holiday, ahead of the official data on Thursday.
The crude benchmarks had posted strong gains earlier in the week as attacks on vessels in the Red Sea by Houthi rebels over the weekend had raised concerns of potential supply disruptions through this key region.
Additionally, gold futures fell 1.6% to $2,040.35/oz, while EUR/USD traded 0.3% lower at 1.0915.
Read Full Story »»»
DiscoverGold
S&P Defensives / Cyclicals
By: Nautilus Research | January 3, 2024
• S&P Defensives / Cyclicals.

Read Full Story »»»
DiscoverGold
Bonds Daily Market Movers (% Price Change)
By: Marty Armstrong | January 3, 2024
• Top Movers
China BMK 2 Yr YLD (CH) 3.64 %
Singapore BMK 10 Yr YLD (SPD) 3.33 %
UK BMK 30 Yr YLD (GBP) 3.14 %
UK BMK 10 Yr YLD (GBP) 3.12 %
Hong Kong BMK 10 Yr YLD (HKD) 3.06 %
• Bottom Movers
Tanzania BMK 10 Yr YLD 5.51 %
Brazil BMK 30 Yr YLD (USD) 1.17 %
LIFFE Long Gilt 0.93 %
US CBT US 30 Year T Bond Futures 0.9 %
Norway BMK 5 Yr YLD (NK) 0.86 %
*Close from the last completed Daily
DiscoverGold
ETFs Daily Market Movers (% Price Change)
By: Marty Armstrong | January 3, 2024
• Top Movers
US - Grayscale Bitcoin Trust 6.44 %
US - ProShares UltraPro Short QQQ 5.13 %
US - ProShares Ultra Bloomberg Natural Gas 5.03 %
US - United States Natural Gas Fund LP 2.37 %
US - ProShares UltraShort Bloomberg Crude Oil Commodity 2.15 %
• Bottom Movers
US - ProShares UltraPro QQQ 5.07 %
US - Proshares Ultrashort Bloomberg Natural Gas 5.02 %
US - ARK Innovation ETF 3.57 %
US-Kraneshares CSI China Internet ETF 3.44 %
US - VanEck Vectors Semiconductor ETF 3.37 %
*Close from the last completed Daily
DiscoverGold
Orders by Fidelity customers
Rank is based on the total of buy and sell orders for the security.
Information shown below in the table is based on the aggregate number of orders entered by Fidelity Brokerage Services LLC self-directed retail customers “as of” the date and time shown.
As of Jan-3-2024 12:12 PM ET
Symbol % Change # Buy orders Buy/sell ratio # Sell orders Sector
TSLA -3.43% 2,354
Buy 49.67%
Sell 50.33%
2,385 Consumer Discretionary
NVDA -0.96% 1,760
Buy 52.62%
Sell 47.38%
1,585 Information Technology
AAPL -0.99% 1,708
Buy 51.31%
Sell 48.69%
1,621 Information Technology
MSFT +0.08% 729
Buy 26.9%
Sell 73.1%
1,981 Information Technology
NEXI +235.58% 1,015
Buy 40.42%
Sell 59.58%
1,496 Health Care
MARA +1.54% 1,115
Buy 48.25%
Sell 51.75%
1,196 Information Technology
TQQQ -2.84% 1,125
Buy 50.65%
Sell 49.35%
1,096
AMD -2.45% 979
Buy 48.93%
Sell 51.07%
1,022 Information Technology
SOXL -6.90% 975
Buy 50.97%
Sell 49.03%
938
SQQQ +2.89% 686
Buy 36.51%
Sell 63.49%
1,193
MULN -7.08% 51
Buy 2.75%
Sell 97.25%
1,806 Consumer Discretionary
SPY -0.72% 1,008
Buy 58.4%
Sell 41.6%
718
ABVC +57.50% 726
Buy 45.52%
Sell 54.48%
869 Health Care
AMZN -0.32% 675
Buy 43.86%
Sell 56.14%
864 Consumer Discretionary
COIN -1.74% 740
Buy 50.14%
Sell 49.86%
736 Financials
QQQ -0.93% 915
Buy 68.44%
Sell 31.56%
422
SOFI -13.89% 758
Buy 59.54%
Sell 40.46%
515 Financials
SOXS +6.93% 350
Buy 33.3%
Sell 66.7%
701
PLTR -2.71% 781
Buy 75.53%
Sell 24.47%
253 Information Technology
RIVN -4.38% 569
Buy 60.66%
Sell 39.34%
369 Consumer Discretionary
VOO -0.65% 774
Buy 84.87%
Sell 15.13%
138
SHOP -3.30% 493
Buy 55.83%
Sell 44.17%
390 Information Technology
FWBI +34.55% 364
Buy 41.94%
Sell 58.06%
504 Health Care
INTC -1.79% 409
Buy 49.88%
Sell 50.12%
411 Information Technology
SASI +48.28% 390
Buy 48.51%
Sell 51.49%
414 Information Technology
META -0.56% 390
Buy 48.51%
Sell 51.49%
414 Communication Services
GOOGL +0.31% 424
Buy 55.14%
Sell 44.86%
345 Communication Services
PFE +0.20% 426
Buy 56.5%
Sell 43.5%
328 Health Care
VZ +1.39% 349
Buy 47.48%
Sell 52.52%
386 Communication Services
LBPH -7.67% 395
Buy 53.96%
Sell 46.04%
337 Health Care
Today's 4 Stock Market Movers: $NEXI $SASI $SIDU $UK
By: Barchart | January 3, 2024
• Today's 4 Stock Market Movers: $NEXI $SASI $SIDU $UK


Read Full Story »»»
DiscoverGold
Apple (AAPL), Microsoft (MSFT) and a host of other tech stocks are likely to help boost the Nasdaq composite to hit 20,000 according to Wedbush Securities.
Wall Street Lunch (Seeking Alpha)
Tech analyst Dan Ives says: "While we can see ebbs and flows in the coming months given Fed jawboning/macro factors, we believe tech stocks will be up 25% in 2024 with a NASDAQ 20k level our bull case scenario as the Street is still significantly underestimating how quickly this AI monetization cycle is playing out among enterprises in the field."
Ives listed Apple, Microsoft , Google (GOOG) (GOOGL), Palo Alto Networks (PANW), Palantir (PLTR), Zscaler (ZS), CyberArk (CYBR), Crowdstrike (CYBR) and MongoDB (MDB) as his favorite tech stocks for 2024.
He added recent channel checks at the end of the fourth quarter showed that AI monetization has started to "positively impact" the broader tech sector, as companies like Nvidia (NVDA), Microsoft, Google, Datadog and Palantir have all demonstrated multiplying use cases in both the enterprise and consumer landscapes.
But on the flip side, Apple caught a downgrade from Barclays on amid concerns over its hardware business, including the iPhone 15.
Analyst Timothy Long lowered his rating on Apple to Underweight from Equal-Weight, pointing out that sales for the iPhone 15 line, unveiled in September, have been uninspired.
Long, who also cut his price target to $160, does not expect much from the iPhone 16 line, widely expected to be released in the fall of this year.
In addition, he said there has been a "lack of bounce back" from the Macs, iPads and wearables business lines. Apple introduced new Macs, along with its new M3 processors, in October, and several new Macs last January.
WallStreetLunch
Best Video Game Stock Electronic Arts (EA) To Own This Month
By: Schaeffer's Investment Research | January 3, 2024
• EA tends to outperform in January, historically
• An unwinding of pessimism could also benefit the stock
Among the 25 best stocks to own in January is video game name Electronic Arts Inc. (NASDAQ:EA). Per Schaeffer's Senior Quantitative Analyst Rocky White's list of best S&P 500 Index (SPX) equities that tend to outperform this month, historically, EA averaged a 6% gain in seven out of the last 10 years.
Though Electronic Arts stock is fractionally lower this afternoon, last seen trading at $135.63, the $135 level that moved in as a layer of support in late-November once again stepped up to thwart today's small dip. At its current perch, a comparable to previous years would put EA at its highest level since November 2021 and add to its 10.2% year-over-year lead

An unwinding of pessimism in the options pits could provide the equity with some additional tailwinds. Over at the International Securities Exchange (ISE), Cboe Options Exchange (CBOE), and NASDAQ OMX PHLX (PHLX), the stock's 10-day put/call volume ratio of 1.59 ranks higher than 86% of readings from the past year. Echoing this, its Schaeffer's put/call open interest ratio (SOIR) of 1.15 stands above 83% of annual readings.
For those looking to bet on the pop, doing so with options looks to be an affordable route. Electronic Arts stock's Schaeffer's Volatility Index (SVI) reading of 17% stands in the low 10th percentile of its 12-month range -- a signal that options traders are pricing in less volatility at the moment.
Read Full Story »»»
DiscoverGold
SoFi Technologies among financials losers, BTCS in gainers
Jan. 03, 2024 12:00 PM ET
By: Mary Christine Joy, SA News Editor
Gainers:
Yiren Digital (YRD) +11%.
American Coastal Insurance (ACIC) +7%.
X Financial (XYF) +7%.
BTCS (BTCS) +6%.
Prestige Wealth (PWM) +6%.
Losers:
Hallmark Financial Services (HALL) -22%.
SoFi Technologies (SOFI) -14% after ratings downgrade.
SHF Holdings (SHFS) -12%.
Bit Brother (BETS) -11%.
Bitcoin Depot (BTM) -11%.
S&P 500 Financials Sector -0.62% to 624.89. Banks (contributes 33.9% to index) -1.19% to 350.86. Financial Services (contributes 45.8% to index) -0.78% to 1081.84. Insurance (contributes 20.3% to index) +0.83% to 649.92.
A commenter on GM Report
Rex Rode
Today, 11:53 AM
But it's laughable how pathetic their EV sales are in comparison. GM continues to have massive problems manufacturing their Ultium battery system to scale while also having serious software issues. Mix in their issues with Cruise and U are talking about a massive drain of capital. Mary Barra receives a D when it comes to EV and a B+ on everything else.
Investor optimism set the tone for a strong finish to 2023
By: Raymond James Financial | January 2, 2024
• The S&P 500 reversed its 2022 losses, and then some, closing the year near a record high.
A choir of optimistic investor sentiment closed 2023 on a high note, as expectations of “steep cuts to interest rates” may be at odds with the Federal Reserve’s (Fed) actual sheet music. Considering the tumult of the year as sentiment focused on economic and inflation data, this discordance isn’t all that surprising and could signal volatility to come, but in the meantime, the market environment looks a lot brighter at the tail end of 2023 than it did at the close of a dreary 2022.
“December’s rally was fueled by a further deceleration in inflation and the Federal Reserve’s switch at the last FOMC (Federal Open Market Committee) meeting of the year to a more dovish tone and talk of Fed interest rate cuts in 2024,” said Raymond James Chief Investment Officer Larry Adam. “However, it is important to put the positive year of performance into perspective: 2023 was a reset year as the over 25% return for the S&P 500 only recouped all the losses from 2022.”
While the Dow Jones Industrial Average notched seven record highs in 2023, the S&P 500 closed the year less than 1% from all-time highs. Tech-related sectors were the best performers for the year, as the NASDAQ 100 and its leading artificial intelligence stocks saw its best year since the 1999 tech bubble. And small-cap equities, which had been a significant underperformer for the year, showed signs of a resurgence as it was the best performer in the fourth quarter.
Still, it may be too soon to celebrate the Fed engineering a “soft landing” – a return to the target inflation rate without a recession. For one, inflation remains above the 2.0% target. Two, the lagging effects of its rate hike program continue to cool economic activity. And three, the repercussions of higher economic growth or any other geopolitical event with the potential to disrupt food and energy prices could directly influence inflation and shape future Fed policy.
But even a conservative reading of the Fed’s messaging suggests interest rate cuts to come through 2024. That said, the Fed has demonstrated its commitment to calming inflationary pressures, it appears they are turning their attention to the economy where there are more and more signs of the economy slowing.
* * *
Composite index points to recession
The Leading Economic Index, a composite index from The Conference Board that seeks to forecast turning points in the business cycle, declined for its 20th consecutive month in November, weakening further than expected. The Conference Board said it expects a “short and shallow recession in the first half of 2024.”
Movement suggests broadening equity market growth
To a significant degree, the incredible performance of a small formation of high-flying, mega-cap tech stocks propped up headline equity indices through 2023, providing a sense of a stronger market than experienced by a more diversified position. The average stock, by comparison, has been in a two-year bear market. Recent activity since the start of the October rally suggests positive movement below the surface, meaning 2024 could bring more opportunity for those stocks left behind. December saw 10 of the 11 sectors finish in the green, with interest-rate sensitive sectors leading the way.
Treasury yields lowered as sentiment improves
Fixed income prices soared, continuing to demonstrate the strength of the market through December. Reflecting improving expectations, the yield on the 5-year Treasury ended November at 4.27% and closed December at 3.85%. The 10-year yield declined from 4.33% to 3.88%. The year’s high interest rates allowed investors an opportunity to lock in elevated income levels while the year-ending price strength provided those participants with positive total returns.
Waning OPEC+ vigilance brings oil prices down
Production discipline among the OPEC+ group, amid a return to pre-COVID demand, has been slipping, bringing oil prices to near 2023 lows in December. Particularly, Saudi Arabia and Russia have expressed displeasure at smaller OPEC members that are flagrantly producing beyond their quota levels, cheating the cartel, in effect.
European central banks yet to message lowering rates
Like the U.S.’s Fed, the European Central Bank and Bank of England held monetary conditions steady through December as economic activity continues to slow. Meanwhile, large-cap equities – particularly German stocks – dashed upward to close the year with strength, as the Eurostoxx 600, a composite index of 600 European stocks, hit 23-month highs. Unlike the Fed, the British and European monetary authorities have not signaled the lowering of interest rates. Investor sentiment has swung toward a growth outlook but fears that higher-for-longer rates could unnecessarily deepen and lengthen a recession could cause investor sentiment to rapidly reverse.
U.S. and China resume military-to-military talks
An agreement to resume military-to-military communication secured in November at the meeting of President Joe Biden and President Xi Jinping came to fruition in December, ending a 17-month communications impasse between the two world powers’ armed forces. This is generally seen as supporting stability, as military-to-military communications can act as a critical avenue for addressing miscommunications and flare-ups around key geopolitical flashpoints, such as in the Taiwan Strait and South China Sea.
The bottom line
At this time last year, no one could have projected the highs and lows that would follow – the incredible first two quarters, the midsummer reversal, then the even more remarkable end-of-year rally. We start 2024 in much stronger position, owing to the progress made on inflation, and that’s heartening – strength often begets strength. However, sluggish economic growth and the potential for investor sentiment to suddenly shift are potential risks, as is the potential of a recession. That’s worth remembering, even when the forecast is clear.
Read Full Story »»»
DiscoverGold
Fixed Income Market Conditions and Insight for Bond Investors
By: Raymond James Financial | January 2, 2024
• Forecasting
Welcome to 2024! As we wade into the new year, you will undoubtedly read and hear a wide range of forecasts predicting what financial markets are going to bring us over the next 12 months. While taking in a range of predictions and forecasts is informative and can provide valuable market color and data, keep in mind that these are all just guesses about the future. Putting too much weight on strategies that require correctly timing the market could be detrimental should forecasts turn out to be incorrect. Yes, all of the forecasts you come across will (hopefully) be well researched, backed by sound and logical thinking, and will be rational. This does not mean that they are going to come to fruition. Come December 31st, for every money manager out there that was correct with their predictions there will likely be multiples more that were not even close (What percent of active managers actually outperform the market?).
Just how difficult is it to accurately predict the future on a consistent basis? The chart below shines some light on the question by highlighting the prediction for the 10-year Treasury yield at the beginning of each year (red lines) based on the Survey of Professional Forecasters which is conducted by the Philadelphia Federal Reserve. The blue line shows actual 10-year Treasury yields. Notice how often these predictions were correct. Predicting the future is hard. Unforeseen events happen on a regular basis and often determine the direction of the financial markets.
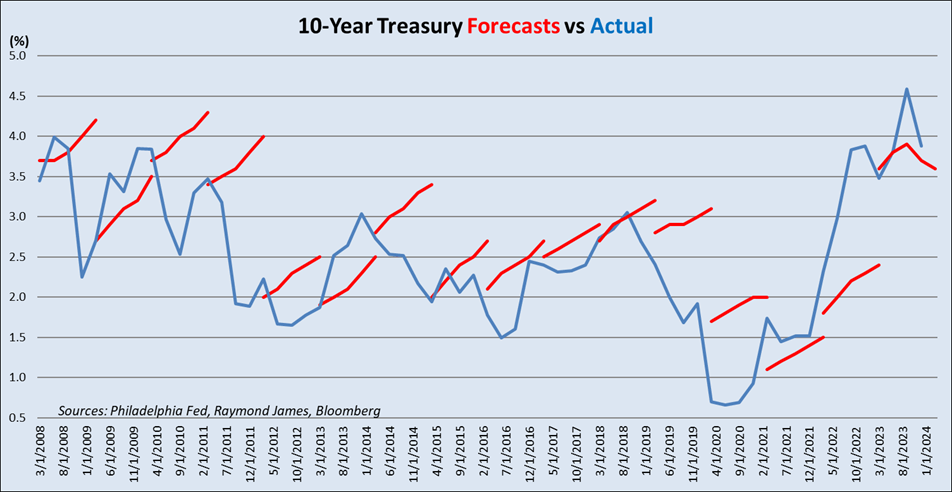
What does this mean for fixed income investors? The beautiful thing about owning individual bonds is that returns are not dependent on what the market does in the future. For buy-and-hold investors, once a bond is purchased, its yield, cash flow, and maturity value are locked in and are unaffected by changes in interest rates*. If you buy a 5-year bond yielding 5% today, it doesn’t matter what interest rates do over the next 5 years. Currently, although yields are off their recent highs of a few months ago, they still remain at some of the most attractive levels in over a decade. In the face of an endless stream of predictions and forecasts, putting money to work in an investment vehicle that requires neither is something to consider as we wade into the unknowns of 2024.
Read Full Story »»»
DiscoverGold
General Motors records 2023 U.S. total sales of 2.6M vehicles, up 14%
Jan. 03, 2024 11:41 AM ET
By: Jaskiran Singh, SA News Editor
GM Reclaims Spot As Top Automaker In U.S., As It Overtakes Toyota
General Motors (NYSE:GM) Wednesday said it recorded total U.S. sales of 2.6M vehicles in 2023, an increase of 14%.
2023 Chevrolet sales were up 13%
2023 Cadillac sales were up 9%
2023 Buick sales were up 61%
2023 GMC sales were up 9%
2023 GM Envolve sales were up 20%
"In 2024, we expect industry sales to remain strong and we’re excited about the opportunities ahead as we expand customer choice with new vehicles like the Chevrolet Equinox EV and Cadillac Escalade IQ," said Marissa West, GM senior vice president and president, North America.
Select Sectors Performance % Change
By: Thom Hartle | January 3, 2024
• 11:20 CST Excel % NC Dashboard. At the moment, $XLE Energy Select Sector is the top performer.

Read Full Story »»»
DiscoverGold
In the last three trading days of 2023, the Waltons sold over $1.39 BILLION in Walmart shares
By: TrendSpider | January 3, 2024
• In the last three trading days of 2023, the Waltons sold over $1.39 BILLION in Walmart shares.
That is some serious size. $WMT

Read Full Story »»»
DiscoverGold
Crude Oil
72.40 +2.87%
Gold
2,040.10 -1.61%
US 10 Year
39.42 -0.10%
DJIA
37,474.09
-240.95 (-0.64%)
NASDAQ
14,620.93
-145.01 (-0.98%)
S&P 500
4,709.74
-33.09 (-0.70%)
Market Valuation, Inflation and Treasury Yields
By: Jennifer Nash | January 3, 2024
Our monthly market valuation updates have long had the same conclusion: US stock indexes are significantly overvalued, which suggests cautious expectations for investment returns. On August 4, 2020, the 10-year Treasury yield hit its all-time low of 0.52%. As of December 31, it was 3.88%.
P/E10 and Inflation
Here is a scatter graph with the market valuation on the vertical axis (log scale) and inflation on the horizontal axis. It includes some key highlights:
1. The extreme overvaluation and irrational period of the tech bubble
2. The valuations since the start of COVID recession
3. The average P/E10
4. Where we are today
The inflation figure in the highlighted box is year-over-year. I have also highlighted the inflation "sweet spot" in purple, which I discuss below. Note on inflation: The inflation figure is extrapolated for last month is based on the previous two months.

The inflation "sweet spot", the range that has supported the highest valuations, is approximately between 1.4% and 3%. We highlighted the extreme valuations associated with the tech bubble, which we chose arbitrarily as a P/E10 of 25 and higher.
The latest P/E10 valuation is 31.5 at a 3.25% year-over-year inflation rate. The inflation rate is just outside the sweet spot and the current P/E10 valuation is in the extreme valuation territory mentioned above. Again, a note on inflation: the inflation figure is extrapolated based on the previous two months. The Census Bureau's CPI figure for the previous month does not come out until mid-month. These extrapolated figures are then updated to the current Census Bureau number when released.
P/E10 and the 10-Year Treasury Yield
A common question is whether a valuation metric such as the P/E10 has any merit in a world with Treasury yields at low levels. Investors who require portfolio growth might indeed be motivated to disregard historic indicators that warn of an overvalued market. But what does history show us about the correlation between the P/E10 and the 10-year constant maturity yield? The next scatter graph offers some clues. The horizontal axis has been switched to the 10-year yield. The chart uses a log scale to better illustrate the relative yields values.
On the recommendation of Ed Easterling of Crestmont Research, I have adjusted the chart to begin in 1960. Prior to the 1960s, bond yields did not respond consistently to changes in the inflation rate. We've highlighted the inflation "sweet spot" here as well. Note that the P/E10 valuation is in extreme valuation territory - the highlighting is only meant to spotlight the inflation interval.

In the months following the great financial crisis (red dots above), we were in "uncharted" territory. Never in history have we had 20+ P/E10 ratios with yields below 2.5%. The latest monthly average of daily closes on the 10-year yield is at 4.02%, which is below its all-time monthly average of 5.3%.
Read Full Story »»»
DiscoverGold
Monthly job openings hit lowest level since March 2021
Josh Schafer·Reporter for Yahoo Finance
Wed, Jan 3, 2024, 10:13 AM EST
Job openings hit their lowest level since March 2021 in November, coming in lower than Wall Street expected and reflecting a continued cooling in the labor market to end 2023.
There were 8.79 million jobs open at the end of November, a slight decrease from the 8.85 million job openings in October, according to new data from the Bureau of Labor Statistics released Wednesday. Economists surveyed by Bloomberg had expected there were 8.82 million openings in November.
"The latest JOLTS data should please Fed officials as it marks another step toward healthier labor market conditions," Nationwide financial market economist Oren Klachkin wrote in a note to clients on Wednesday.
The report also showed the quits rate, a sign of confidence among workers, slipped to 2.2%, down from 2.3% in the previous month, and its lowest level since September 2020. Additionally, the JOLTS report showed 5.5 million hires were made in the month, a slight decrease from the 5.9 million seen last month.
The hiring rate fell to 3.5% down from 3.7% in October.
"That's a sign of a labor market that's a little bit softer than what it was, you know, before the COVID shock and that warrants some attention," EY chief economist Greg Daco told Yahoo Finance. "It's nothing worth panicking about."
"It's nothing excessively concerning but both [hiring and quits rates] are worth monitoring carefully because further deterioration in the hiring rate and the quits rate would indicate more malaise in the labor force."
Wednesday's data added to the recent market narrative that the labor market is cooling while inflation continues on its downward trajectory.
The JOLTS report kicks off a key week of releases for the labor market that will end with Friday's December jobs report. The report is expected to show 170,000 nonfarm payroll jobs were added to the US economy last month while the unemployment rate ticked higher to 3.8%, according to data from Bloomberg.
Josh Schafer is a reporter for Yahoo Finance.
Combined Estimated Long-Term Fund Flows and ETF Net Issuance
By: ICI | January 3, 2024
• Washington, DC; January 3, 2024—Total estimated inflows1 to long-term mutual funds and exchange-traded funds (ETFs) were $21.16 billion for the week ended December 27, 2023, the Investment Company Institute reported today.
Equity funds2 had estimated inflows of $17.29 billion for the week, compared to estimated inflows of $7.31 billion in the previous week. Domestic equity funds had estimated inflows of $13.05 billion, and world equity funds had estimated inflows of $4.23 billion.
Hybrid funds2—which can invest in stocks and fixed-income securities—had estimated outflows of $1.75 billion for the week, compared to estimated outflows of $800 million in the previous week.
Bond funds2 had estimated inflows of $5.73 billion for the week, compared to estimated inflows of $1.26 billion during the previous week. Taxable bond funds saw estimated inflows of $5.96 billion, and municipal bond funds had estimated outflows of $230 million.
Commodity funds2—which are ETFs (both registered and not registered under the Investment Company Act of 1940) that invest primarily in commodities, currencies, and futures—had estimated outflows of $103 million for the week, compared to estimated outflows of $258 million in the previous week.
Read Full Story »»»
DiscoverGold
DYN My gracious. I'm only down 3% now.
$16.62 +3.56 (+27.26%)
A commenter on the shipping disruption
Djreef1966
Today, 8:31 AM
The only solution is Operation Commandos with Operation Big Guns mounted on the deck of every ship. Operation Missile Strike will take care of the rest.
Tesla $TSLA Millions worth of Call Sweepers attempting to buy this dip (Unusual)
By: Cheddar Flow | January 3, 2024
• $TSLA Millions worth of Call Sweepers attempting to buy this dip (Unusual)

Read Full Story »»»
DiscoverGold
$NVDA Heavy Call Selling Hitting The Tape This Morning
By: Cheddar Flow | January 3, 2024
• $NVDA Heavy Call Selling Hitting The Tape This Morning

Read Full Story »»»
DiscoverGold
SoFi Technologies (SOFI) Stock Sharply Lower After Downgrade
By: Schaeffer's Investment Research | January 3, 2024
• KBW downgraded SOFI to "underperform" from "market perform"
• Options traders are chiming in on the dip
SoFi Technologies Inc (NASDAQ:SOFI) stock is plummeting today, down 13.1% at $8.39 at last glance, after a downgrade from Keefe, Bruyette & Woods (KBW) to "underperform" from "market perform," with a price-target cut to $6.50 from $7.50. The majority of analysts lean bearish on the equity, with only six of the 19 in coverage carrying a "buy" rating.
Today's drop has SOFI back below familiar pressure at the $9 level, as well as recent support at its 20-day moving average. In the last year, the equity is still up 87.9%.
Options traders are chiming in on the dip, with 164,000 calls and 198,000 puts exchanged so far, which is triple the amount typically seen at this point. The January 8 put is the most popular, with new positions opening there.
Meanwhile, though short interest has been unwinding -- down 10% in the last two weeks -- it still represents 14.5% of the stock's available float. It would take shorts over three days to cover their bets, at SOFI's average pace of trading.
Read Full Story »»»
DiscoverGold
Qualcomm (QCOM) Stock's January Doldrums Could Be Starting
By: Schaeffer's Investment Research | January 3, 2024
• Plus, another 25 stocks to avoid this month
• QCOM doesn't have the best January performance track record
Chip stocks were all the rage in 2023 amid artificial intelligence (AI) advancements. While the sector still looks promising, there's one name in particular investors may want to avoid in early 2024. More specifically, Qualcomm Inc (NASDAQ:QCOM) has historically underperformed in January, and seems to be sticking to this trend so far today, last seen down 1.6% at $137.99.
Per data from Schaeffer's Senior Quantitative Analyst Rocky White, QCOM averaged a January loss of 3.3% over the past 10 years, and finished the month in the red seven of those times. A comparable move from the security's current perch would place it below $135.

Shares are today testing support from the 20-day moving average, which has been in place since early November, as they continue to pull back from their Dec. 28, 52-week high of $146.89. Qualcomm stock still sports an impressive 30.8% year-over-year lead.

An unwinding of optimism in the options pits could hurt QCOM. Over at the International Securities Exchange (ISE), Cboe Options Exchange (CBOE), and NASDAQ OMX PHLX (PHLX), QCOM's 50-day call/put volume ratio of 2.01 ranks higher than 89% of readings from the past year.
Premiums are affordably priced, per the equity's Schaeffer's Volatility Index (SVI) of 24% that sits higher than just 10% of annual readings, meaning short-term options are pricing in lower-than-usual volatility expectations.
Read Full Story »»»
DiscoverGold
Big Tech Stock to Target This Month
By: Schaeffer's Investment Research | January 3, 2024
• GOOGL is a safe bet to make in January
• Plus, 24 other stocks that are worth considering to start 2024
Even as the tech-heavy Nasdaq tumbles amid slightly higher interest rates, investors should consider adding Dow component Alphabet Inc (NASDAQ:GOOGL) to their portfolio to kick off the new year.
Digging deeper, seasonality suggests shares of the 'Magnificent Seven' member could jump this month, per data from Schaeffer's Senior Quantitative Analyst Rocky White. Shares of Google's parent company stand near the top of White's list of the best performing stocks on the S&P 500 stocks in January, going back 10 years. In fact, the security saw positive monthly returns during this time period seven out of ten times, boasting an 3.9% pop on average.

Just after the morning bell, GOOGL is down 0.9% to trade at $137.09, though it remains within a chip shot of its late-December, roughly 20-month highs above the $142 level. Plus, the shares are just off a more than 53% annual gain.
For those looking to place their bets on the blue-chip tech giant, options are affordable at the moment. This is per Alphabet stock's Schaeffer's Volatility Index (SVI) of 22% that ranks in the 8th annual percentile, which suggests options traders are pricing in lower-than-usual volatility expectations.
Read Full Story »»»
DiscoverGold
More disruption
Marking another blow to Operation Prosperity Guardian, shipping giant A.P. Moller-Maersk (OTCPK:AMKBY) has halted all transit through the Red Sea and the Suez Canal after a weekend attack on one of its ships. There have been 24 attacks against merchant shipping in the Southern Red Sea since Nov. 19, according to the U.S. Central Command. "If we don’t protect the Red Sea, it risks emboldening those looking to threaten elsewhere, including in the South China Sea and Crimea," warned U.K. Defense Secretary Grant Shapps. Popular shipping stocks ended in the green on Tuesday, the result of higher booking costs for some tankers amid lengthy diversions, including ZIM (ZIM) +13.4%, Maersk (OTCPK:AMKBY) +7.2%, Hapag-Lloyd (OTCPK:HPGLY) +5.2%.
WSBrkfst
January 2024 Almanac: Historically Solid, But Weaker in Election Years
By: Almanac Trader | January 3, 2024
January has quite a reputation on Wall Street as an influx of cash from yearend bonuses and annual allocations has historically propelled stocks higher. January ranks #1 for NASDAQ (since 1971), but sixth on the S&P 500 and DJIA since 1950. January is the last month of the best three-consecutive-month span and holds a full docket of indicators and seasonalities, our Santa Claus Rally ends on the close on January 3, the First Five Days early warning system reports on the close on January 8 and the full-month January Barometer at month’s end.
DJIA and S&P January rankings slipped from 2000 to 2022 as both indices suffered losses in 13 of those 24 Januarys with three in a row in: 2008 to 2010, 2014 to 2016 and then again from 2020 to 2022. January 2009 has the dubious honor of being the worst January on record for DJIA (-8.8%) and S&P 500 (-8.6%) since 1901 and 1930 respectively. Covid-19 spoiled January in 2020 & 2021 as DJIA, S&P 500, Russell 1000, and Russell 2000 all suffered declines in 2020. In 2021, DJIA, S&P 500 and Russell 1000 declined. In 2022 surging inflation, that reached multi-decade highs, stoked fears of higher interest rates. Fears were ultimately validated as a bear market ensued.

In election years, Januarys have been weaker. DJIA and S&P 500 slip to number #8 and DJIA average performance dips negative. NASDAQ slips to #4, but average performance remains respectable at 1.7%. Russell 2000’s average performance of 0.8% is the result of all five advancing Januarys gaining over 4% which offsets the losses in six other election-year Januarys.
Read Full Story »»»
DiscoverGold
Again today Berkshire Hathaway (BRK.B) is up +$4.83 (1.33%) on a down market day. No news...
DiscoverGold
DYN $15.73 +2.67 (+20.41%)
There had to be a big dump this morning. That seems to have been sustained. Now, fighting its way back north. Lots of day trading &/or algos in the meantime.
I'm down 10% and holding- but in the most skittish of way, lol.
Look at that chart, sheesh..
https://stockcharts.com/h-sc/ui?s=DYN
Update: DYNE THERAPEUTICS INC
$15.91 +2.8529 (+21.84%)
As of Jan-03-202411:46:28 AM ET
Volume 13,069,876
10/90-day avg. vol. 677K / 614K
Day range $12.33- $18.73
52-week range $6.40 - $18.73
Another commenter on Record Debt
MNrodent
Today, 8:29 AM
The accumulated national debt can only be paid off when we get bipartisan support to create budgets that actually create a budget SURPLUS -- spending less than we bring in via taxes. The US government has run a SURPLUS in only 12 budget years since 1940. In 10 of these 12 years (83.3%), there were either Republicans controlling BOTH the house and the senate OR a Republican President. Coincidence? I do not think so. It is time for government to balance the books for the preservation of everything we collectively hold important in this still great country. It is shameful that we are living for today on the backs of our children and grandchildren who will inherit this debt. We need a balanced budget amendment now, and it should not require any increases in taxes or further reductions to our military budget to accomplish this.
A commenter on Record Debt
Middle American
Today, 10:51 AM
As a percentage of the total economy, govt tax receipts are right in line with where they have been historically. Spending on the other hand, has increased dramatically. Our fearless leaders in DC might choose to "solve" this issue with tax increases. But, make to mistake, we are here because of lack of spending control, not tax cuts.
Wall Street Breakfast: Record Debt
Jan. 03, 2024 7:30 AM ET22 Comments
Record debt
The United States is ringing in the new year with a lot of red ink as the national debt surpassed $34T for the first time. The gloomy fiscal milestone, reported by the Treasury Department, comes as Congress braces for another fight over federal spending. Unless lawmakers can agree on another short-term continuing resolution to fund the government, or pass appropriations bills by Jan. 19 (and others by Feb. 2), the U.S. would face its first federal shutdown since 2019.
On the rise: Not only is the overall balance increasing, but the cost of servicing the national debt is rising at a rapid clip. "The interest paid on the federal debt so far this fiscal year is $900B, but this is soon going to reach $1T... and [it] is clear that the situation is unsustainable," SA analyst WWS Swiss Financial Consulting wrote in The Fed And The Debt. Higher deficits can also make inflation a bigger problem for the central bank, which uses monetary policy to keep prices stable but has little say over what happens on the fiscal side, where outsized spending has been the norm across both parties.
Credit rating agencies are also taking notice, with Moody's recently cutting its credit outlook on the U.S. to negative from stable, citing heavier downside risks to the country's fiscal strength. Fitch lowered America's credit rating following the debt ceiling drama last summer, while S&P was the first to downgrade U.S. government debt in 2011. Kicking the can further down the road also makes the issue harder to resolve and can result in drastic action instead of phasing things in like lower spending or higher taxes.
Tipping point? There's no magic number or level for when a government's debt begins to hurt its economy, and the U.S. has easily handled a much heavier debt load than was once thought possible despite doomsday warnings for several decades. However, extreme partisanship has left both parties pointing fingers, with the GOP citing bloated federal spending programs that passed during the Biden administration - like the Infrastructure Investment and Jobs Act, the CHIPS and Science Act and the Inflation Reduction Act - and Democrats referencing the "trillions spent on Republican tax cuts skewed to the wealthy and big corporations." Hard compromises will have to be made over tax increases, while the parties must be willing to tinker with the government's biggest expenses, such as Medicare, Social Security and the military.
Toyota Motor North America 2023 U.S. sales rise 6.6% on EV demand
Jan. 03, 2024 11:12 AM ET
By: Sinchita Mitra, SA News Editor
https://stockcharts.com/h-sc/ui?s=TM
Toyota Motor North America (TMNA) said its year-end 2023 U.S. sales rose 6.6% on a volume basis to 2.2M vehicles, driven by electric vehicles demand.
The rise represents an increase of 7% percent on a daily selling rate (DSR) basis compared to 2022.
The company added its electrified vehicle sales- battery, hybrids, plug-ins and fuel cells – surged 30%.
The firm reported 2023 electrified vehicle sales of 657.3K,
"By the end of 2025, we plan to have an electrified option available for every Toyota and Lexus vehicle in the U.S.," said Jack Hollis, executive vice president, sales, TMNA.
US auto sales likely jumped in 2023; new year to be challenging
REUTERS - 6:11 AM ET 1/3/2024
(Reuters) - U.S. new vehicle sales likely rose by a low double-digit percentage in 2023 on sustained demand for crossover SUVs and pickup trucks, but analysts fear a challenging year ahead, with high interest rates eating into demand.
Automakers ramped up their output to keep up with a surge in consumers interest in new vehicles for personal mobility after the pandemic, but demand is set to ease due to a number of factors.
Industry consultant Cox Automotive called 2023 "a surprisingly strong sales year" but added "high vehicle prices and high interest rates remain the industry's Grinch right now, and that trend will continue into next year."
(con't)
Orders by Fidelity customers
Rank is based on the total of buy and sell orders for the security.
Information shown below in the table is based on the aggregate number of orders entered by Fidelity Brokerage Services LLC self-directed retail customers “as of” the date and time shown.
As of Jan-3-2024 10:10 AM ET
Symbol % Change # Buy orders Buy/sell ratio # Sell orders Sector
TSLA -3.98% 1,838
Buy 52.82%
Sell 47.18%
1,642 Consumer Discretionary
AAPL -0.90% 1,440
Buy 52.38%
Sell 47.62%
1,309 Information Technology
NVDA -1.37% 1,536
Buy 56.12%
Sell 43.88%
1,201 Information Technology
NEXI +224.80% 966
Buy 42.5%
Sell 57.5%
1,307 Health Care
MSFT +0.29% 598
Buy 26.46%
Sell 73.54%
1,662 Information Technology
TQQQ -2.63% 985
Buy 53.65%
Sell 46.35%
851
MARA -2.53% 956
Buy 52.33%
Sell 47.67%
871 Information Technology
AMD -3.02% 819
Buy 51.06%
Sell 48.94%
785 Information Technology
SOXL -6.97% 858
Buy 54.48%
Sell 45.52%
717
SQQQ +2.69% 587
Buy 38.98%
Sell 61.02%
919
MULN -7.20% 46
Buy 3.16%
Sell 96.84%
1,411 Consumer Discretionary
ABVC +64.13% 692
Buy 49.64%
Sell 50.36%
702 Health Care
SPY -0.78% 804
Buy 58.13%
Sell 41.87%
579
COIN -4.18% 668
Buy 53.31%
Sell 46.69%
585 Financials
AMZN +0.26% 508
Buy 44.52%
Sell 55.48%
633 Consumer Discretionary
QQQ -0.86% 774
Buy 69.54%
Sell 30.46%
339
SOFI -13.51% 628
Buy 62.67%
Sell 37.33%
374 Financials
SOXS +6.84% 305
Buy 34.42%
Sell 65.58%
581
PLTR -2.65% 669
Buy 75.85%
Sell 24.15%
213 Information Technology
FWBI +33.64% 355
Buy 42.72%
Sell 57.28%
476 Health Care
SASI +51.72% 368
Buy 47.48%
Sell 52.52%
407 Information Technology
VOO -0.70% 634
Buy 84.2%
Sell 15.8%
119
RIVN -5.81% 504
Buy 67.29%
Sell 32.71%
245 Consumer Discretionary
LBPH -8.09% 386
Buy 53.99%
Sell 46.01%
329 Health Care
META -0.09% 332
Buy 48.75%
Sell 51.25%
349 Communication Services
INTC -1.53% 347
Buy 52.1%
Sell 47.9%
319 Information Technology
PFE +0.35% 370
Buy 57.81%
Sell 42.19%
270 Health Care
KLAC -1.38% 20
Buy 3.18%
Sell 96.82%
609 Information Technology
VZ +1.38% 295
Buy 46.97%
Sell 53.03%
333 Communication Services
GOOGL +0.10% 329
Buy 55.57%
Sell 44.43%
263 Communication Services
52 week lows
$20+ stocks
Symbol Last % Change Volume
STAA $29.40 -1.11% 224.1K
JUCY $23.68 +0.04% 11.5K
52 week highs
$20+ stocks
Symbol Last % Change Volume
REGN $915.23 +1.13% 142.5K
MCK $482.69 +1.96% 293.4K
AMP $382.40 +0.89% 146.3K
AMGN $300.64 +1.09% 654.8K
AIZ $172.72 +1.68% 78.3K
Top % losers
Across all markets
Symbol Last % Change Volume
EJH $1.78 -53.40% 3.3M
PNST $9.39 -29.42% 86.5K
ESPR $2.14 -26.88% 7.4M
TCBP $2.40 -23.32% 143.2K
PRSO $7.34 -22.25% 20.3K
Top % gainers
Across all markets
Symbol Last % Change Volume
NEXI $7.66 +222.53% 36.1M
SIDU $12.18 +74.70% 7.4M
ABVC $1.86 +54.88% 45.7M
SASI $4.28 +47.58% 11.6M
HLP $2.98 +37.21% 944.5K
Top $ losers
Across all markets
Symbol Last % Change Volume
MTD $1,151.74 -5.14% 48.7K
MSTR $630.73 -7.94% 736.1K
BKNG $3,440.37 -1.15% 88.2K
ZJYL $216.00 -15.31% 23.2K
MELI $1,500.89 -1.85% 64.1K
Top $ gainers
Across all markets
Symbol Last % Change Volume
AZO $2,606.61 +1.48% 24.5K
LLY $610.48 +3.09% 1.4M
ORLY $957.57 +1.33% 62.7K
NOC $480.54 +2.22% 208.1K
NRGU $437.53 +2.41% 17.1K
Volume movers
2-day
Symbol Last % Change Volume
SIDU $12.06 +73.06% 6.8M
TAOP $1.58 -16.39% 707.6K
LAES $1.34 +14.10% 6.4M
SATS $15.11 -3.82% 1.5M
DSKE $8.10 +0.12% 1.4M
|
Followers
|
1141
|
Posters
|
|
|
Posts (Today)
|
0
|
Posts (Total)
|
648882
|
|
Created
|
12/19/06
|
Type
|
Free
|
| Moderators SkeBallLarry fuzzy DiscoverGold Tuff-Stuff MiamiGent | |||


DISCLAIMER:
1. DO THE MATH!!! - Before placing any trade, do the math. Where is the trigger? Where is the proper stop based on the chart setup? How many shares should I buy? This is easy to figure out. You never want to lose more than 1% of your trading account balance on any given trade. So, if you have a $30,000 account, your maximum acceptable loss on any given trade should be $300. If the stop is .20 cents below the entry price (again, based on the chart setup), then you should not buy more than 1500 shares (for the purpose of this lesson I have left commissions out of the equation for simplicity).
2. PAY YOURSELF!!! - Once you have a small profit (I use a dime as a rough personal guideline) sell part of your position and move your stop to breakeven on the rest. You will have very few losing trades if you do this, and the losses you do have will be small.
3. STOP TRADING!!! - What do I mean by this? If you hit your daily goal (everyone should have one and make it realistic) stop trading. Afternoons are tougher to trade than mornings anyway, so take the money and run....tomorrow is another day.
4. STOP TRADING!!! - Didn't we go over this already? Well, this one has another meaning. If you lose 1/2 the amount of your daily goal, stop trading and come back tomorrow. For instance, if your goal is to make $500 a day, and you are down $250 on the day, quit for the day. This is the best way to avoid falling into a 'trading death spiral'.
DOW 30 HEATMAP
http://www.stockmarketdrama.com/dow30heatmap.php
http://finviz.com/futures_charts.ashx?p=m5
This is a great free site to get some good info about technical analysis.
www.informedtrades.com/trades.php
http://stockcharts.com/school/doku.php?id=chart_school
http://stockcharts.com/school/doku.php?id=chart_school:chart_analysis:chart_patterns
Charting tools
http://www.stockcharts.com
http://www.chartpatterns.com
http://stockcharts.com/education/IndicatorAnalysis/
http://www.investopedia.com/categories/technicalanalysis.asp
http://www.candlesticker.com/Default.asp
http://candlestickforum.com/PPF/Parameters/16_332_/candlestick.asp
http://www.incrediblecharts.com/technical/candlesticks.htm
http://www.chartpatterns.com/
http://www.investopedia.com/university/technical/techanalysis8.asp
http://stockcharts.com/school/doku.php?id=chart_school:technical_indicators
http://www.freestockcharts.com/
http://www.barchart.com/
|
Posts Today
|
0
|
|
Posts (Total)
|
648882
|
|
Posters
|
|
|
Moderators
|
| Volume | |
| Day Range: | |
| Bid Price | |
| Ask Price | |
| Last Trade Time: |


