 News
News  Market Data
  Discover
Support: 888-992-3836
Copyright © 2023 InvestorsHub Inc.


Register for free to join our community of investors and share your ideas. You will also get access to streaming quotes, interactive charts, trades, portfolio, live options flow and more tools.
its dirt cheap here Cork, loaded up at .19
STADF St. Andrew Goldfields (.27) owns and operates the Holt and Holloway mines in the Timmins Mining District, northeastern Ontario, and is also advancing its Taylor Project into commercial production.
FY 2014 production of 90,676 ounces of gold http://web.tmxmoney.com/article.php?newsid=73454884&qm_symbol=SAS
Website: http://www.sasgoldmines.com/s/Home.asp
TSX: http://web.tmxmoney.com/quote.php?qm_symbol=SAS
Pinksheets: http://www.otcmarkets.com/stock/STADF/quote
IHUB: http://investorshub.advfn.com/boards/board.aspx?board_id=7027
chart]http://stockcharts.com/c-sc/sc?s=SAS.TO&p=D&yr=1&mn=0&dy=0&i=p14016437848&r=1428551118715[/chart]
xxx
Well, all central banks owned by Rothschild -
http://bloginfo.educate-yourself.eu/2013/03/list-of-banks-owned-by-the-rothschild-family/
when China back up their reserve currency with gold -
all Rothschild's banks have to follow -
they will confiscate the peoples gold - ex....
Effect of the order -
Executive Order 6102
Executive Order 6102 required all persons to deliver on or before May 1, 1933,
[color=red]all but a small amount of gold coin, gold bullion, and gold certificates
owned by them to the Federal Reserve, in exchange for $20.67 (equivalent
to $376.58 today[4]) per troy ounce. Under the Trading With the Enemy Act
of 1917, as amended by the recently passed Emergency Banking Act of
March 9, 1933, violation of the order was punishable by fine up to
$10,000 (equivalent to $182,185 today[4]) or up to ten years in prison,
or both.[/color]
The people will hand over the gold to the Rothschild's banks -
the people will NOT GO TO JAIL FOR 10yrs -
Rothschild has figured out how to get the peoples all gold for the fiat
666 poncy scheme -
it worked for Rothschilds fed in 1933 -
it will work again -
crimminals often will repeat the crimes to they get to jail -
I don't buy physical and only Precious metal mines producers -
they will be on 3shift / day / production -
like Homestake was in 1933 -
http://en.wikipedia.org/wiki/Executive_Order_6102
diversification is the name of the game -
God Bless
so let´s hope for better times ahead :)
Putin Signs Law On Ratification of $100 Billion BRICS New Development Bank Deal -

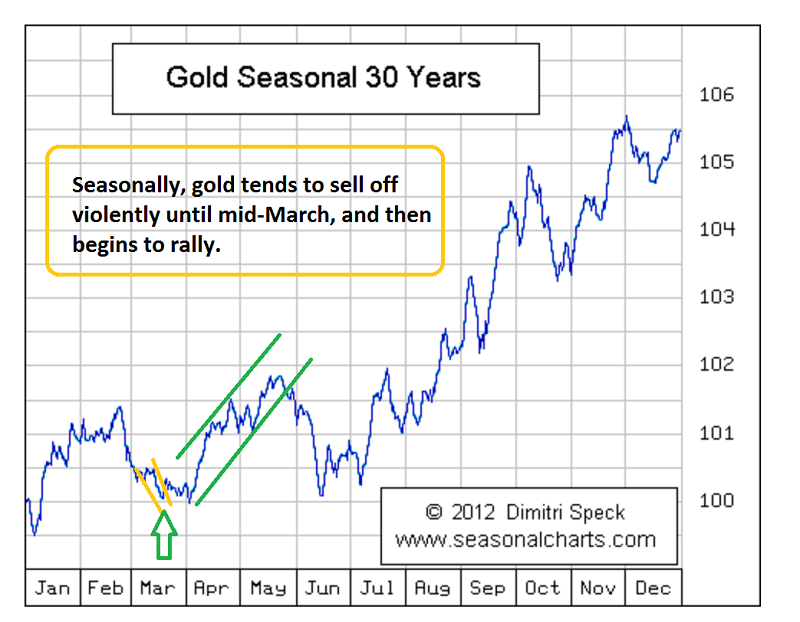

Gold Price: The Good News -
Rallies of $100 - $200 are quite normal in these types of technical -
situations, and there’s more good news.
That’s the seasonal chart for gold, courtesy of Dimitri Speck.
From a cyclical perspective, gold tends to sell-off quite violently -
until mid-March.
Then it typically bases, and rallies strongly.
The main reason it does that, is because of -
the Indian wedding season.
That begins in mid-March, and continues -
until June.
Mining CEO Rob McEwen forecasts $5,000 gold -
12:52 pm by Orkan Ozkan column image
Rob McEwen, founder of the major gold mine Goldcorp and CEO of
McEwen Mining, told investors at the Prospectors & Developers Association
of Canada (PDAC) convention on Wednesday that he continues
“to believe we’re going to see higher prices in gold.”
How much higher? Up to $5,000/oz., he suggested in his presentation.
He spoke of the exploding U.S. money supply, stating that
the Federal Reserve has expanded it “dramatically, without precedent.”
He also discussed the national debt, which now stands
above $18 trillion (see this post for visuals of just how huge that number is),
warning “this historically has been a rather dangerous place to have
debt, that amount of debt.”
The goal of taking on more debt and expanding the monetary supply is to
get consumers to spend more, he said. But that goal is not being
achieved:
“All this extra debt, all this money expansion has not produced the
spending that the government’s looking for.
This suggests to me that … there’s going to be more quantitative easing,
there’s going to be higher levels of debt relative to the GDP.
And that in turn leads to inflation.”
He added that a Gauguin painting was recently sold by Sotheby’s for just
under $300 million, while a condo in New York went for $95 million.
He believes this “send[s] a message that money is not valuable anymore.”
McEwen also acknowledged that annual gold production is on the decline and
exploration has been “cut to the bone.”
He sees strength in gold demand, however, and referenced the rumor that
production of the Apple Watch luxury edition containing up to 2 oz. of
gold could use up a third of the world’s annual gold supply.
Regardless of whether McEwen’s forecast becomes reality, why not
buy gold while prices are still low?
Call American Bullion today
at 1-800-326-9598 to speak with a precious metals broker about
buying gold or silver for your retirement account or
direct delivery to your home.
You may also request a Free Gold Guide by submitting the form at
the top of this page.
http://investorshub.advfn.com/boards/read_msg.aspx?message_id=111587897
God Bless
goforthebet' on 'ST. ANDREW GOLDFIELDS (TSX:SAS)
thank you -
https://www.lewrockwell.com/2015/03/no_author/a-gold-backed-chinese-currency/
I hold about 100% of my assets in precious metals mines -
Because the banking sector is run by an academic mafia.
They are the destroyers of the purchasing power of fiat-money.
The professors at the federal reserve — they don’t care about ordinary
people.
They are not even independent.
They are ruled by someone that tells them, “you do this, you do that.”
And that is largely the banking cartels…
Now other countries [besides the US] have grown dramatically, but
all I can say is I would hold precious metals mines
because of the central banks in the world.
This is not a currency war, this is an agreement among academics and
professors that do not relate to life of ordinary people
to print fraud slave fiat paper poncy scheme money…
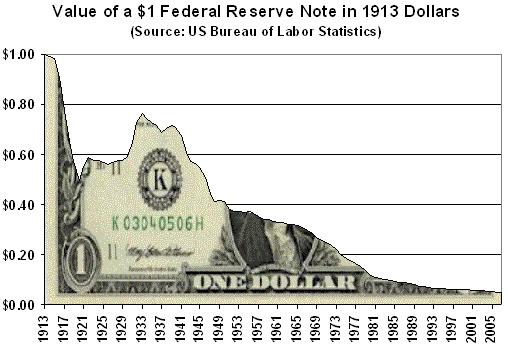
The purchasing power of fiat-money will continue to decline -
as it done since 1913 -
http://investorshub.advfn.com/ST-ANDREW-GOLDFIELDS-TSX-SAS-7027/
A gold mine represent production of the REAL MONEY -
http://www.sasgoldmines.com/s/Home.asp
cheers -
God Bless
Ps.

how long will khazarian gypsy 666 king pins run of counterfitted paper slave
poncy scheme be able to fool the world -
http://beforeitsnews.com/alternative/2015/03/russia-issues-international-arrest-warrant-for-rothschild-soros-2-3119172.html
I agree with what you say.. we just don´t know how long this guys will manipulate the markets
https://www.lewrockwell.com/2015/03/no_author/a-gold-backed-chinese-currency/
I hold about 100% of my assets in precious metals mines -
Because the banking sector is run by an academic mafia.
They are the destroyers of the purchasing power of fiat-money.
The professors at the federal reserve — they don’t care about ordinary
people.
They are not even independent.
They are ruled by someone that tells them, “you do this, you do that.”
And that is largely the banking cartels…
Now other countries [besides the US] have grown dramatically, but
all I can say is I would hold precious metals mines
because of the central banks in the world.
This is not a currency war, this is an agreement among academics and
professors that do not relate to life of ordinary people
to print fraud slave fiat paper poncy scheme money…
The purchasing power of money will continue to decline.
http://investorshub.advfn.com/ST-ANDREW-GOLDFIELDS-TSX-SAS-7027/
A gold mine represent production of the REAL MONEY -
http://www.sasgoldmines.com/s/Home.asp
cheers -
God Bless
SAS Announces Appointment of New Director
Date : 03/09/2015 @ 4:30PM
Source : PR Newswire (Canada)
Stock : ST. Andrew Goldfields Ltd. (SAS)
Quote : 0.275 0.0 (0.00%) @ 3:30AM
SAS Announces Appointment of New Director
Print
Alert
ST Andrew Goldfields (TSX:SAS)
Intraday Stock Chart
Today : Tuesday 10 March 2015
Click Here for more ST Andrew Goldfields Charts.
TORONTO, March 9, 2015 /CNW/ - St Andrew Goldfields Ltd. (TSX-SAS) (OTCQX-STADF), ("SAS" or the "Company") today announced that effective immediately, Eric R. Roblin has been appointed to the Board of Directors. Mr. Roblin is a partner at Folger, Rubinoff LLP and has acted as general corporate counsel to numerous public and private issuers in the mining, pharmaceutical, technology and renewable power industries. His involvement has extended to all aspects of corporate legal matters, including corporate governance, continuous disclosure, and material corporate transactions.
About SAS
SAS (operating as "SAS Goldmines"), is a gold mining and exploration company with an extensive land package in the Timmins mining district, north-eastern Ontario, which lies within the Abitibi greenstone belt, the most important host of historical gold production in Canada.
SAS owns and operates the Holt and Holloway mines. The Company is also advancing the Taylor Project and is conducting an aggressive exploration program across 120km of land straddling the Porcupine-Destor Fault Zone.
SOURCE St Andrew Goldfields Ltd.
Copyright 2015 Canada NewsWire
gold an miners got beaten down again yesterday!!! and it looks like its going further today
Taylor - 64,000 oz/year -
From the conference call. Expected production for 2015 -
90,000 from Holt/Holloway -
16,000 from Taylor in the 4th quarter for a total of 106,000 oz.
Did you get that? 16,000 * 4 quarters = 64,000 oz / year.
That is 71% increase in production.
I am surprised the market didn't pick this up.
Getting the mine closure plan in place should cause some excitement.
They should announce it in a news release.
Read more at
http://www.stockhouse.com/companies/bullboard/t.sas/st-andrew-goldfields-ltd#CTQTVegSHY7V71Bt.99
God Bless
SAS reports 2014 fourth quarter and year end results, increases reserves and resources,
and announces a positive production decision for the Taylor Project -

All dollar amounts are stated in Canadian dollars, unless otherwise indicated
TORONTO, Feb. 12, 2015 /CNW/ - St Andrew Goldfields Ltd. (T-SAS), ("SAS" or the "Company")
Q4 2014 and FY 2014 HIGHLIGHTS
Gold production - Production from the Holt and Holloway Mines in Q4 2014
was 22,643 ounces of gold, a decline of 7% from Q4 2013, as mining
operations at the Hislop Mine ceased since mid-2014.
FY 2014 production of 90,676 ounces of gold achieved the mid-range of
the Company's 2014 production guidance.
Gold sold - Sold 20,744 ounces of gold in Q4 2014 at an average realized
price (1) of US$1,202 per ounce for revenues of $28.4 million.
Gold sales revenue of $124.0 million for FY 2014 decreased by $19.0
million or 13% from FY 2013 due to a 10% decline in gold price and
the decrease in production.
Total cash cost per ounce of gold sold (1) - Mine cash costs decreased by
16% to US$706 per ounce for Q4 2013. In conjunction with a royalty cost of
US$110 per ounce, total cash cost (1) for Q4 2014 was US$816 per ounce.
For FY 2014 mine cash cost of US$738 per ounce of gold sold was below the Company's guidance.
All-in sustaining cost (AISC) (1) - Decreased by 11% or US$123 from Q4 2013
to US$1,042 per ounce of gold sold in Q4 2014. FY 2014, AISC of US$1,072
per ounce of gold sold, down by US$101 per ounce, when compared to FY 2013.
Cash margin from operations (1) -
Increased by 18% from Q4 2013 to $9.2 million earned in Q4 2014. For FY
2014 SAS earned cash margin of $40.5 million, a decrease of $10.8 million
as compared to $51.3 million for FY 2013, substantially due to a 10%
decline in gold price.
Operating cash flow -
SAS generated $7.6 million in operating cash flow for Q4 2014 as compared
to $6.9 million in Q4 2013.
Cash flow from operations for FY 2014 was $30.9 million, or $0.08 on a per
share basis, as compared to $36.5 million or $0.10 per share in FY 2013.
The Company was successful in controlling operational spending to adapt to
the low gold price environment.

http://www.sasgoldmines.com/i/pdf/Presentation-nov-2014.pdf
Website:
http://www.sasgoldmines.com
God Bless
SAS reports 2014 fourth quarter and year end results, increases reserves and resources, and announces a positive production decision for the Taylor Project
Canada NewsWire
TORONTO, Feb. 12, 2015
All dollar amounts are stated in Canadian dollars, unless otherwise indicated
TORONTO, Feb. 12, 2015 /CNW/ - St Andrew Goldfields Ltd.(STADF) , ("SAS" or the "Company") incurred a net loss attributable to shareholders for Q4 2014 of $0.07 million or nil, on a per share basis, compared to net loss of $4.4 million, or $0.01 per share, in Q4 2013. Adjusted net earnings (1) for Q4 2014 was $0.1 million, or nil, on a per share basis as compared to an adjusted net loss (1) of $4.7 million or $0.01 share for Q4 2013.
For FY 2014, net loss attributable to shareholders was $8.8 million or $0.02 per share as compared to net loss of $5.0 million or $0.01 per share for FY 2013. The FY 2014 result includes a one-time non-cash impairment loss on the Aquarius Project of $13.1 million.
Adjusted net loss (1) for FY 2014 was $0.3 million, or nil, on a per share basis as compared to an adjusted net loss (1) of $5.4 million, or $0.01 per share, for FY 2013.
Q4 2014 and FY 2014 HIGHLIGHTS
Gold production - Production from the Holt and Holloway Mines in Q4 2014 was 22,643 ounces of gold, a decline of 7% from Q4 2013, as mining operations at the Hislop Mine ceased since mid-2014. FY 2014 production of 90,676 ounces of gold achieved the mid-range of the Company's 2014 production guidance.
Gold sold - Sold 20,744 ounces of gold in Q4 2014 at an average realized price (1) of US$1,202 per ounce for revenues of $28.4 million. Gold sales revenue of $124.0 million for FY 2014 decreased by $19.0 million or 13% from FY 2013 due to a 10% decline in gold price and the decrease in production.
Total cash cost per ounce of gold sold (1) - Mine cash costs decreased by 16% to US$706 per ounce for Q4 2013. In conjunction with a royalty cost of US$110 per ounce, total cash cost (1) for Q4 2014 was US$816 per ounce. For FY 2014 mine cash cost of US$738 per ounce of gold sold was below the Company's guidance.
All-in sustaining cost (AISC) (1) - Decreased by 11% or US$123 from Q4 2013 to US$1,042 per ounce of gold sold in Q4 2014. FY 2014, AISC of US$1,072 per ounce of gold sold, down by US$101 per ounce, when compared to FY 2013.
Cash margin from operations (1) - Increased by 18% from Q4 2013 to $9.2 million earned in Q4 2014. For FY 2014 SAS earned cash margin of $40.5 million, a decrease of $10.8 million as compared to $51.3 million for FY 2013, substantially due to a 10% decline in gold price.
Operating cash flow - SAS generated $7.6 million in operating cash flow for Q4 2014 as compared to $6.9 million in Q4 2013. Cash flow from operations for FY 2014 was $30.9 million, or $0.08 on a per share basis, as compared to $36.5 million or $0.10 per share in FY 2013. The Company was successful in controlling operational spending to adapt to the low gold price environment.
_______________________________
(1) Refer to "Non-GAAP Measures" of this release for a
discussion and the reconciliation of these non-GAAP
measurements to the Company's 2014 Annual Financial
Statements.
OUTLOOK FOR 2015
SAS is forecasting 2015 annual production of between 85,000 -- 95,000 ounces of gold from Holt and Holloway with similar mine cash cost estimates as in 2014 of between US$750 and US$800 per ounce of gold sold.
The Company is also focused on bringing its wholly-owned Taylor Project towards commercial production by the end of 2015.
Capital budgets for 2015 of $26.0 million consist of the following:
Expressed in millions of Canadian dollars
Holt$16.0
Holloway 0.9
Holt Mill 2.0
18.9
Taylor (net of gold sales during pre-production of
$10.0) 7.0
Corporate and Other 0.1
$26.0Exploration programs in 2015 will continue to focus on key targets at Holt Deep (Zone 4 Extension), Taylor, Holloway East Complex, the Hislop property, and several near mine targets at Holt and Holloway.
"2014 was a transitional year for SAS, where we saw a 30% increase in throughput at Holt, the extension of mine life at Holloway, and the depletion of open pit reserves at Hislop. Overall, we are proud of our production achievement this year and wish to thank our employees for their contribution throughout the year," said Duncan Middlemiss, President and CEO of SAS. "We are also pleased with the results of the Taylor second bulk sample and have made the decision to advance the project towards production. This represents a new mining front for the Company and we look forward to maximizing the potential at Taylor. Our exploration programs have delivered excellent results in 2014, and are the main contributor in the 25% increase in the year end Mineral Reserves and the 24% increase in the Inferred Mineral Resource category. We look forward to reporting on our progress in developing Taylor as our next mine and in other areas as 2015 advances."
Conference Call Information
A conference call will be held Friday, February 13, 2015 at 10:00 a.m. (EST) to discuss the fourth quarter and annual 2014 results. Participants may join the call via webcast at www.sasgoldmines.com or call in toll free at 1-866-212-4491. A playback of the conference call will be available via the website and will be posted within 24 hours of the call.
Mineral Reserves and Mineral Resources Update
Compared to the December 31, 2013 Mineral Reserves Estimates, the December 31, 2014 Mineral Reserves Estimates increased from approximately 668,000 ounces of gold to approximately 833,000 ounces of gold. The net increase in Mineral Reserves, taking into account FY 2014 production of 90,676 ounces (97,725 ounces in-situ) depleted from 2013 Mineral Reserve Estimates, was approximately 263,000 ounces.
Compared to the December 31, 2013 Mineral Resources Estimates, the December 31, 2014 Mineral Resources Estimates have decreased by approximately 135,000 ounces of gold or 5% in the measured and indicated categories and increased by 1,065,000 ounces of gold or 98% in the inferred category. Most notably, the gain of just over 1 million of inferred ounces is due to the addition of new zones such as McKenna West, DL Zone, Zone 4 West, NBS, and Zone 4 Vertical at the Holt Mine.
SAS -- Mineral Reserves Estimates (December 31, 2014)
Property Proven Probable Proven + Probable
Tonnes('000) Grade Ounces Au Tonnes Grade Ounces Au Tonnes Grade Ounces Au
(g/t Au) ('000 oz) ('000) (g/t Au) ('000 oz) ('000) (g/t Au) ('000 oz)
Holt 1,452 4.26 199 2,414 5.05 392 3,866 4.75 591
Holloway - - - 233 5.35 40 233 5.35 40
Taylor - - - 774 6.27 156 774 6.27 156
Hislop - - - 280 5.16 46 280 5.16 46
TOTAL 1,452 4.26 199 3,701 5.33 634 5,153 5.03 833
Notes:
-----------------------------------------------------------
a) Mineral Reserves were estimated by Management according
to CIM Definition Standards -- November 2010;
b) Mineral Reserves were estimated using a gold price
of US$1,250 per ounce and an exchange rate of C$1.08
= US$1.00;
c) Mineral Reserves for Holt were estimated using a "stope
by stope" method at an averaged cut-off grade of 3.02
g/t Au;
d) Mineral Reserves for Holloway were estimated using
a "stope by stope" method at an average cut-off grade
of 4.11 g/t Au;
e) Mineral Reserves for Hislop were estimated using a
"stope by stope" method at an average cut-off grade
of 3.00 g/t Au for Thor;
f) Mineral Reserves for Taylor were estimated using a
"stope-by-stope" method with average cut-off grade
of 3.48 g/t;
g) Tonnes and gold ounce information is rounded to the
nearest thousands. As a result, rows and columns may
not add up exactly due to rounding.
h) Work was done under the supervision of Keyvan Salehi,
P.Eng., MBA, (SAS Sr. Director of Corp Dev & Tech
Services).
Reason: Pending News, TORONTO, Feb. 12, 2015 /CNW/ - The following issues have been halted by IIROC:
Company: St. Andrew Goldfields Ltd.(STADF)
TSX Symbol: SAS (all issues)
Reason: Pending News
Halt Time (ET): 2:59 PM
IIROC can make a decision to impose a temporary suspension (halt) of trading in a security of a publicly-listed company. Trading halts are implemented to ensure a fair and orderly market. IIROC is the national self-regulatory organization which oversees all investment dealers and trading activity on debt and equity marketplaces in Canada.
SOURCE Investment Industry Regulatory Organization of Canada (IIROC) -
STADF continues uptrend
looks like the bottom was about Christmas 2014
Peter Schiff, will China do a Switzerland? Video
Hi Bob, know you are into this stuff when saw this http://aun-tv.com/2015/02/will-china-pull-a-switzerland-on-the-u-s-dollar-peter-schiff-video/
Likely others here too. Gold over $2500 if this happens, JMHO
STADF responded, its been doing good. 9 grams is great.
CLGRF has done spectacular profits wise and is projecting that to continue, they have figured out how to mine 50% to 100% faster and are in better grade. You will see audio link on that board.
Holding both expected more than doubles from here.
Cheers
SAS releases preliminary results of the second bulk sample from Taylor
Advanced Exploration Project
Successful extraction and mill reconciliation of 17,540 tonnes at 9.01 g/t
with 97.4% recovery rate for 4,948 ounces of gold produced
TORONTO, Jan. 27, 2015 /CNW/ -
St Andrew Goldfields Ltd. (TSX-SAS) (OTCQX-STADF), ("SAS" or the "Company")
is pleased to announce the preliminary results of the second bulk sample
from its wholly owned Taylor Advanced Exploration Project.
Preliminary Highlights Second Bulk Sample
17,540 tonnes extracted from the 1004 lens and processed at the Holt Mill
Mill reconciled head grade of 9.01 g/t of Au in comparison to the geologically forecasted head grade of 7.20 g/t
Mill recovery rate of 97.4% was 2.4% higher than originally anticipated
recovery rate of 95%
http://web.tmxmoney.com/article.php?newsid=73041236&qm_symbol=STADF:US
Final evaluation of the sample tower program expected by middle of February 2015
Note: The above figures are preliminary in nature and are being verified by 106 representative samples from the 2nd bulk sample. These samples were collected using a sample tower prior to processing of the material and are currently being analyzed by a third party.
"We are extremely pleased with the results of the second bulk sample at Taylor", said Duncan Middlemiss, President and CEO of SAS. "We are waiting for the final evaluation of our sampling tower program by a third party; however, these results from the mill reconciliation are compelling. The head grade of 9.01 g/t is 25% higher than the geological head grade forecast of 7.20 g/t, and the recovery rate of 97.4% exceeds the anticipated recovery rate of 95%. The sample mining of the 1004 Lens was a representative sample. Material was extracted through drifting and longhole mining methods, which would be the core methods to mine this deposit successfully. We look forward to providing another update later in the current quarter once a full report of the bulk sample has been compiled."
Drilling, Assaying and QA/QC
Underground drilling was conducted by Azimut Boreal Drilling Services Inc. Analytical work for the drill core from the Taylor Project was performed by AGAT Laboratories, an accredited lab located in Mississauga, Ontario. Gold analysis was conducted using an industry standard Pulp metallic assay technique. Chip samples and muck samples were collected by SAS geological personnel for all underground drift faces and backs. Analytical work for the underground samples was performed by SGS Laboratories using a fire assay preparation and gravimetric gold analysis. SGS Laboratories located in Cochrane, Ontario is an accredited lab.
Qualified Person
Mine development and evaluation activities at Taylor and processing at the Holt Mill are being conducted under the supervision of Marc-Andre Pelletier, P. Eng., the Company's General Manager of Operations. Mr. Pelletier is a qualified person as defined by National Instrument 43-101, and has reviewed and approved this news release.
The exploration programs on the Company's various mineral properties, including Taylor, are under the supervision of Doug Cater, P. Geo, the Company's VP of Exploration. Mr. Cater is a qualified person as defined by NI 43-101, and has reviewed and approved this news release.
About SAS
SAS (operating as "SAS Goldmines"), is a gold mining and exploration company with an extensive land package in the Timmins mining district, north-eastern Ontario, which lies within the Abitibi greenstone belt, the most important host of historical gold production in Canada.
SAS owns and operates the Holt and Holloway mines. The Company is also advancing the Taylor Project and is conducting various exploration programs across 120km of land straddling the Porcupine-Destor Fault Zone.
FORWARD-LOOKING INFORMATION
This news release contains forward-looking information Information Form available on SEDAR at www.sedar.com.
SOURCE St Andrew Goldfields Ltd.
about St Andrew Goldfields Ltd., please contact: Tel: 1-800-463-5139 or (416) 815-9855; Fax: (416) 815-9437;
Website:
http://www.sasgoldmines.com
Keyvan Salehi, P. Eng., MBA, Senior Director, Corporate Development and Technical Services, ksalehi@sasgoldmines.com; Duncan Middlemiss, P. Eng., President & CEO, dmiddlemiss@sasgoldmines.com; Ben Au, CFO, VP Finance & Administration, bau@sasgoldmines.comCopyright CNW Group 2015
God Bless
great moves on all miners! In spite of what the "experts" said, Gold did not go to 1000 Dollar and below :) nice moves
Anybody here? Gold and STADF have broken out.
CLGRF has hugely broken out, 4,000,000 shares Friday and another 10% gain today.
4.02 g/t Au over 37.3 metres including 7.64 g/t Au over 11.3 metres 21.37 g/t Au over 21.7 metres (18.71 g/t Au cut)
TORONTO, Jan. 14, 2015 /CNW/ - St Andrew Goldfields Ltd.(STADF) (OTCQX-STADF), ("SAS" or the "Company") is pleased to provide a year-end exploration update which includes assay results from both its deep surface drill and 1055m Sublevel underground programs which targeted Zone 4 and South Zone ("Zone 4") mineralization at its 100% owned Holt Mine ("Holt").
Highlights of Drilling Results
WE14-002 5.09 g/t Au over 18.0 metres including 8.25 g/t Au over 7.8 metres
ME 98-05C 4.02 g/t Au over 37.3 metres including 7.64 g/t Au over 11.3 metres
(wedge)
1055-155 21.37 g/t Au over 21.7 metres (18.71 g/t Au cut)
(underground)
1055-159 20.78 g/t Au over 10.9 metres (16.89 g/t Au cut)
(underground)
Notes: True widths for the underground holes are approximately 60% of core length. Surface drillhole core intercepts are reported as core length as true widths are not known at this time. Assays are cut to 25.00 g/t Au.
"These recent drill results immediately to the west of the Holt Mine are very significant.", said Duncan Middlemiss, President and Chief Executive Officer of SAS. "Not only do they provide the potential to increase the Holt Mine resources, but the proximity of these mineralized intercepts to the existing underground infrastructure at Holt bodes very well for the longevity of the Holt asset. We are very excited about the potential of this new zone and look forward to providing further updates of the drilling program throughout 2015."
In mid-2014, SAS commenced a deep surface drilling program to test for multiple flat-lying, en-echelon mineralized zones and ultimately targeting mineralization associated with the westerly strike projection of Zone 4 (the most significant production horizon being mined at Holt).
Refer to Figure 1.
In October 2014, SAS accelerated its surface drill program using a total of four (4) drills, and commissioned an underground drill on the 1055m Sublevel, to follow up on a surface hole WE14-001, which had intercepted Zone 4 and returned assay results of 9.97 g/t Au over 11.2 metres (9.28 g/t Au cut) commencing at a downhole depth of 1,199 metres, including 19.45 g/t Au (17.77 g/t Au cut) over 4.6 metres (refer to SAS press release dated October 9, 2014 available under the Company's profile on SEDAR at www.sedar.com or on the SAS website at www.sasgoldmines.com). The mineralized intercept which occurred at the 1050m elevation, was associated with a flat-lying, shallow dipping zone situated approximately 200 metres north of the Ghostmount Fault Zone, a major structural feature in the area.
Up to December 31, 2014, a total of 19 surface holes and associated wedge cuts totaling approximately 15,100 metres and 11 underground holes totaling 1,450 metres, were completed. Surface drilling also extended and wedged off of two historical holes, one drilled in 1998, and the other in 2012. Hole ME98-05, which stopped short of Zone 4 mineralization, was wedged above (ME98-05B) and returned assays of 6.71 g/t Au over 5.7 metres. A subsequent wedge, ME98-05C intercepted the same zone approximately 40 metres north of ME98-05B, returned 4.02 g/t Au over 37.3 metres including 7.64 g/t Au over 11.3 metres. Wedge cuts were also obtained on surface hole Z4-12-002 which yielded additional assay intercepts on the Zone 4 extension which returned 3.77 g/t Au over 14.3 metres including 5.95 g/t Au over 4.3 metres and 7.95 g/t Au over 2.6 metres. A diagram showing the positions of the drill holes is found in Figure 2 (below).
The mineralized zones (which are readily recognizable in core) consist of a quartz breccia zone containing approximately 3-5% disseminated pyrite hosted within a sericitic and hematite altered mafic volcanic host rock.
These drill intercepts have extended the known mineralized strike length of Zone 4 by approximately 800 meters west of the 1075m Level drift ( the closest development access point) and some 600 metres west of SAS's historical surface drilling. Assay results from these drill programs will be compiled and used in the generation of an updated Mineral Resource estimate for the Zone 4 west extension. Recent drill results from the 1055m Sublevel which were fanned out to the west and within the resource envelope are expected to upgrade a previously Inferred Resource to an Indicated Resource. Drilling on this target continues with numerous samples outstanding at the assay laboratory at this time.
Zone 4 mineralization consists of multiple, en-echelon shallow dipping zones (20° South) which are situated between the McKenna Fault to the north and the Ghostmount Fault Zone to the south. This recent drill program has tested only the southern section of the corridor to date. In 2015, a total of 3 widely spaced holes are planned to follow-up and test for Zone 4 mineralization associated with the McKenna Fault zone (North side of the corridor).
Refer to Figure 2 for an isometric view of Zone 4 surface and underground drill intercepts.
Table 1: Holt Zone 4 surface drill program assay results
In November 2014, an underground drill was mobilized to the west end of the 1055m Sublevel. A series of holes were fanned to the west to intercept the Zone 4 target above the level. Noteworthy intercepts were returned in holes 1055-155 which included 21.37 g/t Au over 21.7 metres (18.71 g/t Au cut) and in hole 1055-159 which returned 20.78 g/t Au over 10.9 metres (16.89 g/t Au cut). Recent 1055m Sublevel underground drill program assay results for Zone 4 are summarized in the table 2 below.
Today Gold Stocks Breakout+STADF 11% Too
gold 1235, but NUGT new hi (sector) The stocks are leading gold and USD is declining.
So Far perfect. STADF a standout with 11% gain, ANV 25% CLGRF about 6%
St Andrew Goldfields Ltd. (SAS)
Market: CDN Consolidated
$0.31 Jan 9, 2015, 9:49 PM EST
Change: + 0.04 UP +14.81% 
Trade SAS Now
Volume: 360,919
Day Low
0.27 Day High
0.31
52 W+eek Low
0.205
52 Week High
0.42
http://web.tmxmoney.com/quote.php?qm_symbol=SAS
http://web.tmxmoney.com/article.php?newsid=72702571&qm_symbol=SAS
http://investorshub.advfn.com/boards/read_msg.aspx?message_id=109748651
http://www.sasgoldmines.com/s/Home.asp
http://investorshub.advfn.com/boards/read_msg.aspx?message_id=109792090

God Bless
Happy 2015 - St. Andrews Goldfields - Presentation -
http://www.sasgoldmines.com/i/pdf/Presentation-nov-2014.pdf
http://www.sasgoldmines.com/i/pdf/FactSheet.pdf
http://www.sasgoldmines.com

http://www.kitconet.com/images/live/au0001wb.gif
God Bless
ST. Andrew Goldfield (SAS)
0.27 ? 0.0 (0.00%)
Volume: 198,000 @ 3:02:27 PM ET
Bid Ask Day's Range
0.27 0.275 0.265 - 0.28
TSX:SAS Detailed Quote Wiki
ST. Andrew Goldfield (SAS) -
http://web.tmxmoney.com/quote.php?qm_symbol=SAS
http://web.tmxmoney.com/article.php?newsid=71615159&qm_symbol=SAS
God Bless
STADF has been ticking up, CLGRF record production today
Trading Symbols: TSX: CRJ; OTCQB: CLGRF
Highlights:
Record annual gold production of 62,984 ounces, a 44% increase from 2013
Annual mill head grade of 7.32 grams per tonne, a 43% increase from 2013
Santoy Gap development completed ahead of schedule and long-hole mining initiated in Q3 2014
Year-end cash and cash equivalents position of approximately $11.2 million
Total debt reduction of $10.6 million during 2014
2015 gold production guidance of 60,000 to 65,000 ounces
SASKATOON, Jan. 8, 2015 /CNW/ - Claude Resources Inc.(CLGRF) ("Claude" and or the "Company") today reported record annual gold production of 62,984 ounces for 2014, an increase of 44% year over year. In 2014, the Seabee Gold Operation milled 279,597 tonnes at a grade of 7.32 grams per tonne with an average mill recovery of 95.7 percent. The 44% increase in gold production was driven by a 43% increase in grade as mill throughput remained consistent. Gold sales grew 40% in 2014 to approximately 62,700 ounces at an average gold price of approximately CDN $1,395 per ounce.
During the fourth quarter, the Company milled 60,551 tonnes at a grade of 6.50 grams per tonne for total gold production of 12,284 ounces. While fourth quarter 2014 gold production was down slightly from the comparable period in 2013, gold sales for the same period were up 26% to approximately 16,600 ounces at an average price of CDN $1,367 per ounce.
Brian Skanderbeg, President and CEO, stated, "Our success in 2014 is the result of discovering two new ore bodies and developing strategies to grow production and more importantly margins. Our record breaking performance is a reflection of the successful implementation of the Alimak long-hole mining method at the L62 deposit and the ramp up of mining at Santoy Gap ahead of schedule. These strategies allowed us to displace lower grade Santoy 8 ore, increase head grades and improve margins. While we set new records in production, we also established new records in safety performance, a testament to the quality of our workforce. Our success in 2014 has materially improved the Company's liquidity, driving debt reduction of $10.6 million and an increased cash position of $11.2 million."
"2014 was a pivotal year for Claude. The Company successfully underwent management and board changes, managed a challenging gold price environment and was able to deliver the best operating performance in its history."
Seabee Gold Operation Production Highlights
Q4
2014
Q4
2013
Change
2014
2013
Change
Tonnes milled
60,551
74,458
(19%)
279,597
280,054
-
Head grade (grams per tonne)
6.50
5.61
16%
7.32
5.11
43%
Recovery (%)
96.4
95.8
1%
95.7
95.3
-
Gold produced (ounces)
12,284
12,789
(4%)
62,984
43,850
44%
Gold poured (ounces)
13,202
13,283
(1%)
62,697
44,991
39%
Gold sold (ounces)
16,600
13,209
26%
62,700
44,823
40%
2015 Outlook
At the Seabee Gold Operation in 2015, the Company plans to produce between 60,000 and 65,000 ounces of gold. Production will be sourced primarily from the Santoy Gap and L62 deposits. The majority of tonnes and ounces in the 2015 business plan are expected to come from the Santoy Gap deposit as it ramps up to 500 tonnes per day. Operating costs in 2015 are expected to be slightly lower than 2014 with unit cash costs to range from CDN $750 to $810 per ounce and all in sustaining costs to range from CDN $1,175 to $1,275 per ounce.
"Our outlook for 2015 demonstrates our focus on cost containment, improving margins and sustaining a production profile of over 60,000 ounces per year," added Skanderbeg. "We begin 2015 in a strong financial position and with a business plan that will generate profit at and below current gold prices."
Further operating and financial results will be announced in March of 2015.
ST. Andrew Goldfield (SAS)
0.275 ? 0.015 (5.77%)
Volume: 229,000 @ 3:44:48 PM ET
Bid Ask Day's Range
0.275 0.28 0.255 - 0.275
TSX:SAS Detailed Quote Wiki
ST. Andrew Goldfield (SAS) -
http://web.tmxmoney.com/article.php?newsid=71615159&qm_symbol=SAS
gOD bLESS
ST. Andrew Goldfield (SAS) -
http://web.tmxmoney.com/article.php?newsid=71615159&qm_symbol=SAS
God Bless
SAS reports 2014 third quarter results and lowers its 2014 production cost estimates
Date : 11/12/2014 @ 4:30PM
Source : PR Newswire (Canada)
Stock : ST. Andrew Goldfields Ltd. (SAS)
Quote : 0.26 0.0 (0.00%) @ 2:59PM
SAS reports 2014 third quarter results and lowers its 2014 production cost estimates
Print
Alert
ST Andrew Goldfields (TSX:SAS)
Intraday Stock Chart
Today : Wednesday 12 November 2014
Click Here for more ST Andrew Goldfields Charts.
All dollar amounts are stated in Canadian dollars, unless otherwise indicated
TORONTO, Nov. 12, 2014 /CNW/ - St Andrew Goldfields Ltd. (T-SAS) (OTCQX-STADF), ("SAS" or the "Company") reports net loss attributable to shareholders of $7.5 million, or $0.02 per share for Q3 2014. Included in this result is a one-time non-cash after-tax impairment loss on the Aquarius Project of $9.8 million or $0.03 per share and other one-time adjustments of $0.7 million (nil, on a per share basis). Excluding these items would result in adjusted net earnings (1) of $1.6 million, or nil, on a per share basis. For Q3 2013, net loss attributable to shareholders and adjusted net loss were $0.6 million and $0.9 million, respectively (both nil, on a per share basis).
SAS generated operating cash flow of $8.4 million, or $0.02 per share (1) in Q3 2014, a slight decline of $0.5 million from Q3 2013 despite a 17% decline in production, due to the depletion of reserves at the Hislop open pit. Gold production of 21,166 ounces in Q3 2014 exceeded the Company's expectation, as mining operations at Holloway continue and are expected to carry on well into 2015.
All-in sustaining cost per ounce of gold sold (1) was US$1,060 per ounce for Q3 2014, a 2% improvement over Q3 2013 with a total cash cost per ounce of gold sold (1) in the quarter of US$858 per ounce (including royalty costs of US$116 per ounce). Mine cash costs for Q3 2014 and YTD 2014 of US$742 and US$748 per ounce of gold sold, respectively, were below guidance of US$800 - US$850 per ounce. The Company is revising its mine cash cost guidance to between US$750 - US$800 per ounce for 2014.
The Company generated net cash flow (1) of $1.4 million in Q3 2014, after a $4.9 million investment in Taylor for the quarter. The Taylor exploration program is on schedule to extract a 21,000 tonne bulk sample in Q4 2014. Results from the underground drill program at the property to-date targeting the 1004 lens, have been positive.
"We had a better than expected quarter as mining at Holloway continued and is expected to continue well into 2015", said Duncan Middlemiss, President & CEO of SAS. "Our operating mines continue to generate positive cash flows; and we are very excited with the exploration success at the Zone 4 Extension program at Holt. Though preliminary at this stage, the discovery of gold mineralization along the trend between Zone 4 and the Tousignant Zone could potentially be significant in adding to the resource base at Holt and upgrading the value of this asset. We currently have 4 surface rigs at site to accelerate this drilling campaign. We will report on the results of this drill program in due course."
Q3 2014 Highlights
Produced 21,166 ounces of gold from three
operations (Holt, Holloway and Hislop). YTD 2014 production of 68,033 ounces. Production remains
on track to meet the 2014 guidance of between 85,000 and
95,000 ounces.
Sold 21,728 ounces of gold at an average
realized price of US$1,275 per ounce of gold
sold (1) for revenues of $30.4 million. Gold sales revenue decreased by $5.9 million when compared
to Q3 2013 due to a US$54 per ounce or 4% decline in gold
price realized during the quarter, in conjunction with a 18%
decrease in sales volume.
Mine cash costs of US$742 per ounce and a
royalty cost of US$116 per ounce, for a total
cash cost per ounce of gold sold (1) of
US$858 per ounce. Mine cash costs increased by US$22 per ounce over Q3 2013
due primarily to a 17% decrease in production as reserves at
the Hislop open pit were depleted. Mine cash costs for the
quarter and YTD 2014 were well below the Company's
guidance of US$800-US$850 per ounce for FY 2014. The
Company is revising this guidance to between US$750 -
US$800 per ounce for FY 2014.
All-in sustaining costs (1) of US$1,060 per
ounce of gold sold. A decrease of US$26 per ounce when compared to Q3 2013.
Earned cash margin from mine operations (1)
of $10.1 million and operating cash flow of
$8.4 million or $0.02 per share (1). Net cash flow (1) of $1.4 million including amounts received
from toll milling activities during the quarter.
Toll milled 34,981 tonnes of custom ore and
earned revenue of $1.2 million. Revenue from toll milling of $1.2 million or US$52 per ounce
of gold sold for the quarter reduced the overall processing
cost to $21 per tonne milled.
Invested $4.9 million at Taylor to advance the
underground exploration Program. The exploration program is on schedule to extract a 21,000- tonne
bulk sample in Q4 2014. Results of definition drilling to-date
continues to be positive.
Q3 2014 Conference Call Information
The Company invites you to participate in the upcoming conference call to discuss its third quarter financial and operating results for 2014. The conference call will take place on Thursday November 13, 2014 at 10:00am EST.
Participants may join the call via webcast at www.sasgoldmines.com or call in toll free at 1-866-212-4491. A playback of the conference call will be available via the website and will be posted within 24 hours of the call. For more information regarding the Q3 2014 conference call, please visit the SAS website.
Operating and Financial Summary
Amounts in thousands of Canadian dollars, except per share
and per unit amounts Q3 2014 Q3 2013 YTD 2014 YTD 2013
SAS Operating Results
Gold production (ounces) 21,166 25,434 68,033 75,248
Commercial gold production sold (ounces) 21,728 26,600 68,078 74,669
Per ounce data (US$)
Average realized price (1) $ 1,275 $ 1,329 $ 1,285 $ 1,455
Mine cash costs $ 742 $ 720 $ 748 $ 763
Royalty costs 116 112 114 124
Total cash cost (1) (2) $ 858 $ 832 $ 862 $ 887
Cash margin (1) $ 417 $ 497 $ 423 $ 568
All-in sustaining cost (1) $ 1,060 $ 1,086 $ 1,083 $ 1,194
SAS Financial Results
Gold sales and total revenue (2) $ 30,430 $ 36,363 $ 95,576 $ 111,276
Cash margin from mine operations (1) $ 10,125 $ 13,381 $ 31,348 $ 43,505
Net income (loss) $ (7,495) $ (599) $ (8,748) $ (653)
Adjusted net earnings (loss) (1) $ 1,635 $ (880) $ (414) $ (685)
Operating cash flow $ 8,355 $ 8,880 $ 23,284 $ 29,628
Net cash flow (1) $ 1,412 $ 2,953 $ 246 $ 6,397
Per share information:
Basic and diluted income (loss) $ (0.02) $ 0.00 $ (0.02) $ 0.00
Adjusted net earnings (loss) (1) $ 0.00 $ 0.00 $ 0.00 $ 0.00
Operating cash flow (1) $ 0.02 $ 0.02 $ 0.06 $ 0.08
SAS Financial Position September 30,
2014 December 31,
2013
Cash and cash equivalents $ 21,176 $ 33,690
Working capital $ 10,133 $ 13,846
Total assets $ 190,543 $ 211,070
Total non-current financial liabilities $ 1,701 $ 3,295
(1) These measures are non-GAAP measures which do not have standardized meanings prescribed by IFRS and are not necessarily
comparable to similarly titled measures of other companies. Please refer to pages 9 - 14 of this news release for an explanation
and reconciliation of these non-GAAP measures.
(2) Excluded from gold sales and total revenue for Q3 2014 and YTD 2014 was revenue from toll milling of $1.2 million and $1.5 million,
respectively. This revenue was deducted from the mining cash costs.
Financial Performance
Revenues in Q3 2014 declined by $5.9 million when compared to Q3 2013 due to a 17% decrease in production as mine operations at Hislop ceased in Q2 2014; and a 4% decline in realized gold price. The decline in revenue was offset partially by $1.2 million earned on toll milling operations and a $1.4 million decrease in mine site operating costs and production royalty and led to a $3.3 million decrease in cash margin from mine operations (1). Despite a stronger US dollar relative to the Canadian dollar, total cash cost per ounce of gold sold (1) in Q3 2014 of US$858 per ounce, increased by US$26 per ounce from Q3 2013 primarily due to the increased use of cemented back-fill at Holt in 2014.
Holt Mine, Operations and Financial Review (see "Operating and Financial Statistics" on page 16)
During Q3 2014, the Holt Mine ("Holt") produced 15,087 ounces of gold, which is a 10% decrease from Q3 2013. Throughput decreased by 3% due to lower available shifts, as a result of the road closure due to flooding in the summer and the change in mine shaft conveyances in the quarter which resulted in a 10% decrease in production. Ore grades achieved for the quarter were 8% lower compared to Q3 2013 mainly because of higher production from lower grade areas. The ore grade achieved in the quarter remains above the reserve grade of 4.74 g/t Au for the mine.
Mine site costs in Q3 2014 increased by $18 per tonne of ore milled (1) from Q3 2013, substantially due to increased cemented backfill required for 2014 in the primary stopes. The increase in operating costs, offset by a stronger US dollar relative to the Canadian dollar, led to a US$107 per ounce increase in total cash cost per ounce of gold sold (1). In conjunction with a 4% decline in revenue due to the decrease in sales volume and realized price, cash margin from mine operations (1) for Q3 2014 decreased by 23% when compared to Q3 2013.
In Q3 2014, Holt contributed 88% of SAS' total cash margin from mine operations (1).
Holt is expected to contribute approximately 70% of the Company's total gold production for 2014.
Holloway Mine, Operations and Financial Review (see "Operating and Financial Statistics" on page 17)
Gold production at the Holloway Mine ("Holloway") increased by 29% in Q3 2014 when compared to Q3 2013, due to a 19% increase in throughput and a 6% improvement in ore grade. The increase of throughput in the quarter (despite the summer road closure) was due to higher productivities and additional ore discovered on the 945m Sublevel. Mill recoveries during the quarter were in line with expectations at approximately 92%.
When compared to Q3 2013, mine site costs for the quarter decreased by 9% to $119 per tonne of ore milled (1) (all development costs at the mine are charged to operations). Total cash cost per ounce of gold sold (1) during the quarter decreased by nearly 4% when compared to Q3 2013.
Holloway is expected to contribute approximately 25% of the Company's total gold production for 2014.
Hislop Mine, Operations and Financial Review (see "Operating and Financial Statistics" on page 18)
The open pit ore reserve for the Hislop Open Pit ("Hislop") was fully depleted in Q2 2014. In Q3 2014, the Company processed the remaining ore stockpile.
Taylor Project Update ("Taylor")
Ramp development continued throughout Q3 2014. The main ramp development totalling 1,410 metres is now completed, and the Company is preparing to extract the 21,000 tonne bulk sample from the 1004 lens as planned during Q4 2014. A total of 601 metres of lateral development and 44 metres of vertical development were completed during Q3 2014. The underground exploration program remains on schedule and results to date have been positive.
SAS recently completed fifty-three (53) drill holes collared from drill bays in the ramp development on the 220m, 250m and 305m Sublevel elevations, totaling 8,400 metres. Drilling targeted the easterly strike extension of the 1004 and 1006 lens resource blocks, situated within the West Porphyry Zone ("WPZ"), in the vicinity of the second proposed bulk sample. The results (released on September 11, 2014 and available under the Company's profile on www.sedar.com or on the Company's website at www.sasgoldmines.com) have provided additional information, which has been utilized to increase the Company's understanding of both the geological and structural setting in the east end of the 1004 lens and to confirm the tenor and orientation of the mineralization.
Exploration Projects
Exploration activities continued to follow up on targets throughout Q3 2014.
On October 9, 2014, SAS reported assay results for the first hole of the Holt Zone 4 Extension program, which commenced in June 2014. The objective of this surface drill program is to test for multiple flat-lying, en-echelon mineralized zones and ultimately targeting mineralization associated with the westerly strike projection of Zone 4 at Holt, which is the most significant production horizon at the mine. The mineralized intercept which occurred at the 1050m elevation, is associated with a shallow dipping zone situated approximately 200 metres north of the Ghostmount Fault zone, a major structural feature in the area. An examination of the core angles suggests that the true width of the mineralized zone is very close to the core length. Given the significant nature of the assay results returned to date from this program, SAS has added 3 drills to the program to accelerate the drilling of the Zone 4 extension. (please see the news release of October 9, 2014 which is available under the Company's profile on www.sedar.com or on the Company's website at www.sasgoldmines.com).
At Hislop North, surface drilling continued to test the southerly strike extension of the 147 Zone from the Primero Gold's property onto SAS ground. On September 11, 2014, SAS announced drill results which effectively traced the 147 Zone mineralization approximately 130 metres onto SAS property and to a depth of 500m below surface. (please see the news release of September 11, 2014 which is available under the Company's profile on www.sedar.com or on the Company's website at www.sasgoldmines.com). Surface drilling continued along the northern Hislop property boundary, aimed at following-up on the southerly strike extension of the 147 Zone.
A total of 9,900 metres of surface core drilling and 9,000 metres of underground exploration drilling were completed during Q3 2014. Year-to-date drilling consisted of 23,000 metres of surface core drilling and 26,200 metres of underground exploration drilling on the Company's targets. The 2014 field season saw SAS concentrate on geochemical sampling, trenching and mapping exercises on the SAS owned mineral claims situated in Cook and Guibord townships.
Capital Resources
Working capital as at September 30, 2014, was $10.1 million compared to a working capital of $13.8 million as at December 31, 2013. The decrease was primarily due to the classification of $2.0 million of asset retirement obligation as a current liability. At the end of Q3 2014, the Company had cash and cash equivalents of $21.2 million and access to additional cash by way of an undrawn US$10.0 million revolving credit facility from a chartered bank.
SAS expects to incur approximately $4.5 million in capital expenditures at the two underground mines and the Holt Mill during Q4 2014. The Company also plans to invest $3.7 million at Taylor in Q4 2014 to complete the bulk sample program. This investment is before proceeds of gold poured from processing the bulk sample. These capital programs will be financed by the Company's capital resources and anticipated operating cash flows.
Qualified Person
Mine development and production at the Holt, Holloway and Hislop mines, processing at the Holt Mill, and mine development activities at Taylor are being conducted under the supervision of Marc-Andre Pelletier, P.Eng, the Company's General Manager of Mine Operations.
Exploration activities on the Company's mineral properties, including the drilling program at Taylor, are under the supervision of Mr. Doug Cater, P. Geo, the Company's Vice-President of Exploration.
Messrs. Pelletier and Cater are qualified persons as defined by National Instrument 43-101, and have reviewed and approved this news release.
About SAS
SAS is a gold mining and exploration company with an extensive land package in the Timmins mining district, northeastern Ontario, which lies within the Abitibi greenstone belt, the most important host of historical gold production in Canada.
SAS owns and operates the Holt, Holloway and Hislop mines and produced approximately 100,000 ounces of gold in 2013. The Company is also advancing the Taylor Project and is conducting aggressive exploration across 120km of land straddling the Porcupine-Destor Fault Zone.
Non-GAAP Measures
The Company has included the following non-GAAP performance measures: adjusted net earnings (loss); total cash cost per ounce of gold sold; all-in sustaining cost per ounce of gold sold; mine site cost per tonne milled; cash margin from mine operations; average realized price per ounce of gold sold; cash margin per ounce of gold sold; net cash flow; and operating cash flow per share; throughout this news release, which do not have standardized meanings prescribed by International Financial Reporting Standards ("IFRS") and are not necessarily comparable to other similarly titled measures of other companies due to potential inconsistencies in the method of calculation. The Company believes that, in addition to conventional measures prepared in accordance with IFRS, the Company and certain investors use this information to evaluate the Company's performance. Refer to pages 10-15 of this news release for a discussion and the reconciliation of these non-GAAP measurements to the Company's Unaudited Condensed Interim Financial Statements for Q3 2014.
The Unaudited Balance Sheets, Statements of Operations and Statements of Cash Flows for the Company for the three months and the nine months ended September 30, 2014, can be found on pages 21-23.
To review the complete Unaudited Condensed Financial Statements for Q3 2014, and the Interim Management's Discussion and Analysis for Q3 2014, please see SAS's SEDAR filings under the Company's profile at www.sedar.com or the Company's website at www.sasgoldmines.com.
The following abbreviations are used to describe the periods under review throughout this release.
Abbreviation Period Abbreviation Period
Q1 2014 January 1, 2014 - March 31, 2014 Q1 2013 January 1, 2013 - March 31, 2013
Q2 2014 April 1, 2014 - June 30, 2014 Q2 2013 April 1, 2013 - June 30, 2013
Q3 2014 July 1, 2014 - September 30, 2014 Q3 2013 July 1, 2013 - September 30, 2013
YTD 2014 January 1, 2014 - September 30, 2014 YTD 2013 January 1, 2013 - September 30, 2013
Q4 2014 October 1, 2014 - December 31, 2014 Q4 2013 October 1, 2013 - December 31, 2013
FY 2014 January 1, 2014 - December 31, 2014 FY 2013 January 1, 2013 - December 31, 2013
Q4 2012 October 1, 2012 - December 31, 2012
FORWARD-LOOKING INFORMATION
This news release contains forward-looking information and forward-looking statements (collectively, "forward-looking information") under applicable securities laws, concerning the Company's business, operations, financial performance, condition and prospects, as well as management's objectives, strategies, beliefs and intentions. Forward-looking information is frequently identified by such words as "may", "will", "plan", "expect", "estimate", "anticipate", "believe", "intend" and similar words referring to future events and results, including the Company's production and cash cost guidance for 2014; continued mining operation at Holloway; the relative production contributions from each of the operations; the level of capital expenditures at Holt, Holloway, the Holt Mill and Taylor; the continuation of advanced exploration at Taylor including the completion of a second bulk sample; and the continuance of the exploration program at Holt. In addition, mineral resources and mineral reserves constitute forward-looking information as they involve the assessment, based on certain estimates and assumptions, that such mineral resources and mineral reserves can be profitably produced in the future.
This forward-looking information is subject to known and unknown risks, uncertainties and other factors that may cause actual results to differ materially from those expressed or implied by the forward-looking information. Factors that may cause actual results to vary materially include, but are not limited to, uncertainties relating to the interpretation of the geology, continuity, grade and size estimates of the mineral reserves and resources; unanticipated operational or technical difficulties which could escalate operating and/or capital costs and reduce anticipated production levels; the Company's dependence on key employees and changes in the availability of qualified personnel; fluctuations in gold prices and exchange rates; insufficient funding or delays or inability to raise additional financing on satisfactory terms if required; operational hazards and risks, including the inability to insure against all risks; changes in laws, regulations and the risks of obtaining necessary licenses and permits; changes in general economic conditions and changes in conditions in the financial markets. Such forward looking information is based on a number of assumptions, including but not limited to the level and volatility of the price of gold, the accuracy of reserve and resource estimates and the assumptions on which such estimates are based, the ability to achieve capital and operating cost estimates, the ability of the Company to retain and attract qualified personnel, the sufficiency of the Company's cash reserves and operating cash flow to complete planned development and exploration activities, the availability of additional financing on acceptable terms if and as required and the level of stability of general business and economic conditions. Should one or more risks and uncertainties materialize or should any assumptions prove incorrect, then actual results could vary materially from those expressed or implied in the forward-looking information and accordingly, readers are cautioned not to place undue reliance on this forward-looking information. SAS does not assume the obligation to revise or update this forward-looking information after the date of this release or to revise such information to reflect the occurrence of future unanticipated events, except as may be required under applicable securities laws. A description of these risks and uncertainties can also be found in the Company's Annual Information Form obtained on SEDAR at www.sedar.com.
NON-GAAP MEASURES
Adjusted net earnings (loss)
Adjusted net earnings (loss) is a non-GAAP performance measure which does not constitute a measure recognized by IFRS and does not have a standardized meaning defined by IFRS. As well, it may not be comparable to information in other gold producers' reports and filings. Adjusted net earnings (loss) is calculated by removing the gains and losses, resulting from the mark-to-market revaluation of the Company's gold-linked liabilities and foreign currency derivative contracts, one-time gains or losses on the disposition of non-core assets, periodic adjustments to the Company's asset retirement obligations, and expenses, asset impairment gains or losses and significant tax adjustments not related to current period's earnings, as detailed in the table below. The Company discloses this measure, which is based on its Financial Statements, to assist in the understanding of the Company's operating results and financial position.
Amounts in thousands of Canadian dollars, except per share
amounts Q3 2014 Q3 2013 Q2 2014 YTD 2014 YTD 2013
Net income (loss) per Financial Statements $ (7,495) $ (599) $ 553 $ (8,748) $ (653)
Reversal of unrecognized deferred income tax assets - - - - (1,256)
Mark-to-market loss (gain) on gold-linked liabilities (116) 709 (56) 284 (1,002)
Mark-to-market loss (gain) on foreign currency derivatives 280 (1,084) (1,128) (603) 974
Impairment loss on available-for-sale investments - - - - 500
Loss (gain) on disposal of fixed assets (4) - 149 145 -
Impairment loss (1) 13,110 - - 13,110 -
Write-down of investment in joint venture - - - - 374
Write-down of mining equipment - - - - 620
One-time accrual adjustment (1,095) - - (1,095) -
Reversal of provision - - - (777) -
Tax effect of above items (3,045) 94 296 (2,730) (242)
Adjusted net earnings (loss) $ 1,635 $ (880) $ (186) $ (414) $ (685)
Weighted average number of shares outstanding (000s)
Basic 368,296 368,293 368,296 368,296 368,261
Diluted 368,296 368,293 368,337 368,296 368,261
Adjusted net earnings (loss) per share - basic and diluted $ 0.00 $ 0.00 $ 0.00 $ 0.00 $ 0.00
(1) After tax impairment loss for the three month and nine month period ended September 30, 2014 was $9.8 million or $0.03 per
share (tax effect - $3.3 million)
Total cash cost per ounce of gold sold
Total cash cost per ounce of gold sold is a non-GAAP performance measure which does not constitute a measure recognized by IFRS and does not have a standardized meaning defined by IFRS. As well, it may not be comparable to information in other gold producers' reports and filings. The Company has included this non-GAAP performance measure throughout this document as the Company believes that this generally accepted industry performance measure provides a useful indication of the Company's operational performance. The Company believes that, in addition to conventional measures prepared in accordance with IFRS, certain investors use this information to evaluate the Company's performance and ability to generate cash flow. Accordingly, it is intended to provide additional information and should not be considered in isolation or as a substitute for measures of performance prepared in accordance with IFRS. The following table provides a reconciliation of total cash costs per ounce of gold sold to production expenses per the Financial Statements:
Amounts in thousands of Canadian dollars, except where
indicated Q3 2014 Q3 2013 Q2 2014 YTD 2014 YTD 2013
Mine site operating costs per Financial Statements (1) $ 17,570 $ 19,876 $ 18,959 $ 55,718 $ 58,283
Production royalties per Financial Statements 2,735 3,106 2,758 8,510 9,488
Total cash costs $ 20,305 $ 22,982 $ 21,717 $ 64,228 $ 67,771
Divided by gold ounces sold 21,728 26,600 22,850 68,078 74,669
Total cash cost per ounce of gold sold (Canadian dollars) $ 935 $ 864 $ 950 $ 943 $ 908
Average 1 USD ? CAD exchange rate $ 1.09 $ 1.04 $ 1.09 $ 1.09 $ 1.02
Total cash cost per ounce of gold sold (US$) $ 858 $ 832 $ 872 $ 862 $ 887
(1) Included in mine site operating costs was revenue from toll milling of $1.2 million and $1.5 million earned in Q3 2014 and
YTD 2014, respectively (Q3 2013 and YTD 2013 -nil).
All-in sustaining cost per ounce of gold sold
All-in sustaining cost per ounce of gold sold is a non-GAAP performance measure and does not constitute a measure recognized by IFRS and does not have a standardized meaning defined by IFRS. As well, it may not be comparable to information in other gold producers' reports and filings. The Company has included this non-GAAP performance measure throughout this document as the Company believes that this generally accepted industry performance measure provides a useful indication of the Company's operational performance. All-in sustaining costs include mine-site operating costs and production royalties incurred at the Company's mining operations, sustaining capital expenditures (which the Company defines as any capital expenditures that are reinvested into the business to maintain the current level of operations), corporate administration expense, mine site exploration costs, and reclamation cost accretion. The Company believes that this measure represents the total costs of producing gold from current operations, and provides the Company and other stakeholders with additional information that illustrates the Company's operational performance and ability to generate cash flow. This cost measure is reported on a consolidated level and on a per-ounce of gold sold basis in accordance with the guidelines published by the World Gold Council. As the measure seeks to reflect the full cost of gold production from current operations, new project capital is not included. Certain other cash expenditures, including tax payments and financing costs are also not included.
Amounts in thousands of Canadian dollars, except where
indicated Q3 2014 Q3 2013 Q2 2014 YTD 2014 YTD 2013
Mine site operating costs per Financial Statements (1) $ 17,570 $ 19,876 $ 18,959 $ 55,718 $ 58,283
Production royalties per Financial Statements 2,735 3,106 2,758 8,510 9,488
Add (less):
Sustaining mine capital 3,243 3,781 3,921 11,514 12,532
Mine site exploration 289 1,630 207 722 5,165
Mine reclamation obligation 28 99 104 236 297
Corporate administration 1,210 1,492 1,402 3,974 5,445
All-in sustaining costs $ 25,075 $ 29,983 $ 27,351 $ 80,674 $ 91,210
Divided by gold ounces sold 21,728 26,600 22,850 68,078 74,669
All-in sustaining cost per ounce of gold sold (Canadian dollars) $ 1,154 $ 1,127 $ 1,197 $ 1,185 $ 1,222
Average 1 USD ? CAD exchange rate $ 1.09 $ 1.04 $ 1.09 $ 1.09 $ 1.02
All-in sustaining cost per ounce of gold sold (US$) $ 1,060 $ 1,086 $ 1,098 $ 1,083 $ 1,194
(1) Included in mine site operating costs was revenue from toll milling of $1.2 million and $1.5 million earned in Q3 2014 and YTD
2014, respectively (Q3 2013 and YTD 2013 -nil).
Mine site cost per tonne milled
Mine site cost per tonne milled is a non-GAAP performance measure and does not constitute a measure recognized by IFRS and does not have a standardized meaning defined by IFRS. As well, it may not be comparable to information in other gold producers' reports and filings. As illustrated in the table below, this measure is calculated by adjusting Production Costs, as shown in the statements of operations, for inventory level changes and then dividing by tonnes processed through the mill. Since total cash cost per ounce of gold sold data can be affected by fluctuations in foreign currency exchange rates, Management believes that mine site cost per tonne milled provides additional information regarding the performance of mining operations and allows Management to monitor operating costs on a more consistent basis as the per tonne milled measure reduces the cost variability associated with varying production levels. Management also uses this measure to determine the economic viability of mining blocks. As each mining block is evaluated based on the net realizable value of each tonne mined, the estimated revenue on a per tonne basis must be in excess of the mine site cost per tonne milled in order to be economically viable. Management is aware that this per tonne milled measure is impacted by fluctuations in throughput and thus uses this evaluation tool in conjunction with production costs prepared in accordance with IFRS. This measure supplements production cost information prepared in accordance with IFRS and allows investors to distinguish between changes in production costs resulting from changes in production versus changes in operating performance.
Amounts in thousands of Canadian dollars, except per tonne
amounts Q3 2014 Q3 2013 Q2 2014 YTD 2014 YTD 2013
Holt Mine
Mine site costs per Financial Statements $ 11,223 $ 9,310 $ 10,915 $ 32,442 $ 27,144
Inventory adjustments (1) (265) 89 354 689 685
Mine site operating costs $ 10,958 $ 9,399 $ 11,269 $ 33,131 $ 27,829
Divided by tonnes of ore milled 101,826 104,800 106,282 321,387 287,866
Mine site cost per tonne milled $ 108 $ 90 $ 106 $ 103 $ 97
Holloway Mine
Mine site costs per Financial Statements $ 5,335 $ 5,593 $ 5,506 $ 17,021 $ 15,667
Inventory adjustments (1) 340 (326) (441) 273 147
Mine site operating costs $ 5,675 $ 5,267 $ 5,065 $ 17,294 $ 15,814
Divided by tonnes of ore milled 47,651 40,152 40,932 131,565 129,046
Mine site cost per tonne milled $ 119 $ 131 $ 124 $ 131 $ 123
Hislop Mine
Mine site costs per Financial Statements $ 1,012 $ 4,973 $ 2,538 $ 6,255 $ 15,472
Inventory adjustments (1) (837) (487) (49) (830) (50)
Mine site operating costs $ 175 $ 4,486 $ 2,489 $ 5,425 $ 15,422
Divided by tonnes of ore milled 1,747 66,940 47,785 81,530 234,804
Mine site cost per tonne milled $ 100 $ 67 $ 52 $ 67 $ 66
Mine site costs per Financial Statements
Holt $ 11,223 $ 9,310 $ 10,915 $ 32,442 $ 27,144
Holloway 5,335 5,593 5,506 17,021 15,667
Hislop 1,012 4,973 2,538 6,255 15,472
$ 17,570 $ 19,876 $ 18,959 $ 55,718 $ 58,283
(1) Inventory adjustment reflects production costs associated with unsold bullion and in-circuit inventory.
(2) Included in mine site operating costs was revenue from toll milling of $1.2 million and $1.5 million earned in Q3 2014 and YTD
2014, respectively (Q3 2013 and YTD 2013 - nil).
Cash margin from mine operations
Cash margin from mine operations is a non-GAAP measure and does not constitute a measure recognized by IFRS and does not have a standardized meaning defined by IFRS. As well, it may not be comparable to information in other gold producers' reports and filings. It is calculated as the difference between gold sales and production costs (comprised of mine site operating costs and production royalties) per the Company's Financial Statements. The Company believes it illustrates the performance of the Company's operating mines and enables investors to better understand the Company's performance in comparison to other gold producers who present results on a similar basis.
Amounts in thousands of Canadian dollars Q3 2014 Q3 2013 Q2 2014 YTD 2014 YTD 2013
Gold sales per Financial Statements [A] $ 30,430 $ 36,363 $ 31,665 $ 95,576 $ 111,276
Mine site operating costs per Financial Statements (1) 17,570 19,876 18,959 55,718 58,283
Production royalties per Financial Statements 2,735 3,106 2,758 8,510 9,488
[B] 20,305 22,982 21,717 64,228 67,771
Cash margin from mine operations [A] - [B] $ 10,125 $ 13,381 $ 9,948 $ 31,348 $ 43,505
Breakdown of cash margin from mine operations by mines:
Holt Mine $ 8,191 $ 10,677 $ 8,407 $ 27,419 $ 31,905
Holloway Mine 1,606 1,561 1,083 3,278 5,747
Hislop Mine 328 1,143 458 651 5,853
$ 10,125 $ 13,381 $ 9,948 $ 31,348 $ 43,505
(1) Included in mine site operating costs was revenue from toll milling of $1.2 million and $1.5 million earned in Q3 2014 and YTD 2014,
respectively (Q3 2013 and YTD 2013 -nil).
Average realized price per ounce of gold sold
Average realized price per ounce of gold sold is a non-GAAP measure and does not constitute a measure recognized by IFRS and does not have a standardized meaning defined by IFRS. Average realized price per ounce of gold sold is calculated by dividing gold sales proceeds received by the Company for the relevant period by the ounces of gold sold. It may not be comparable to information in other gold producers' reports and filings.
Amounts in thousands of Canadian dollars, except where indicated Q3 2014 Q3 2013 Q2 2014 YTD 2014 YTD 2013
Gold sales per Financial Statements $ 30,430 $ 36,363 $ 31,665 $ 95,576 $ 111,276
Foreign exchange gain realized on the settlement of gold sales (250) 47 192 (846) (497)
Gain (loss) on foreign currency derivative cash flow hedges realized 13 235 158 400 406
$ 30,193 $ 36,645 $ 32,015 $ 95,130 $ 111,185
Average 1 USD ? CAD exchange rate 1.09 1.04 1.09 1.09 1.02
Gold sales recorded in US$ $ 27,714 $ 35,346 $ 29,353 $ 87,473 $ 108,676
Divided by gold ounces sold 21,728 26,600 22,850 68,078 74,669
Average realized price per ounce of gold sold (US$) $ 1,275 $ 1,329 $ 1,285 $ 1,285 $ 1,455
Cash margin per ounce of gold sold
Cash margin per ounce of gold sold is a non-GAAP measure and does not constitute a measure recognized by IFRS and does not have a standardized meaning defined by IFRS. Cash margin per ounce of gold sold is calculated by subtracting the total cash cost per ounce of gold sold from the average realized price per ounce of gold sold. It may not be comparable to information in other gold producers' reports and filings.
Amounts in United States dollars Q3 2014 Q3 2013 Q2 2014 YTD 2014 YTD 2013
Per ounce of gold sold:
Average realized price per ounce of gold sold [A] $ 1,275 $ 1,329 $ 1,285 $ 1,285 $ 1,455
Total cash cost per ounce of gold sold [B] 858 832 872 862 887
Cash margin per ounce of gold sold [A] - [B] $ 417 $ 497 $ 413 $ 423 $ 568
Net cash flow
Net cash flow is a non-GAAP measure and does not constitute a measure recognized by IFRS and does not have a standardized meaning defined by IFRS. Net cash flow is calculated by taking cash flow from operating activities less cash used in investing activities as reported in the Company's Financial Statements. It may not be comparable to information in other gold producers' reports and filings.
Amounts in thousands of Canadian dollars Q3 2014 Q3 2013 Q2 2014 YTD 2014 YTD 2013
Cash flow from operating activities per Financial Statements $ 8,355 $ 8,880 $ 5,461 $ 23,284 $ 29,628
Less:
Cash used in investing activities per Financial Statements 6,943 5,927 8,108 23,038 23,231
$ 1,412 $ 2,953 $ (2,647) $ 246 $ 6,397
Operating cash flow per share
Operating cash flow per share is a non-GAAP measure and does not constitute a measure recognized by IFRS and does not have a standardized meaning defined by IFRS. Operating cash flow per share is calculated by dividing cash flow from operating activities in the Company's Financial Statements by the weighted average number of shares outstanding for each period. It may not be comparable to information in other gold producers' reports and filings.
Amounts in thousands of Canadian dollars, except per share
amounts Q3 2014 Q3 2013 Q2 2014 YTD 2014 YTD 2013
Cash flow from operating activities per Financial Statements $ 8,355 $ 8,880 $ 5,461 $ 23,284 $ 29,628
Weighted average number of shares outstanding (000s) 368,296 368,293 368,296 368,296 368,261
Operating cash flow per share $ 0.02 $ 0.02 $ 0.01 $ 0.06 $ 0.08
Operating and Financial Statistics - Holt Mine
Amounts in thousands of Canadian dollars,
except per unit amounts Q3 2014 Q3 2013 Q2 2014 YTD 2014 YTD 2013
Tonnes milled 101,826 104,800 106,282 321,387 287,866
Head grade (g/t Au) 4.82 5.25 4.70 4.87 5.16
Average mill recovery 95.5% 95.0% 94.2% 94.7% 94.9%
Gold produced (ounces) 15,087 16,807 15,140 47,724 45,319
Commercial gold production sold (ounces) 15,400 16,381 15,534 47,450 44,326
Gold sales revenue $ 21,572 $ 22,417 $ 21,521 $ 66,634 $ 66,032
Cash margin from mine operations (1) $ 8,191 $ 10,677 $ 8,407 $ 27,419 $ 31,905
Mine site cost per tonne milled (1) $ 108 $ 90 $ 106 $ 103 $ 97
Total cash cost per ounce of gold sold (US dollars) (1)
Mine cash costs * $ 669 $ 548 $ 644 $ 625 $ 598
Royalty costs 129 143 130 130 154
Total cash cost per ounce of gold sold $ 798 $ 691 $ 774 $ 755 $ 752
Capital expenditures $ 2,699 $ 3,104 $ 3,608 $ 10,379 $ 9,974
Depreciation and depletion expense $ 3,299 $ 2,338 $ 2,749 $ 8,842 $ 7,714
* Net of toll mill revenue allocated to each of SAS's mine operations
(1) Total cash cost per ounce of gold sold, mine site cost per tonne milled and cash margin from mine operations are
non-GAAP measures which do not have standardized meanings as prescribed by IFRS and are not necessarily
comparable to similarly titled measures of other companies due to potential inconsistencies in the method of
calculation (see pages 10-14 for an explanation and reconciliation of non-GAAP measurements).
Operating and Financial Statistics - Holloway Mine
Amounts in thousands of Canadian dollars,
except per unit amounts Q3 2014 Q3 2013 Q2 2014 YTD 2014 YTD 2013
Tonnes milled 47,651 40,152 40,932 131,565 129,046
Head grade (g/t Au) 4.27 4.02 4.09 4.17 4.13
Average mill recovery 91.8% 89.7% 90.9% 91.0% 91.4%
Gold produced (ounces) 5,999 4,662 4,893 16,046 15,676
Commercial gold production sold (ounces) 5,356 5,741 5,157 15,688 16,042
Gold sales revenue $ 7,518 $ 7,831 $ 7,149 $ 22,035 $ 23,920
Cash margin from mine operations (1) $ 1,606 $ 1,561 $ 1,083 $ 3,278 $ 5,747
Mine site cost per tonne milled (1) $ 119 $ 131 $ 124 $ 131 $ 123
Total cash cost per ounce of gold sold (US dollars)(1)
Mine cash costs * $ 915 $ 938 $ 979 $ 991 $ 953
Royalty costs 99 114 100 101 154
Total cash cost per ounce of gold sold $ 1,014 $ 1,052 $ 1,079 $ 1,092 $ 1,107
Capital expenditures $ 290 $ 816 $ 270 $ 810 $ 2,917
Depreciation and depletion expense $ 625 $ 4,843 $ 3,266 $ 11,216 $ 9,136
* Net of toll mill revenue allocated to each of SAS's mine operations
(1) Total cash cost per ounce of gold sold, mine site cost per tonne milled and cash margin from mine operations, are
non-GAAP measures which do not have standardized meanings as prescribed by IFRS and are not necessarily
comparable to similarly titled measures of other companies due to potential inconsistencies in the method of
calculation (see pages 10-14 hereof for an explanation and reconciliation of non-GAAP measurements).
Operating and Financial Statistics - Hislop Mine
Amounts in thousands of Canadian dollars, except per
unit amounts Q3 2014 Q3 2013 Q2 2014 YTD 2014 YTD 2013
Overburden stripped (m3) - 43,094 - - 107,091
Tonnes mined (ore) - 92,378 28,851 79,971 280,639
(waste) - 389,978 5,000 223,712 970,589
- 482,356 33,851 303,683 1,251,228
Waste-to-Ore Ratio - 4.2 0.2 2.8 3.5
Tonnes milled 1,747 66,940 47,785 81,530 234,804
Head grade (g/t Au) 1.76 2.27 2.14 2.12 2.29
Average mill recovery 81.2% 81.0% 75.1% 76.8% 82.5%
Gold produced (ounces) 80 3,965 2,472 4,263 14,253
Commercial gold production sold (ounces) 972 4,478 2,159 4,940 14,301
Gold sales revenue $ 1,340 $ 6,115 $ 2,995 $ 6,907 $ 21,324
Cash margin from mine operations (1) $ 328 $ 1,143 $ 458 $ 651 $ 5,853
Mine site cost per tonne milled (1) (3) $ 100 $ 67 $ 52 $ 67 $ 66
Total cash cost per ounce of gold sold (US Dollars)(1)(2)(3) $ 957 $ 1,070 $ 1,079 $ 1,157 $ 1,058
Capital expenditures $ - $ 20 $ - $ - $ 20
Depreciation and depletion expense $ 88 $ 2,364 $ 126 $ 289 $ 9,840
Notes:
(1) Total cash cost per ounce of gold sold, mine site cost per tonne milled and cash margin from mine operations are non-GAAP
measures which do not have standardized meanings as prescribed by IFRS and are not necessarily comparable to similarly
titled measures of other companies due to potential inconsistencies in the method of calculation (see pages 10-14 hereof for
an explanation and reconciliation of non-GAAP measurements).
(2) Hislop is subject to a 4% net smelter return royalty, which includes a minimum Advance royalty payment obligation (see
"Gold-linked Liabilities" in the Company's Q3 2014 MD&A).
(3) Net of toll milling revenue allocated to each of SAS' mine operations.
Statements of Operations (unaudited)
St Andrew Goldfields Ltd.
Expressed in thousands of Canadian dollars except per share information
Three months ended September 30, Nine months ended September 30,
2014 2013 2014 2013
Gold sales $ 30,430 $ 36,363 $ 95,576 $ 111,276
Operating costs and expenses:
Mine site operating 17,570 19,876 55,718 58,283
Production royalty 2,735 3,106 8,510 9,488
Site maintenance 21 13 29 173
Exploration 1,380 1,932 3,808 7,042
Corporate administration 1,210 1,492 3,974 5,445
Depreciation and depletion 4,243 9,770 21,033 27,358
Loss (gain) on disposal of fixed assets (4) - 145 -
Impairment charges 13,110 13,110
Write-down of investment in joint venture - - - 374
Write-down of mining equipment - - - 620
40,265 36,189 106,327 108,783
Operating income (loss) (9,835) 174 (10,751) 2,493
Finance costs 253 498 1,222 1,499
Mark-to-market (gain) loss on gold-linked liabilities (116) 709 284 (1,002)
Mark-to-market (gain) loss on foreign currency derivatives 280 (1,084) (603) 974
Foreign exchange loss 44 276 1,285 591
Impairment loss on available-for-sale investments - - - 500
Finance income and other (1,147) (74) (2,087) (229)
(686) 325 101 2,333
Income (loss) before taxes (9,149) (151) (10,852) 160
Net deferred tax expense (recovery) (1,654) 448 (2,104) 813
Net income (loss) attributable to shareholders $ (7,495) $ (599) $ (8,748) $ (653)
Other comprehensive income (loss)
Unrealized gain (loss) on available-for-sale investments (nil tax
effect) 32 55 147 (76)
Reclassification adjustment for impairment loss on available-for-
sale investments (nil tax effect) - - - 500
Unrealized gain (loss) on derivatives designated as cash flow
hedges, net of tax of ($9), $371, $25 , ($175) (29) 923 75 (716)
Reclassification adjustment for unrealized loss on the
ineffective portion of cash flow hedges, net of tax $64 - 192 - 192
3 1,170 222 (100)
Comprehensive income (loss) for the period $ (7,492) $ 571 $ (8,526) $ (753)
Basic and diluted income (loss) per share $ (0.02) $ 0.00 $ (0.02) $ 0.00
Weighted average number of shares outstanding (000's)
Basic 368,296 368,293 368,296 368,261
Diluted 368,296 368,293 368,296 368,261
Statements of Cash Flows (unaudited)
St Andrew Goldfields Ltd.
Expressed in thousands of Canadian dollars
Three months ended September 30, Nine months ended September 30,
2014 2013 2014 2013
Operating activities:
Net loss for the period $ (7,495) $ (599) $ (8,748) $ (653)
Items not affecting cash:
Net deferred tax expense (recovery) (1,654) 448 (2,104) 813
Mark-to-market loss (gain) on gold-linked liabilities (116) 709 284 (1,002)
Non-cash interest 206 359 973 1,083
Mark-to-market loss (gain) on foreign currency derivatives 280 (1,084) (603) 974
Depreciation and depletion 4,243 9,770 21,033 27,358
Reversal of provision - - (777) -
Impairment loss on available-for-sale investments 13,110 13,110 -
Write-down of investment in joint venture - - - 374
Write-down of mining equipment and investment - - - 620
Impairment loss on available-for-sale investments - - - 500
Loss (gain) on disposal of fixed assets (4) - 145 -
Share-based payments 82 237 272 823
Net change in non-cash operating working capital and other (273) (847) (129) (908)
Interest paid (24) (113) (172) (354)
Cash provided by operating activities 8,355 8,880 23,284 29,628
Investing activities:
Additions to exploration and evaluation assets (4,576) (1,069) (12,686) (6,231)
Mine development expenditures (1,782) (3,263) (6,392) (9,957)
Additions to plant and equipment (1,815) (1,082) (5,737) (4,719)
Amounts payable on capital additions 1,242 (496) 1,737 (1,925)
Reclamation costs and other (17) (17) (50) (376)
Proceeds on disposal of fixed assets 5 - 90 -
Cash collateralized for banking facilities - - - (23)
Cash used in investing activities (6,943) (5,927) (23,038) (23,231)
Financing activities:
Advance royalty payments - (411) (708) (1,383)
Capital lease payments (265) (186) (805) (449)
Repayment of term credit facility - (2,060) (9,815) (4,092)
Cash used in financing activities (265) (2,657) (11,328) (5,924)
Effects of exchange rate changes on cash and cash equivalents (34) (237) (1,432) 430
Increase (decrease) in cash and cash equivalents 1,113 59 (12,514) 903
Cash and cash equivalents, beginning of period 20,063 31,500 33,690 30,656
Cash and cash equivalents, end of period $ 21,176 $ 31,559 $ 21,176 $ 31,559
Balance Sheets (unaudited)
St Andrew Goldfields Ltd.
Expressed in thousands of Canadian dollars
September 30, 2014 December 31, 2013
Assets
Current assets:
Cash and cash equivalents $ 21,176 $ 33,690
Accounts receivable 2,949 951
Inventories 9,042 8,638
Prepayments and other assets 398 193
33,565 43,472
Exploration and evaluation assets 45,097 38,390
Producing properties 41,461 49,751
Plant and equipment 37,197 49,025
Reclamation deposits 8,423 8,373
Restricted cash 1,695 1,695
Deferred tax assets 22,823 20,228
Other assets 282 136
$ 190,543 $ 211,070
Liabilities and Shareholders' Equity
Current liabilities:
Accounts payable and other liabilities $ 12,185 $ 9,793
Employee-related liabilities 4,387 5,241
Royalties payable 1,208 956
Provisions - 777
Derivative liabilities 403 1,105
Current portion of long-term debt 3,242 11,754
Current portion of asset retirement obligations 2,007 -
23,432 29,626
Long-term debt 1,701 3,295
Asset retirement obligations 6,830 12,023
Deferred tax liabilities 2,846 2,330
34,809 47,274
Shareholders' equity:
Share capital 98,575 98,575
Contributed surplus 20,844 20,317
Stock options 4,204 4,267
Retained earnings 32,030 40,778
Accumulated other comprehensive loss 81 (141)
155,734 163,796
$ 190,543 $ 211,070
SOURCE St Andrew Goldfields Ltd.
Copyright 2014 Canada NewsWire
St. Andrews Goldfields Presentation -
http://www.sasgoldmines.com/i/pdf/Presentation.pdf
http://www.sasgoldmines.com/s/NewsDetails.asp?id=122581
SAS reports significant exploration results from the Holt property -

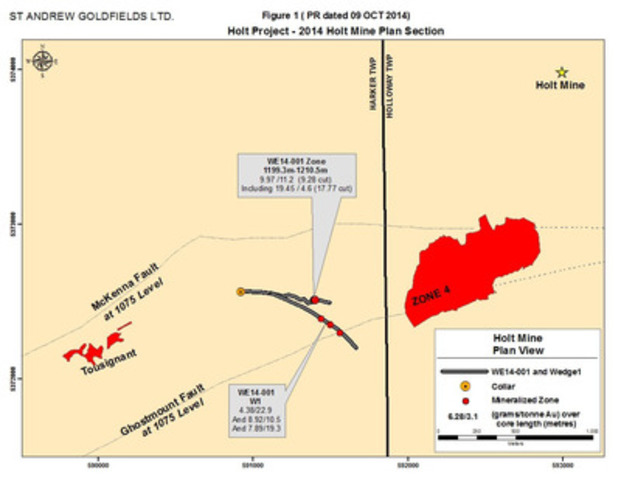
9.97 g/t Au over 11.2 metres (9.28 g/t Au cut) including 19.45 g/t Au over 4.6 metres (17.77 g/t Au cut)
TORONTO, Oct. 9, 2014 /CNW/ - St Andrew Goldfields Ltd. (TSX-SAS) (OTCQX-STADF), ("SAS" or the "Company") is pleased to announce initial assay results from its deep surface drill program conducted on the Zone 4 and South Zone ("Zone 4") target at the Holt Mine ("Holt").
HIGHLIGHTS OF HOLT DRILLING RESULTS
- WE14-001
9.97 g/t Au (9.28 g/t Au cut) over 11.2 metres including 19.45 g/t Au over 4.6 metres (17.77 g/t Au cut)
- WE14-001
4.38 g/t Au over 22.9 metres, 8.92g/t Au over 10.5 metres and 7.89 g/t Au
W1 (wedge)
over 19.3 metres (3 distinct zones of mineralization)
Note: All lengths are reported as core length as true width is not available at this time. Assays are cut to 32.00 g/t Au.
"These recent results targeting the Zone 4 mineralization are potentially the most significant discovery SAS has generated on the Holt property. The mineral potential remains open in all directions and the original intercept is 600 metres west of 1075m level drift (nearest mine opening) and 440 metres west of historical surface diamond drill intercepts. The location is approximately mid-way between Zone 4 and the Tousignant Zone, which is located 3 km west of the Holt shaft. We have added two additional drills to this program with results expected by year end", remarked Duncan Middlemiss President and Chief Executive Officer of SAS. "Currently Holt has a very robust mine life with approximately 470,000 ounces of Au in reserves (3.10M t @ 4.74 g/t Au) at the beginning of the year and over 735,000 ounces of Au in the Measured (3.63M t @ 3.85 g/t Au) and Indicated (2.15M t @ 4.21 g/t Au) resource categories, and these recent results may add significantly to the resource base at Holt, provided the ongoing drill program's results continue as anticipated. It is with great anticipation we embark on an accelerated phase of this program."
Zone 4 Surface Drilling Program
In June 2014, SAS commenced a deep surface drilling program to test for multiple flat-lying, en-echelon mineralized zones and ultimately targeting mineralization associated with the westerly strike projection of Zone 4 (the most significant production horizon being mined by SAS at Holt).
The first hole of the program, hole WE14-001 intercepted Zone 4 and returned assay results of 9.97 g/t Au over 11.2 metres (9.28 g/t Au cut) commencing at a downhole depth of 1,199.3 metres, including 19.45 g/t Au (17.77 g/t Au cut) over 4.6 metres. The mineralized intercept which occurred at the 1050m elevation, is associated with a shallow dipping flat zone situated approximately 200 metres north of the Ghostmount Fault zone, a major structural feature in the area. An examination of the core angles suggests that the true width of the mineralized zone is very close to the core length.
Upon receipt of the assay results, SAS commissioned a wedge cut commencing at a downhole depth of 600 metres from the master hole. Hole WE14-001-W1 intercepted two mineralized zones which returned assay results of 4.38 g/t Au over 22.9 metres and 8.92 g/t Au over 10.5 metres. This intercept is located approximately 170 metres south of the initial assay intercept. The wedge cut was extended to allow the hole to intercept the Ghostmount Fault zone. A third mineralized zone was also intersected which returned 7.89 g/t Au over 19.3 metres.
These intersections are postulated to be the westerly strike extension of the Zone 4 and South Zone mineralization. Multiple mineralized zones were intercepted in the master hole (refer to the assay result table below). The mineralized zone consists of a quartz breccia zone, containing approximately 3-5% disseminated pyrite, hosted within an altered mafic volcanic. Numerous specks of visible gold were observed in the core. Although visible gold is not common in most of the Holt style of mineralization, it was noted regularly in the higher grade areas of the South Zone, the previous mining zone while the mine was operated by Barrick Gold Corporation.
These drill intercepts have potentially extended the known mineralized strike length of Zone 4 by approximately 600 meters west of the 1075m Level drift (the closest development access point) and approximately 440 metres west of SAS's historical surface drilling. Successful results from this drill program have initiated the immediate mobilization of 2 additional drills in order to accelerate this program; with the objective of defining the limits of Zone 4 mineralization.
Refer to Figure 1 for a plan view of Zone 4 surface drill intercepts and Figure 2 a Longitudinal section of the Holt Mine – showing the location of recent drill intercepts relative to the underground workings.
Recent deep surface drill program results for Zone 4 are summarized in the table below:
http://web.tmxmoney.com/article.php?newsid=70788597&qm_symbol=SAS
Holt Exploration 2014
COLLARS - UTM NAD 83
Core
BHID
Easting
Northing
Elevation
Azimuth
Dip
From (m)
To (m)
Length(m)
Au_GPT
Cut grade ( 32 g/t Au)
and Comments
WE14-001
590945
5372565
300
90
-73
909.10
909.90
0.80
4.63
917.60
918.20
0.60
12.34
935.10
936.00
0.90
1.17
1181.00
1182.00
1.00
3.50
1195.30
1196.00
0.70
3.94
1196.80
1197.50
0.70
2.88
1199.30
1210.50
11.2
9.97
9.28 g/t Cut - Zone 4 Extension
including
1200.30
1204.90
4.6
19.45
17.77 g/t Au cut
WE14-
001- W1
Wedge
cut
1302.00
1324.90
22.9
4.38
Zone 4 Upper
including
1320.00
1324.90
4.9
10.18
and
1351.50
1362.0
10.5
8.92
Zone 4 Lower
and
1449.80
1469.1
19.3
7.89
Note: All lengths are reported as core length as true width is not available at this time. Assays are cut to 32.00 g/t Au.
Drilling, Assaying and QA/QC
Surface drilling at Zone 4 was performed by Orbit Garant Drilling based in Val d'Or QC. Analytical work was performed by Lab Expert located in Rouyn Noranda, QC. Samples consisted of half sawn NQ caliber core. Gold analysis was conducted using 30 gram samples (1AT portions) with gold grades determined by standard fire assay preparation and a gravimetric finish. SAS employs an industry accepted QA/QC program, consisting of certified reference standards and blanks that are inserted into the sample stream, which represent approximately 5% of the total sample population.
Qualified Person
The exploration programs on the Company's various mineral properties are under the supervision of Doug Cater, P. Geo, the Company's Vice-President, Exploration. Mr. Cater is a qualified person as defined by NI 43-101, and has reviewed and approved this news release.
About SAS
SAS (operating as "SAS Goldmines"), is a gold mining and exploration company with an extensive land package in the Timmins mining district, north-eastern Ontario, which lies within the Abitibi greenstone belt, the most important host of historical gold production in Canada.
SAS owns and operates the Holt, Holloway and Hislop mines which contribute approximately 100,000 ounces of annual gold production. The Company is also advancing exploration at Taylor; and is conducting an aggressive exploration program across 120km of land straddling the PDFZ.
Duncan Middlemiss
President & CEO
dmiddlemiss@sasgoldmines.com
Ben Au
CFO, VP Finance & Administration
bau@sasgoldmines.com
SOURCE St Andrew Goldfields Ltd.

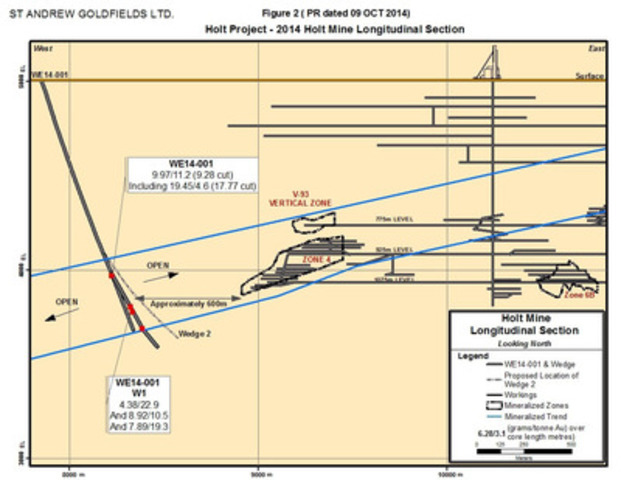
Photo_Asset_2
Image with caption: "Figure 1 (PR dated 09 OCT 2014) Holt Project - 2014 Holt Mine Plan Section (CNW Group/St Andrew Goldfields Ltd.)". Image available at: http://photos.newswire.ca/images/download/20141009_C3035_PHOTO_EN_6524.jpg
Image with caption: "Figure 2 (PR dated 09 OCT 2014) Holt Project - 2014 Holt Mine Longitudinal Section (CNW Group/St Andrew Goldfields Ltd.)". Image available at: http://photos.newswire.ca/images/download/20141009_C3035_PHOTO_EN_6525.jpg
http://web.tmxmoney.com/article.php?newsid=70788597&qm_symbol=SAS
SAS reports Q3 2014 production of 21,166 ounces of gold and provides notice of earnings release and conference call
http://ih.advfn.com/p.php?pid=nmona&article=63966427
God Bless
Tel: 1-800-463-5139 or (416) 815-9855; Fax: (416) 815-9437; Website: www.sasgoldmines.comCopyright CNW Group 2014
SAS reports significant exploration results from the Holt property -
9.97 g/t Au over 11.2 metres (9.28 g/t Au cut) including 19.45 g/t Au over 4.6 metres (17.77 g/t Au cut)
TORONTO, Oct. 9, 2014 /CNW/ - St Andrew Goldfields Ltd. (TSX-SAS) (OTCQX-STADF), ("SAS" or the "Company") is pleased to announce initial assay results from its deep surface drill program conducted on the Zone 4 and South Zone ("Zone 4") target at the Holt Mine ("Holt").
HIGHLIGHTS OF HOLT DRILLING RESULTS
- WE14-001
9.97 g/t Au (9.28 g/t Au cut) over 11.2 metres including 19.45 g/t Au over 4.6 metres (17.77 g/t Au cut)
- WE14-001
4.38 g/t Au over 22.9 metres, 8.92g/t Au over 10.5 metres and 7.89 g/t Au
W1 (wedge)
over 19.3 metres (3 distinct zones of mineralization)
Note: All lengths are reported as core length as true width is not available at this time. Assays are cut to 32.00 g/t Au.
"These recent results targeting the Zone 4 mineralization are potentially the most significant discovery SAS has generated on the Holt property. The mineral potential remains open in all directions and the original intercept is 600 metres west of 1075m level drift (nearest mine opening) and 440 metres west of historical surface diamond drill intercepts. The location is approximately mid-way between Zone 4 and the Tousignant Zone, which is located 3 km west of the Holt shaft. We have added two additional drills to this program with results expected by year end", remarked Duncan Middlemiss President and Chief Executive Officer of SAS. "Currently Holt has a very robust mine life with approximately 470,000 ounces of Au in reserves (3.10M t @ 4.74 g/t Au) at the beginning of the year and over 735,000 ounces of Au in the Measured (3.63M t @ 3.85 g/t Au) and Indicated (2.15M t @ 4.21 g/t Au) resource categories, and these recent results may add significantly to the resource base at Holt, provided the ongoing drill program's results continue as anticipated. It is with great anticipation we embark on an accelerated phase of this program."
Zone 4 Surface Drilling Program
In June 2014, SAS commenced a deep surface drilling program to test for multiple flat-lying, en-echelon mineralized zones and ultimately targeting mineralization associated with the westerly strike projection of Zone 4 (the most significant production horizon being mined by SAS at Holt).
The first hole of the program, hole WE14-001 intercepted Zone 4 and returned assay results of 9.97 g/t Au over 11.2 metres (9.28 g/t Au cut) commencing at a downhole depth of 1,199.3 metres, including 19.45 g/t Au (17.77 g/t Au cut) over 4.6 metres. The mineralized intercept which occurred at the 1050m elevation, is associated with a shallow dipping flat zone situated approximately 200 metres north of the Ghostmount Fault zone, a major structural feature in the area. An examination of the core angles suggests that the true width of the mineralized zone is very close to the core length.
Upon receipt of the assay results, SAS commissioned a wedge cut commencing at a downhole depth of 600 metres from the master hole. Hole WE14-001-W1 intercepted two mineralized zones which returned assay results of 4.38 g/t Au over 22.9 metres and 8.92 g/t Au over 10.5 metres. This intercept is located approximately 170 metres south of the initial assay intercept. The wedge cut was extended to allow the hole to intercept the Ghostmount Fault zone. A third mineralized zone was also intersected which returned 7.89 g/t Au over 19.3 metres.
These intersections are postulated to be the westerly strike extension of the Zone 4 and South Zone mineralization. Multiple mineralized zones were intercepted in the master hole (refer to the assay result table below). The mineralized zone consists of a quartz breccia zone, containing approximately 3-5% disseminated pyrite, hosted within an altered mafic volcanic. Numerous specks of visible gold were observed in the core. Although visible gold is not common in most of the Holt style of mineralization, it was noted regularly in the higher grade areas of the South Zone, the previous mining zone while the mine was operated by Barrick Gold Corporation.
These drill intercepts have potentially extended the known mineralized strike length of Zone 4 by approximately 600 meters west of the 1075m Level drift (the closest development access point) and approximately 440 metres west of SAS's historical surface drilling. Successful results from this drill program have initiated the immediate mobilization of 2 additional drills in order to accelerate this program; with the objective of defining the limits of Zone 4 mineralization.
Refer to Figure 1 for a plan view of Zone 4 surface drill intercepts and Figure 2 a Longitudinal section of the Holt Mine – showing the location of recent drill intercepts relative to the underground workings.
Recent deep surface drill program results for Zone 4 are summarized in the table below:
http://web.tmxmoney.com/article.php?newsid=70788597&qm_symbol=SAS
Holt Exploration 2014
COLLARS - UTM NAD 83
Core
BHID
Easting
Northing
Elevation
Azimuth
Dip
From (m)
To (m)
Length(m)
Au_GPT
Cut grade ( 32 g/t Au)
and Comments
WE14-001
590945
5372565
300
90
-73
909.10
909.90
0.80
4.63
917.60
918.20
0.60
12.34
935.10
936.00
0.90
1.17
1181.00
1182.00
1.00
3.50
1195.30
1196.00
0.70
3.94
1196.80
1197.50
0.70
2.88
1199.30
1210.50
11.2
9.97
9.28 g/t Cut - Zone 4 Extension
including
1200.30
1204.90
4.6
19.45
17.77 g/t Au cut
WE14-
001- W1
Wedge
cut
1302.00
1324.90
22.9
4.38
Zone 4 Upper
including
1320.00
1324.90
4.9
10.18
and
1351.50
1362.0
10.5
8.92
Zone 4 Lower
and
1449.80
1469.1
19.3
7.89
Note: All lengths are reported as core length as true width is not available at this time. Assays are cut to 32.00 g/t Au.
Drilling, Assaying and QA/QC
Surface drilling at Zone 4 was performed by Orbit Garant Drilling based in Val d'Or QC. Analytical work was performed by Lab Expert located in Rouyn Noranda, QC. Samples consisted of half sawn NQ caliber core. Gold analysis was conducted using 30 gram samples (1AT portions) with gold grades determined by standard fire assay preparation and a gravimetric finish. SAS employs an industry accepted QA/QC program, consisting of certified reference standards and blanks that are inserted into the sample stream, which represent approximately 5% of the total sample population.
Qualified Person
The exploration programs on the Company's various mineral properties are under the supervision of Doug Cater, P. Geo, the Company's Vice-President, Exploration. Mr. Cater is a qualified person as defined by NI 43-101, and has reviewed and approved this news release.
About SAS
SAS (operating as "SAS Goldmines"), is a gold mining and exploration company with an extensive land package in the Timmins mining district, north-eastern Ontario, which lies within the Abitibi greenstone belt, the most important host of historical gold production in Canada.
SAS owns and operates the Holt, Holloway and Hislop mines which contribute approximately 100,000 ounces of annual gold production. The Company is also advancing exploration at Taylor; and is conducting an aggressive exploration program across 120km of land straddling the PDFZ.
Duncan Middlemiss
President & CEO
dmiddlemiss@sasgoldmines.com
Ben Au
CFO, VP Finance & Administration
bau@sasgoldmines.com
SOURCE St Andrew Goldfields Ltd.
Photo_Asset_2
Image with caption: "Figure 1 (PR dated 09 OCT 2014) Holt Project - 2014 Holt Mine Plan Section (CNW Group/St Andrew Goldfields Ltd.)". Image available at: http://photos.newswire.ca/images/download/20141009_C3035_PHOTO_EN_6524.jpg
Image with caption: "Figure 2 (PR dated 09 OCT 2014) Holt Project - 2014 Holt Mine Longitudinal Section (CNW Group/St Andrew Goldfields Ltd.)". Image available at: http://photos.newswire.ca/images/download/20141009_C3035_PHOTO_EN_6525.jpg
http://web.tmxmoney.com/article.php?newsid=70788597&qm_symbol=SAS
SAS reports Q3 2014 production of 21,166 ounces of gold and provides notice of earnings release and conference call
http://ih.advfn.com/p.php?pid=nmona&article=63966427
God Bless
Tel: 1-800-463-5139 or (416) 815-9855; Fax: (416) 815-9437; Website: www.sasgoldmines.comCopyright CNW Group 2014
(Bloomberg) -- St Andrew Goldfields says it received
significant exploration results from deep surface drill program
conducted on Zone 4 and South Zone targets at Holt properties.
• Results include: 9.97 g/mt gold, over 11.2 meters
• Says potential for mineralization remains open at all directions; results may
add significantly to current resource base at Holt
• NOTE: Holt has ~668k oz of proven, probable gold reserves as of Dec. 31, 2013,
SAS reports Q3 2014 production of 21,166 ounces of gold and provides notice of earnings release and conference call
http://ih.advfn.com/p.php?pid=nmona&article=63966427
God Bless
Yes, good drill results. All they need is higher gold.
stocks doing much better than gold, as this article mentions.
http://seekingalpha.com/article/2496055-is-the-junior-miner-uptrend-forecasting-a-gold-and-silver-bottom
GOLD: Good grades from both Taylor and Hislop for SAS
2014-09-11
ONTARIO – St Andrew Goldfields (SAS) of Toronto is enjoying good grades in cores from both its Taylor and Hislop North gold projects near Matheson. The best Taylor hole assayed 12.98 g/t Au over 15.3 metres, and the best Hislop result was 10.38 g/t over 25.0 metres.
SAS completed 53 drill holes at Taylor from drilling bays in the ramp on the 220, 250, and 305 metre elevations. Work was aimed at the easterly strike extension of the 1004 and 1006 lenses, both within the West Porphyry zone in the area of a second proposed bulk sample.
The 1004 lens was also drilled from surface. The best core assayed 4.99 g/t Au over 1.0 metre, including 8.73 g/t over 0.5 metre.
Surface drilling at the Hislop North target followed up on the southerly strike extension of the 147 zone. Besides the assay mentioned above, another hole returned 3.24 g/t over 39.9 metres, and confirmed that mineralized material extends from the surface to a depth of 500 metres.Please visit SASGoldMines.com for more details.
Expert Comments on St. Andrews Goldfields
http://www.theaureport.com/pub/co/2226
The Gold Report Interview with Michael Fowler (8/25/14) "One company that I cover is St Andrew Goldfields Ltd. Primero Mining bought Brigus Gold and its Grey Fox gold deposit, which is next to St Andrew's Hislop gold mine. The whole area is crying out for consolidation. . .Primero started a process that is going to continue and St Andrew will be part of that consolidation at the end of the day. . .St Andrew is a very inexpensive junior producer that produces about 85,000 oz per year and that's not exciting the market. Some of these junior producers need to merge to reach a critical mass so that they can afford their fixed costs. There are potential synergies in the old Brigus and St Andrew because they're right next to each other. . .St Andrew is mining efficiently. It is increasing the throughput at the Holt mill, which is an extremely good asset. Its main asset is the Holt mine. Next door to it is the Holloway mine and farther down the trend is Hislop. The Holt mine produces about 85% of its profits. [St Andrew's current all-in costs] are about $1,050/oz. The company published its earnings in mid-August, and those were nil versus nil so that's nothing to jump up and down about. I'm recommending it because it's very inexpensive and I see it as part of the M&A potential of that area." More >
The Gold Report Interview with Florian Siegfried (8/20/14) "St Andrew Goldfields Ltd. has some properties in an area where there has been some recent M&A activity. Primero Mining bought Brigus Gold Corp.'s Grey Fox gold project, which is in the same geological trend as an adjacent St Andrew property. Should there be more consolidation in the Abitibi Gold Belt, St Andrew could be part of the equation. St Andrew has a big land package and a centralized mill that is currently not operating at full capacity. There are some strategic advantages around many of the St Andrew properties. The company also has a $190M tax pool. Sooner or later it will likely be part of another group in the same area." More >
Henry Lazenby, Mining Weekly (7/8/14) "St Andrew Goldfields Ltd. reported positive results from an ongoing drilling campaign at the Smoke Deep zone at the Holloway mine. Among the highlights of the campaign that started earlier this year from underground platforms, were hole 905-05 that returned 13.07 g/t of gold over 31.6m; hole 905-21 that returned 11.1 g/t of gold over 8.9m and hole 945-03, which returned 18.35 g/t of gold over 2.2m. . .the company expected to produce between 75 Koz to 85 Koz of gold this year, after recording a record 99,548 oz of gold in 2013."
The Gold Report Interview with Michael Fowler (2/26/14) "St Andrew Goldfields has a very good team. It should be able to cut its all-in sustaining costs, particularly from the Holt mine. I'm optimistic that St Andrew can cut costs and also generate free cash flow. Maybe not by much, but its balance sheet is strong enough to sustain this present situation. It also has a very good debt deal with Scotia Bank. Its interest rate is somewhere in the region of 4%. That gives you an indication of what the bank thinks of St Andrew. It doesn't think that this company is a particularly big risk. It should give equity investors some encouragement.
St Andrew has a good development project called Taylor. It's very high grade. St Andrew has done some bulk samples from the deposit, got some good recoveries and got some cash out of it. It's going to be another incremental piece in its growth profile. It won't come this year. It will probably come in 2015. The company is going to have to keep an eye on its balance sheet and make sure that it doesn't overextend itself. St Andrew is a prime acquisition target, too. Brigus Gold Corp. is next door. Brigus is being acquired by Primero Mining Corp. I wouldn't be surprised if Primero starts looking again after taking over Brigus." More >
Christos Doulis, Stonecap Securities (10/11/13) "St Andrew Goldfields Ltd. offers investors good leverage to gold in a safe political jurisdiction and should be able to survive and generate modest free cash flow in the current (~$1,300/oz) gold price environment. . .the company has posted another quarter of production over 25 Koz and with production in the first nine months of 75,248 oz Au, remains on track to break the 100 Koz/year barrier. We are maintaining our Outperform rating and $0.50 price target."
August 21, 2014, 5:05 p.m. ET
.
(MKTW) Sage Gold Amends Purchase Agreement With St Andrew Goldfields Ltd. on Clavos Property
http://online.wsj.com/article/PR-CO-20140821-912022.html#
.
Sage Gold Amends Purchase Agreement With St Andrew Goldfields Ltd. on Clavos Property
TORONTO, ONTARIO--(Marketwired - Aug 21, 2014) - Sage Gold Inc. (TSX VENTURE:SGX) ("Sage" or "the Company") and St Andrew Goldfields Ltd. (TSX:SAS) ("SAS") have amended the purchase agreement ("the Agreement") dated December 3, 2013 and subsequently amended April 29, 2014, by extending the closing date from August 29, 2014 to December 31, 2014.
Under the Agreement, SAS agreed to sell and Sage agreed to purchase the remaining 40% interest in the Clavos gold property for $1.0 million in cash together with a 2% Net Smelter Return Royalty ("Royalty"). This Agreement is subject to certain conditions, including financing, and on closing Sage will own 100% of the gold property in Timmins, Ontario.
About Sage
Sage is a mineral exploration and development company which has primary interests in near-term production and exploration properties in Ontario. Its main properties are the Clavos Gold property in Timmins and the Lynx property and other exploration properties in the Beardmore-Geraldton Gold Camp. Technical reports and information relating to the properties can be obtained from the System for Electronic Document Analysis and Retrieval (SEDAR) website at www.sedar.com and www.sagegoldinc.com.
This release was prepared by management of the Company who takes full responsibility for its contents. Neither TSX Venture Exchange nor its Regulation Services Provider (as that term is defined in the policies of the TSX Venture Exchange) accepts responsibility for the adequacy or accuracy of this release.
This news release contains certain "Forward-Looking Statements" within the meaning of Section 21E of the United States Securities Exchange Act of 1934, as amended and "Forward Looking Information" within the meaning of applicable Canadian securities legislation. Some forward looking statements and forward looking information contained in this release are forward-looking and, therefore, involve uncertainties or risks that could cause actual results to differ materially. Such forward-looking statements include comments regarding mining and milling operations, mineral resource statements and exploration program performance. Factors that could cause actual results to differ materially include metal price volatility, economic and political events affecting metal supply and demand, fluctuations in mineralization grade, geological, technical, mining or processing problems, exploration programs and future results of exploration programs, future profitability and production.
Sage Gold Inc.
Nigel Lees
President and CEO
416-204-3170
416-260-2243
www.sagegoldinc.com
SAS reports solid 2014 second quarter results and raises production guidance.
TORONTO , Aug. 13, 2014 /CNW/ - St Andrew Goldfields Ltd. (T-SAS) (OTCQX-STADF), ("SAS" or the "Company") reports net income attributable to shareholders for Q2 2014 of $0.6 million , or nil on a per share basis, compared to a net loss of $1.1 million , or nil per share, for Q2 2013. For Q2 2014, adjusted net loss (1) was $0.2 million , or nil, on a per share basis, compared to adjusted net loss of $0.9 million , or nil per share, for Q2 2013.
Click here for the rest.
ST. ANDREW GOLDFIELDS (TSX:SAS) Map To Fair Market Price
& Higher Highs SAS Share Prices -
Holding the certificate insures your DEED ownership of that stock
They do not need to "confiscate",
You are a creditor of the bank.
The money you put in the bank or the stock is not yours
after it enters the door of the bank.
The bank just gives you an IOU
Small creditors are the first to loose when things go south. Remember banks never loose.
Holding the certificate insures your ownership of that
stock and not the banks.
You DON"T own those shares in a street name.
Your brokerage does and they can do anything they want with them.
You only have computer entry with them, that's it.
Many things can happen
if you are day to day trader and if you buy and sell
many times per day, it is convinient tool,
but if you are long...
ex....
rallard, if I understand you correctly, you're saying that if I deposit shares in a bank
they do not have to pay me back the shares?
They simply give me an "IOU", which they have no obligation to honor?
And if the bank goes bankrupt, their creditors have no obligation
to honor the share agreements in the accounts that hold the shares?
Is that what you're trying to say?
"Remember banks never loose"
They would seem to if they were bankrupt and unable
to pay back creditors.
baranja, you say, "Many things can happen".
Could you describe a scenario in which you would
no longer be able to do
what you wish with those shares held by a bank
for your convenience?
thanks
Even worse, if the financial institution that has control
of your shares,
they can short your company..........
But that's the price we pay for instant liquidity -
take a deed certificate possession of your SAS shares ownership -
it takes a bit more time & money to buy & sell..........
but the bankers don't own it and can't short it........
you own it and it be rightfully yours........
good for all longer term holders..............
Not all financial institutions are equal
Insolvent bank....
MF Gloal scenario,
how about Maddoff,
Great depression colapse,....
Or just simply.. "here is cash, ..no shares for you,
sorry about inconvenience.."..
Can this happen,.. maybe.. who knows.
Holding the certificate insures your ownership DEED of that
stock and not the banks - and the banks can NOT use
your shares for short selling -
get your share certificate DEED of corporation ownership -
if you want HIGHER SHARE PRICE and
become a SAS Long TEAM member -
Thanks in advance -
http://investorshub.advfn.com/boards/read_msg.aspx?message_id=104219631
http://www.sasgoldmines.com/s/Home.asp
God Bless
good news indeed
SAS @ $1.45/sh produced way less than @ the current Gold production - SAS fair road to Higher Highs next -
http://investorshub.advfn.com/boards/read_msg.aspx?message_id=104219631
NYbob, Your Chart, Article Why Extreme Inflation is possible.
I checked out your chart on Monetary Base, scary, like Germany in 1920s. The article below has same chart as yours, and a video by Griffen, backs up what you are saying.
http://aun-tv.com/why-some-think-extreme-inflation-is-possible-for-usa-monetary-base-exploding/
God Bless
SAS reports Q2 2014 production results of 22,505 ounces of gold and
provides notice of earnings release and conference call -

NEWS RELEASES Jul 10, 2014 -
http://www.sasgoldmines.com/s/NewsDetails.asp?id=122577
13.07 g/t Au over 31.6m (7.43 g/t Au Cut); and 11.10 g/t Au over 8.9m (10.72 g/t Au Cut) Drilling Returns:
http://www.sasgoldmines.com/s/NewsDetails.asp?id=122576
The Company is highly leveraged to gold, has attractive Gold Mines projects -
exploration properties to drive future growth -
operates in the world’s greatest gold camp Timmins, Ontario.
http://www.sasgoldmines.com/s/Home.asp

http://investorshub.advfn.com/boards/read_msg.aspx?message_id=104125418
God Bless
13.07 g/t Au over 31.6m (7.43 g/t Au Cut); and 11.10 g/t Au over 8.9m (10.72 g/t Au Cut) Drilling Returns:
http://www.sasgoldmines.com/s/NewsDetails.asp?id=122576

http://www.sasgoldmines.com/s/AdvancedProjects.asp
http://www.sasgoldmines.com/i/pdf/Presentation-AGM-13May14.pdf
The Company is highly leveraged to gold, has attractive Gold Mines projects -
exploration properties to drive future growth -
operates in the world’s greatest gold camp Timmins, Ontario.
http://www.sasgoldmines.com/s/Home.asp
God Bless
Exploration Update for the Smoke Deep Zone at the Holloway Mine
Date : 07/08/2014 @ 8:00AM
Source : PR Newswire (Canada)
Stock : ST. Andrew Goldfields Ltd. (SAS)
Quote : 0.36 0.0 (0.00%) @ 2:09PM
SAS Provides an Exploration Update for the Smoke Deep Zone at the Holloway Mine
Print
Alert
ST Andrew Goldfields (TSX:SAS)
Intraday Stock Chart
Today : Tuesday 8 July 2014
Click Here for more ST Andrew Goldfields Charts.
Drilling Returns: 13.07 g/t Au over 31.6m (7.43 g/t Au Cut); and 11.10 g/t Au over 8.9m (10.72 g/t Au Cut)
TORONTO, July 8, 2014 /CNW/ - St Andrew Goldfields Ltd. (TSX-SAS) (OTCQX-STADF), ("SAS" or the "Company") is pleased to announce additional drilling results for the Smoke Deep Zone ("Smoke Deep") at the Holloway Mine.
HIGHLIGHTS OF DRILLING RESULTS (Refer to Figure 1 for a longitudinal section of Smoke Deep drilling)
• 905-05: 13.07 g/t Au (7.43 g/t cut) over 31.6 metres
• 905-21: 11.10 g/t Au (10.72 g/t cut) over 8.9 metres
8.75 g/t Au (7.79 g/t cut) over 6.3 metres, including 18.97 g/t Au
• 945-01: (16.07 g/t Au cut) over 2.0 metres
• 945-03: 18.35 g/t Au over 2.2 metres
Notes: All lengths reported at Smoke Deep are reported as core length as true width is not available at this time. Assays are cut to 25.00 g/t Au.
"These recent Smoke Deep results are positive and encouraging", said Duncan Middlemiss, President & CEO of SAS. "As the reserve base is limited, the down dip extension of Smoke Deep is significant and could potentially extend the mine life at Holloway."
Smoke Deep
Underground drilling at Smoke Deep commenced earlier this year from underground drill platforms (situated on the 865m Level, 905m Level, 925m Level and most recently the 945m Level), to test for the mineralized extensions of the zone further to the east, west and down dip. The drill program has been successful and drilling continues to extend the Smoke Deep deposit along strike to the east. This drilling has effectively extended the known mineralized strike length of the deposit by approximately 200 meters to the east for a total strike length of 500 metres.
In July 2013, a surface drill tested the down dip and easterly plunge component of the zone. Surface hole GH13-027 returned 4.94 g/t Au over 4.1 metres, including 6.21 g/t Au over 2.8 metres. This intersection is typical Smoke Deep mineralization, associated with the mafic volcanic and ultramafic volcanic contact. It is located approximately 375 metres directly east of the current Smoke Deep resource model and 160 metres below the current drill platform elevation. Drilling has demonstrated that the Smoke Deep mineralization appears to be wider, possesses a stronger alteration halo, is more consistent in grade and displays a 20 degree change in azimuth to the east at depth.
SAS recently extended the 945m Level hangingwall drill drift both to the east and west to provide a drill platform, with drilling in progress to test for the mineralized extensions both to the east, west and at depth.
Recent underground drill results for Smoke Deep are summarized in the table below.
Smoke Deep Zone - 2014 Underground Drill Program
Hole
Number Holloway Mine Grid Degrees Intersection (Metres) Core
Length Gold
Grade Gold
Grade
Easting Northing Elevation Azimuth Dip From To (Metres) (uncut)
g/t (cut)
g/t
885-02 7206.8 4578.5 2420.0 219 -41 25.3 26.8 1.5 6.91 -
And 52.7 54.0 1.3 3.43 -
885-03 7207.0 4578.8 2420.7 240 -36 9.4 12.2 2.8 5.92 -
And 15.0 18.0 3.0 3.41 -
And 19.9 20.7 0.8 6.14 -
And 66.8 77.3 10.5 3.81 -
including 66.8 70.0 3.2 4.32 -
including 74.0 77.3 3.3 4.48 -
905-01 7265.6 4494.2 2398.1 332 8 80.0 92.0 12.0 4.84 -
including 80.0 86.0 6.0 4.54 -
including 90.0 92.0 2.0 11.91 -
905-02 7267.1 4494.1 2397.2 40 -12 67.4 71.1 3.7 9.80 -
905-03 7267.5 4494.1 2396.8 40 -35 57.0 60.0 3.0 8.81 -
And 76.3 86.8 10.5 5.81 -
including 78.4 86.8 8.4 6.43 -
905-04 7268.1 4494.1 2396.1 58 -55 46.7 48.2 1.5 10.78 -
905-05 7268.6 4494.3 2396.8 58 -25 81.9 92.1 10.2 4.55 -
including 81.9 87.0 5.1 6.62 -
including 89.0 92.1 3.1 3.54 -
And 128.0 130.0 2.0 16.07 -
And 134.0 165.6 31.6 13.07 7.43
including 134.0 141.0 7.0 31.72 7.79
including 135.6 135.9 0.3 90.79 25.00
including 141.0 165.6 24.6 7.76 7.33
905-06 7265.7 4494.0 2397.6 340 -7 64.4 65.9 1.5 7.97 -
905-07 7267.0 4494.0 2397.6 40 -2 66.0 73.4 7.4 4.58 -
including 66.0 67.7 1.7 8.88 -
including 68.8 70.9 2.1 5.86 -
905-09 7273.0 4494.8 2396.1 67 -42 162.0 163.7 1.7 9.52 -
905-10 7272.3 4494.4 2397.6 0 -40 44.0 46.1 2.1 4.96 -
And 47.5 48.4 0.9 4.88 -
And 51.0 56.0 5.0 22.45 18.24
905-11 7272.3 4494.9 2396.8 53 -15 65.0 66.5 1.5 4.58 -
And 70.1 78.3 8.2 12.77 12.02
including 70.1 75.1 5.0 13.87 13.49
including 76.8 78.3 1.5 23.41 20.56
And 91.0 101.1 10.1 6.09 6.07
including 91.0 100.2 9.2 6.32 6.31
905-12 7274.5 4495.0 2396.1 61 -36 105.6 106.5 0.9 3.26 -
905-13 7271.6 4494.8 2396.8 0 -63 42.0 43.0 1.0 6.52 -
And 75.2 78.8 3.6 6.84 -
905-14 7272.3 4494.9 2395.8 19 -42 48.1 52.2 4.1 11.95 -
And 63.3 68.9 5.6 5.54 -
905-15 7272.3 4494.9 2395.8 19 -58 44.1 44.5 0.4 6.73 -
And 74.6 75.0 0.4 11.81 -
And 76.6 78.0 1.4 10.48 -
905-16 7272.3 4494.9 2395.8 19 -75 90.9 91.9 1.0 5.47 -
905-17 7273.3 4495.2 2397.0 45 -24 67.1 73.1 6.0 8.74 8.54
905-18 7273.5 4495.1 2397.5 50 -4 63.0 69.0 6.0 5.76 -
And 74.9 75.5 0.6 6.16 -
And 91.8 112.8 21.0 4.63 -
including 91.8 97.0 5.2 5.96 -
including 105.0 112.8 7.8 5.54 -
And 126.4 128.0 1.6 4.46 -
And 129.7 133.0 3.3 4.44 -
905-19 7273.7 4495.1 2396.8 53 -21 54.6 55.5 0.9 3.64 -
And 79.6 83.2 3.6 10.77 -
And 122.3 125.1 2.8 10.35 -
905-20 7272.3 4494.9 2397.2 50 4 62.0 62.7 0.7 3.09 -
And 68.1 69.0 0.9 3.81 -
And 72.0 72.5 0.5 7.88 -
And 85.0 90.0 5.0 9.61 7.66
905-21 7272.3 4494.9 2397.2 50 -38 63.9 72.8 8.9 11.10 10.72
including 63.9 68.0 4.1 15.12 14.29
including 69.6 72.8 3.2 11.23 -
And 80.8 86.9 6.1 9.46 -
945-01 7246.2 4456.9 2374.0 12 -18 53.2 53.5 0.3 8.23 -
And 81.7 88.0 6.3 8.75 7.79
including 81.7 83.7 2.0 18.97 16.07
945-03 7245.3 4457.0 2374.0 4 -10 52.0 52.3 0.3 4.35 -
And 76.6 78.8 2.2 18.35 -
945-04 7245.3 4457.0 2374.0 4 -23 80.1 82.4 2.3 18.79 13.90
945-07 7242.8 4457.0 2374.0 343 -2 80.7 82.8 2.1 5.11 -
Notes: Core lengths are reported as true widths have not been determined at this time. High grade assays are capped at 25 g/t Au.
Drilling, Assaying and QA/QC
Underground drilling at Smoke Deep is performed by Boreal Drilling based in Val-d'Or, QC. Core samples consist of BQ calibre split core, which is submitted to the Company's Holt Mine assay laboratory for gold analysis. Sample size used for analysis consists of 30 grams of sample material (1 Assay Ton). The laboratory employs an industry standard fire assay sample preparation with an atomic absorption finish. SAS employs an industry accepted QC /QA program consisting of certified reference standards and blanks that are inserted into the sample stream, which represent approximately 5% of the total sample population. Mineralized samples are routinely sent to an external laboratory for comparative laboratory analysis.
Qualified Person
The exploration programs on the Company's various mineral properties are under the supervision of Doug Cater, P. Geo, the Company's VP, Exploration. Mr. Cater is a qualified person as defined by NI 43-101, and has reviewed and approved this news release.
About SAS
SAS (operating as "SAS Goldmines"), is a gold mining and exploration company with an extensive land package in the Timmins mining district, north-eastern Ontario, which lies within the Abitibi greenstone belt, the most important host of historical gold production in Canada.
SAS owns and operates the Holt, Holloway and Hislop mines which contribute approximately 100,000 ounces of annual gold production. The Company is also advancing the Taylor Project and is conducting an aggressive exploration program across 120km of land straddling the Porcupine-Destor Fault Zone.
NYbob, Your Chart, Article Why Extreme Inflation is possible.
I checked out your chart on Monetary Base, scary, like Germany in 1920s. The article below has same chart as yours, and a video by Griffen, backs up what you are saying.
http://aun-tv.com/why-some-think-extreme-inflation-is-possible-for-usa-monetary-base-exploding/
SAS at 3 month highs, looking very good on chart. Another penny and will breakout.
Williams' interview is excerpted at the KWN blog
here --
Williams - If We Get A Short Squeeze Gold Could Go Ballistic -
http://kingworldnews.com/kingworldnews/KWN_DailyWeb/Entries/2014/7/2_Williams_-_If_We_Get_A_Short_Squeeze_Gold_Could_Go_Ballistic.html
You could see
gold at $100,000 an ounce USD, could be
a MILLION,
eventually could be
a BILLION as the Dollar loses value… .” –
John Williams
Read more at
http://investmentwatchblog.com/warning-massive-inflation-hyperinflation-of-the-dollar-is-on-the-way-as-in-no-purchasing-power-john-williams/#DLYOWYKVLoomGkTs.99
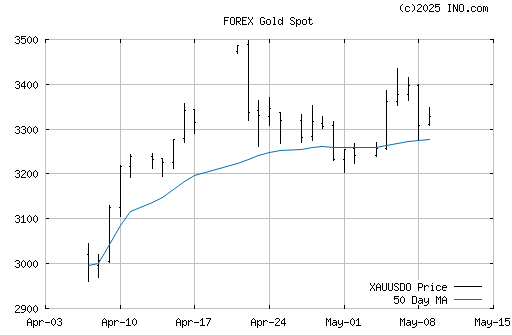
its a long hike back UP -
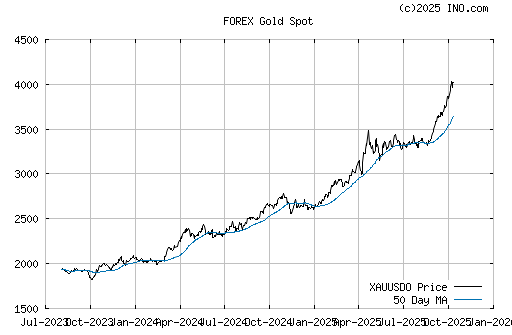
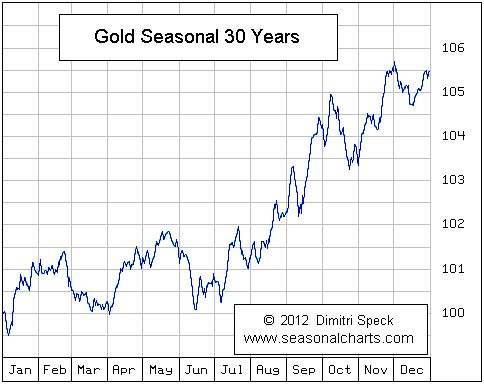
http://investorshub.advfn.com/boards/read_msg.aspx?message_id=103509045
God Bless
think you meant after June. Thanks it is doing well.
Nice charts
|
Followers
|
6
|
Posters
|
|
|
Posts (Today)
|
0
|
Posts (Total)
|
384
|
|
Created
|
09/29/06
|
Type
|
Free
|
| Moderators | |||


 http://www.ivarkreuger.com/metalcharts.htm
The super red banksters cults -
Rothschilds World Part 1 "Glen, Rush, Michael...Here's to you boy's"
http://www.youtube.com/watch?v=yhKHwrUA5SM&feature=related


| Volume | |
| Day Range: | |
| Bid Price | |
| Ask Price | |
| Last Trade Time: |


