 News
News  Market Data
  Discover
Support: 888-992-3836
Copyright © 2023 InvestorsHub Inc.


Register for free to join our community of investors and share your ideas. You will also get access to streaming quotes, interactive charts, trades, portfolio, live options flow and more tools.
Chart Analysis for SANM:
That's a nice 'Cup and Handle' formation it made Friday...
****************************************************************
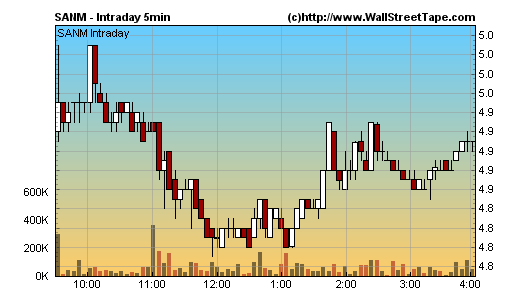
If it breaks above 4.95 and then 5.00 Monday, that would be very bullish...Bollinger Bands say that's nearly impossible on this chart as it's already at the upper BBand...The next resistance level would be at 5.11-5.12

****************************************************************
The hourly chart shows 5.00 is the potential upside before it struggles for more...4.80 should be a level of support at the lower BBand...But I'm not happy it set a new intraday low Friday that took out the support level it had Wednesday...CMF, OBV, and A/D lines still look terrible...RSI looks pretty good as it breaks out of a resistance level...ADX is neutral...So are Stochastics, but a solid run up to 5.00 should make it completely Overbought...Volume is still weak...

****************************************************************
The daily chart says OBV, Accumulation, and Money Flow are actually holding up very well during this pullback...If the RSI bounces up off the 50 line, that's bullish...The upper price targets are 5.60 by the Parabolic SAR, and 6.16 by the upper BBand...4.29 is the possible downside by the lower BBand...The candlesticks are both doji's for Thursday and Friday showing indecision...A reversal or a continuation are what they're saying, and need the first days of next week to decide it's direction...
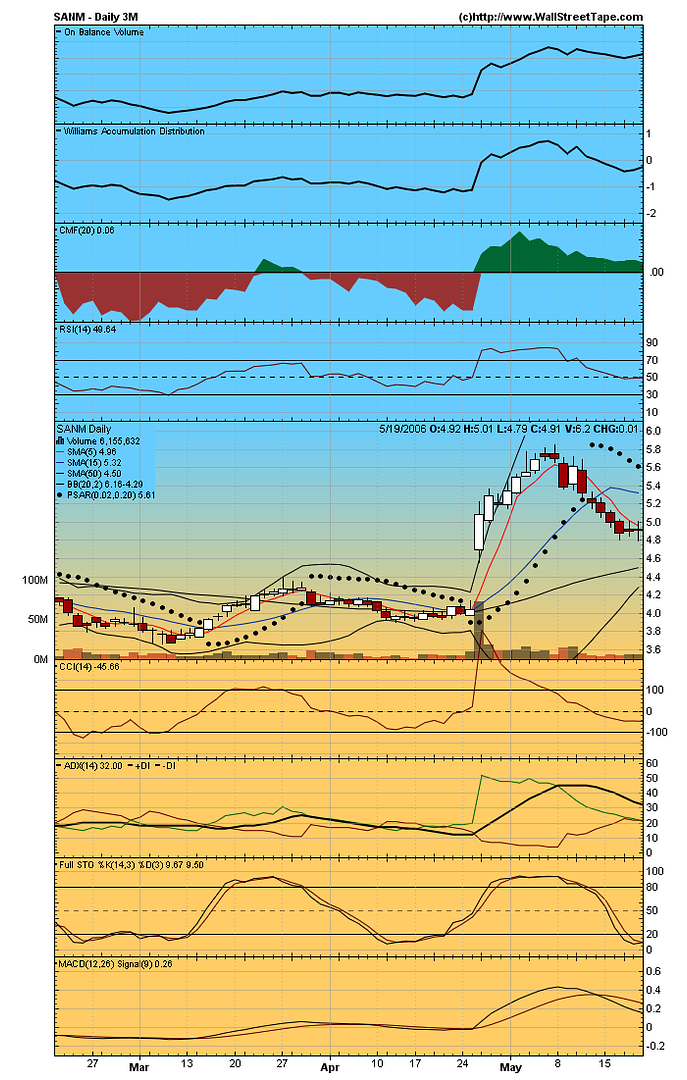
CCI is running flat...ADX is still downticking, and so are the DI's...Stochastics show it's very Oversold, and the fast line may cross up through the slow line Monday if it's an up day...MACD still looks Bad...Volume is still low compared to average...
****************************************************************
The weekly chart shows last week wasn't as bad as the previous week, so the bleeding is slowing down...Last weeks candlestick is only half as red as the previous one...5.54 is the upside price target on this chart, which is way lower than on the daily chart...
OBV, and Money Flow were fairly flat last week, but Accumulation still continues to downtick suggesting selling...RSI is still above 50 but it's headed that way...Moving Averages are still looking good however...Volume was also half of the previous week during the beginning of the selloff...
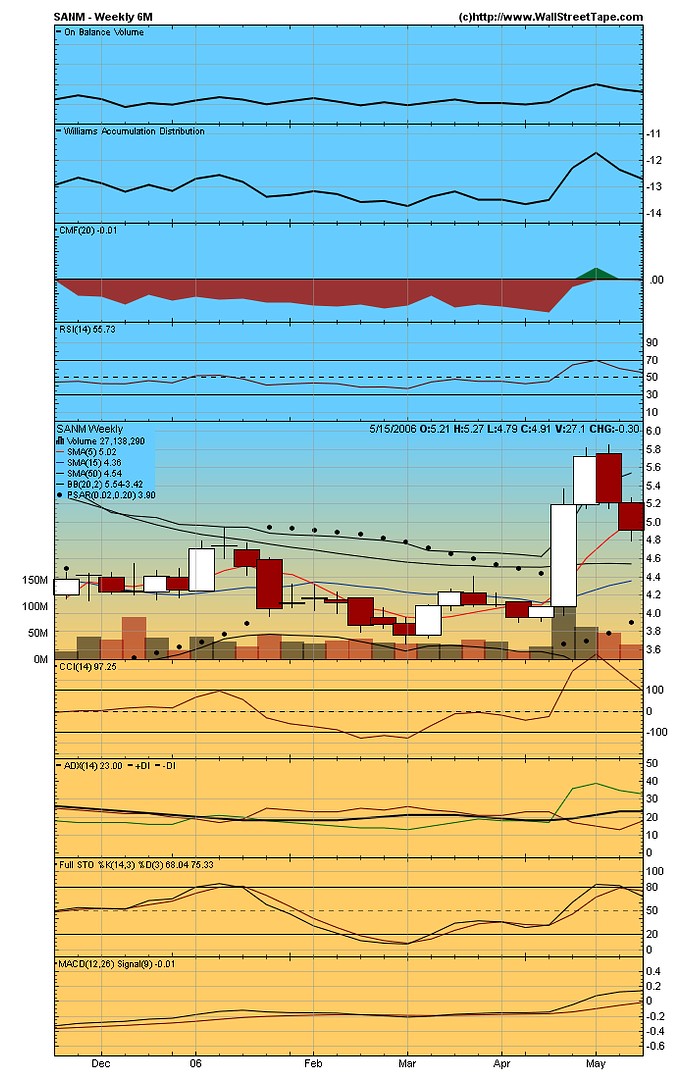
CCI is about to give another sell signal if it goes down early next week...ADX doesn't look too bad, but the DI's are converging...MACD still looks great...
****************************************************************
There are no clear indications on which way SANM will move next week...I'm getting mixed signals here like I'm a doji or something...lol
A lot will depend on what the Overall Market does next week to help determine which way this stock moves...It appears to be following the Naz and S&P charts, but to a lesser degree...
All I can say is I hope it starts up again next week and begins Elliot Wave #3...I'll be buying if it breaks above 4.95--5.00--and 5.11 with a thousand shares each buy...If it breaks below Friday's intraday low, more downside is to be expected, and I'll be moving on to greener pastures with a slight loss ;^((
GOOD LUCK TO ALL ;^))
'mugur'...Is that P&F Chart in our IBox...
Updating or not?...I find it hard to believe that the upside price target is still 9.00...
'mugur'...Elliot Wave Theory is something...
I wouldn't pay for...There is so much free information out there if you do a Google Search on it...
My friend 'blasher' has created a Board for it here on IHUB:
#board-5168
I have used Elliot Waves for years now, and have a fairly good understanding of how it works...
I use it frequently in my Day Trading Strategy knowing that the third wave is usually the biggest one...It works more times than it doesn't...
If SANM has actually bottomed here at a good level with only a 50% retracement off it's most recent highs, then we are about to enter the Third Wave on this move which should take us far above 5.85...
This move will depend a lot upon what the Overall Market does here in the near future...SANM has historically moved in tandem with the S&P500 chart (before it got beaten up so badly), and I'm seeing the same pattern develop again to some extent...
I still haven't researched the Pesavento Map yet, but with the doldrums of summer upon us, I will have time to look further into it...
I'm about to post my chart analysis on SANM and RBAK and possibly a few others today...I'm really liking what I see so far on RBAK, and I'm thinking that SANM may be setting a bottom at this time...I haven't completely finished my analysis yet, so it may be too early to draw any final conclusions yet...Stay tuned...lol
PP where do you get the Elliot Wave from and how much you pay for it?
I think if we can put EW and Pesavento Map on one chart that would be an AWESOME chart!
Sorry I forgot the link...
http://biz.yahoo.com/tm/060519/14334.html?.v=1
It's under yahoo news for sanm. Sometimes these "alerts" appear under yahoo. And sometimes when I do a dogpile news search it will come up. It's been like magic for rbak as I stated?
Hi! 'mince'...I've got to agree with you there...
SANM has held up VERY WELL during last weeks Market Meltdown...
I'm not familiar with "PowerRatings"...Can you supply a link to their website please?...TIA
If you look at Elliot Waves, this 50% pullback it's just done is the second wave...
The third wave is "usually" the biggest, and right here at these prices is a very good time to re-enter if it's going to go up next week...(Unfortunately, I sold out last week but am ready to go another round with SANM...)
If the third wave works like it's supposed to, this "should" take SANM to new highs...
Let's hope it doesn't head down to fill the gap to 4.40 because that would be way over a 68% Fibonacchi retracement (more like 100%), and would look very bad on the daily chart and scare a lot of potential investors away from this stock...
There are only two stocks I'm interested in playing next week, and SANM and RBAK are both holding up well through these hard times the overall Market is going through, and look to be able to continue to do so...
I'll be posting charts and comments on RBAK and SANM before the open Monday, but I'm getting ready to go out for the night now...I'll probably get around to this tomorrow...
Talk to you later 'mince'...It's good to have you aboard...
Here is my analysis of the Dow and Nasdaq charts:
As you can see from the one year chart, this pullback was the most severe during that time frame...That was one heck of a run in April (as we almost hit all time highs), that left the lower Bollinger Band at very low levels...
It ran about 600 points, and a bit "too far, too fast" at the end of the run, so a pullback was to be expected...The Dow had an average of 2 Billion shares traded daily last week which is quite high as the selloff occured...

Now the big question we ALL have is: IS IT OVER YET?, or is there still more downside to come?
The causes for this retracement are many...
The "Sell in May, and Go Away" market seasonality is here now...And as soon as school lets out for the year we enter the "doldrums of Summer" when the average daily Volume
decreases dramatically...
The Price of Oil is finally having an impact on Companies Earnings, and the pocketbooks of Consumers...
Commodities (Metals) had just had a huge run-up just before the pullback began...They have pulled back considerably at this point...
Interest Rates and Inflation are the biggest factor IMO...The new Fed Chairman announced another quarter point increase in interest rates May 12th, and left the door open to further increases...
The wording of his statement at that Fed Meeting was not what the Street wanted to hear, and there is a slight chance now that they will raise a half a point at their meeting in late June (or another quarter point, or a slight chance of not at all...)...
All eyes are on Inflation numbers for the rest of the year...I believe if the Fed raises a half a point in June, this will be very bad for the Market...
----------------------------------------------------------------
A closer look at the last two months shows that the Dow has not yet broken down through the support levels of mid-April (the Nasdaq has fared MUCH worse on this point)...
The Dow has held above the support levels and the close set on 4-17-06, and it has also closed below the lower Bollinger Band (BBand) only ONE day during this pullback...(not so with the Nasdaq...see below)...
The lower BBand has turned down the last three sessions, but Friday's doji candlestick that closed inside the lower BBand may be a turn-around signal (but a doji can also be a continuation of the downtrend signal...)
Monday we will know which one it is for sure...Maybe the most we can hope for early next week is a dead-cat bounce...
Remember that Friday was Options Expiration Friday, that comes the third Friday of every month and is associated with Volatility...

The Technical Indicators say: The Parabolic SAR price target to the upside is 11525 while the upper BBand still sits above 11675 so that's the potential upside on this chart, though I find that scenario VERY doubtful...Even a 50% dead-cat bounce would only put it at about 11400 and the hourly chart below says even that level isn't in the cards in the short-term...(11250 is the near term target or a 30% bounce off the lows which is OK and normal)...
The CCI is at very low levels and is trying to turn up here...IF it manages to cross above the -100 line, that will be a buy signal to many...
The RSI didn't go as low as I had hoped it would on this pullback...Usually, heavy buying doesn't come in until the RSI hits 30 or less and it has turned up at 35 at
this point (the Nasdaq RSI hit 25!!!)...It is however trying to turn up here and a small rally Monday will make it look like a buy signal to many...
The ADX is showing the downtrend strengthened, and the DMI's have not as yet made any sign of a reversal...When they start to converge even a little, that will be a good sign...
Stochastics are showing it reached 100% Oversold conditions, and the fast line has crossed up through the slow line, so there is hope that this trend will continue...
The MACD is looking bad here, and the Histogram actually worsened Friday even though it closed up 15 points...Blame that on the Volatility Friday, and the lower wick of the doji (intraday low) it set...
----------------------------------------------------------------
The hourly chart show a possible double-bottom may have formed Friday...A break above 11200 will confirm it...The 5SMA is about to cross up through the 15SMA and that would be bullish...
The Parabolic SAR and lower BBand sit just under 11100 so that's the potential downside to this chart...The upper BBand is at 11250 so that's the potential upside...
Money Flow almost broke above zero late Friday, and if it does Monday is also bullish sign...OBV held up fairly well, but Accumulation shows little sign of improvement...

The CCI gave a buy signal late Friday and the RSI broke above a level of resistance also...ADX shows the downtrend has lost momentum, and the DMI's are still inconclusive...Stochastics are in the middle, and a break above 50 would be bullish...Turning back down at the 50 line would be bearish...
----------------------------------------------------------------
The Nasdaq (Technology) has fared much worse during the entire Q1 Reporting Season, and especially during this pullback...On the one year chart, it has broken down through all levels of
support it had this year and is now negative for 2006 by -0.5%, while the Dow is still up 4% and the S&P500 is up 1.5%...
The daily chart shows that it closed below the lower BBand six sessions in a row, and finally closed inside the BBands Friday as it formed a fairly bullish candlestick that day...If it had opened a bit lower, the candlestick would have been a fully encompassing green over red...
The CCI interestingly enough upticked the last 5 sessions as the closing numbers fell hard...It's about to give a buy signal
if it can cross up through the -100 line...
The RSI hit 25 which is almost unheard of and tells me
there are a lot of stocks out there that are at very good buy prices...The ADX shows no signs of turning yet, but it is a lagging indicator for short term moves...When the DMI- starts to head down, that will be a good sign...
The MACD is bad here, but the Histogram actually upticked
slightly Friday...Now we are waiting for the fast line to turn up also...Volume was also unusually heavy last week for the Nasdaq...

----------------------------------------------------------------
The hourly chart shows it right in the middle of the BBands, but with little room to move in either direction...2215 is the potential upside on this chart...
Money Flow upticked Friday, but the OBV and Accumulation show no improvement...The CCI is fairly neutral at this point, and I'm surprised it's as high as it is as of Friday's close...The RSI breaking above 50 would be a bullish sign...
The ADX show signs of improvement slightly...Stochastics approaching Overbought is not a good sign...When it gets to the upper BBand it will be totally Overbought...This isn't good if you're a Bull...It it breaks below Friday's intraday low, the Bulls will be in a world of hurt...

----------------------------------------------------------------
Now, it's time to get gutsy with a prediction or two...
First, I will say we are 100% cash right now with no positions, and have been for almost two weeks now...We had a VERY GOOD first four and a half months this year, and I see no reason to do anything that will take away those gains...
I do know how to Sell Short, but it is not one of my favorite plays...We could have made a LOT of money shorting a number of stocks recently, but I've had better things to do with my time...I like it when the Market is in an UPtrend...
I expect a 'dead-cat bounce' and 'short-covering rally' Monday or early next week...The RSI of the Dow and Nasdaq are at levels that usually encourage buying...After that, it's anyone's guess, but the warning is:
If the Dow or Nasdaq break below Friday's intraday lows, and close below them anytime next week, the Bulls are in for more pain...
I am a BULL myself, and will be so until things change enough to change that...This Market is still in an UPtrend, believe it or not...
I would like to see a nice rally next week that pushes the upper BBands UP on the daily charts of the Dow and Nasdaq...Then I will have something interesting to talk about...
Until then, I advise extreme caution...
We have a few stocks in our stable that could still have a good next few months no matter what the overall Market does, and I will be concentrating on them and posting as necessary...
SANM and RBAK are still my two favorites that have held up VERY WELL during this pullback...CPTC is still one of my favorites, and always will be because I believe that someday they will finally get their act together, and the product they offer will take finally take hold in the Electricity Transmission Sector...
Next week should be very interesting, and will determine if this Market is still in a Bull phase, or if the Bear is finally going to take over...
GOOD LUCK TO ALL NEXT WEEK!!!
SANM on powerratings radar
3 times I've seen RBAK on their radar including early last week. And three times they have moved significantly to the upside.
Almost bought some put options on this when it was $5.03 ,thinking it will go to $4.
Let's see how this plays out.Lots of strong support at the $5 area.Might go up,after a short dip under $5
Nice reversal at $4.95,on daily chart,but on Level 2 the wall is thick at $5.09
PP,how do we play it now?I think it will come back down to $4.40'ish to fill the gap.So...shorting it(if you can) or buying put options on it is my ideea.
What do you think?
Did you get Pesavento Map indicator yet?
HI JAKE...I GUESS YOU DIDN'T SEE THE NEXT POST...
AFTER THE ONE YOU REFERENCED:
http://www.investorshub.com/boards/read_msg.asp?message_id=11024046
"My stop loss exit is a penny below today's...
Intraday low of 5.43"
I GOT FORCED OUT OF THAT POSITION THE SAME DAY I POSTED THOSE TWO MESSAGES BECAUSE I WAS OUT MOST OF THE DAY, AND HAD A STOP LOSS LIMIT ORDER IN...
WHICH IS A SHAME, BECAUSE IT RALLIED HARD ON THE 10TH AND I MISSED IT ;^(((
PP ..
ARE YOU STILL HOLDING THIS AT 5.48 ???
YOU NEVER SAID IF YOU DUMPED THIS OR NOT .....THANKS, JAKE
Good morning 'gjd'...Sure this is a good one...
To learn from...They ALL are...The biggest lesson this one has given so far is in post #4...That one teaches you how to find a stock that has ended a long downtrend, with all the signs that things are about to turn around...
At this point, I'm still sticking to the Long Term Hold theory and have a few thousand shares to back that up...This one could be at $10.00 by the end of the year...
It's also a good Swing Trading candidate, as it was easy to pick the top last Monday...No stock can go straight up without stopping...There were all kinds of signs it was due for a pullback last week...
Now, if you were shorting it last week, I would've covered them Friday just before the close as it set a doji candlestick that day and it's already had a 50% retracement by starting the run at 4.00 and almost hitting 6.00 and now it's around 5.00...
Now the question is: At which Fibronachi (sp?) line will it stop falling?...It could take back 68% of it's gains, which is the next major level down from 50%...
One thing I've learned about SANM's candlestick charts is: You can't count on it's daily candlesticks to let you know what tomorrow will bring...On it's first run, it had three 'shooting star' daily candlesticks...That's usually a bearish signal, but each time it set one of those, it went up not down the next day...
Now look at the Weekly Chart in the IBox of this board...Last week was a red candlestick that fully encompasses the previous weeks white candlestick...This is 'usually' a Very bearish signal...
I wouldn't be surprised if SANM had a really good week this week, but if it follows what the Weekly Chart says it will do, it will have another down week this week, but not as bad as last week...
It's important to remember that we are into the "Sell in May, and GO AWAY!" time of year...You have to take into account Seasonality of the Market Cycles...
This time of year I spend more time outside, and pay much less attention to the Market...Early October through January 1st is the best time of year historically, and the Market has my undivided attention...It's called the Santa Claus Rally, and it usually begins by mid-October...
April is usually the best month of the year for the Dow on a historical basis (August and September are usually the worst)...It came very close to setting an ALL TIME HIGH early last week before the bloodbath of Thursday and Friday...
The Nasdaq is reaching levels of bottoming, but the Dow is only halfway to that point (that's because Technology=Nasdaq lagged the Dow the entire Reporting Season that just ended)...
The two very tall and red candlesticks they both set late last week call for another down today-but not as bad, and maybe Tuesday or Wednesday of this week it can try to set a bottoming doji...
At least over 90% of Companies have reported their Numbers already, so Reporting Season is almost officially over, and that won't be an influence on the Market anymore for a while...
Now it's all about Inflation Numbers, and Commodities pricing, which is a new twist...We haven't been affected by Commodities prices like we were last week in a while...
Anyway, this week I'll probably just "watch" the Market, and only when I walk by the computer...I won't be convinced this selloff is over until I'm sure it is...There could be some very good entry prices on a lot of stocks soon...
RBAK set a second low on Friday on the Daily Chart...That's usually my signal to buy, but the overall chart pattern is a Head and Shoulders (that has two heads) which is bearish, but it's also near the end of one of it's famous 'Bull Flag' consolidations, so there are mixed signals with it too...
I'll take a medium sized position on RBAK today if it shows strength early with Volume behind it...The stop loss exit on that trade will be if it breaks below Friday's intraday low...
Happy Trading this Week!
Good Afternoon PowerPole,
Keeping up with your posts to this Board and learning from your analysis of the charts. I take it that you think this stock will be a good one to learn from.
Thanks,
GJD
You are Wellcome PowerPole about Pesavento Map!Yes,indeed is a fantastic indicator, giving you a glimpse into the next trading days.
I am considering paying $40 a month to get the software.But since i am not daytrading, and i want to focus more on the option trading.....
Anyway,glad to see that BOTH of us made money on SANM ,and i am looking forward on your thoughts for a reentry.
Have a pleasent and relaxing weekend!
What a Crazy week for the Market!...It had been up...
Five weeks in a row, and all hell broke loose when the profit taking began Thursday and Friday...
I'm glad I sold out of SANM Monday (the day it topped) and the rest of our positions Tuesday, and took the rest of the week off...
I was outside most of the week, and when I'd come inside I'd take a look at the charts and be glad I wasn't involved in that 'bloodbath'...
The question now is: Where will the Dow and Nasdaq bottom?
I'll be posting charts for the Indicies and my favorites sometime this weekend...There will be some really good entry prices on a number of stocks next week, and I'm ready to GO FOR IT! again...
I did a little research on the "Pesavento Map", because I'd never heard of it before...It looks very interesting as a subject for further study...It was very accurate two days in a row, and I'd like to see it's performance over a longer period of time...
Thanks! for sharing it with us 'mugur'...Anything that helps us become better traders is what these boards are all about...
Look for a detailed chart analysis for SANM today or tomorrow...
Sold my option calls today, at 1 o'clock ,when the stock price was $5.60'ish like i said yeasterday,hahaha
Looks like that Pesavento Map was right !!!
The Map also shows this going to $5.30's in the next couple of days.
Let see if i am right again,hehe
Thanks PowerPole for keeping me updated on your moves
The chart pattern it formed yesterday...
A flat consolidation after a downtrend and closing only two cents off the intraday low, which formed a tall almost solid red candlestick on the daily chart, usually yields down one more day...I expect it to be down .15 or so sometime today, but it may form a 'doji' candlestick either today or tomorrow...
I think it'll close down .15 today, and form the bottoming doji candlestick tomorrow...
But then, what the 'Frankie' do I know?...It might just start heading back up today...I'll be watching and waiting for a good entry again...I'll let you all know when I think that is...
I expect a sideways trading today and a high of $5.60'ish for Thursday,when i will sell my calls.
This is according to my reading of Pesevento map indicator.Let's see how accurate that is,hehe...
Nice moves PP.You were all out ,right on the day it started the downtrend.I am one day late,and if i sell i will be at a small loss,but...still in.
Yes,a retracement allright but small.
On the weekly chart the red candle is smaller than the white one,so maybe just a retracement ,consolidation?
UGLY Looking Chart today...Consolidating in a downtrend...
If it was to close now, it would almost surely go down again tomorrow...
But...When you think about it...It ran about 1.80 and only pulled back about .45 so far...That's only a 25% retracement!
5 minute Bollies are really tight...Something's about to break...Which way is the big ???...
My stop loss exit is a penny below today's...
Intraday low of 5.43
Well Bill...It's headed your way, but...
I think your price target is a bit low...lol
Nope....
Didn't get my other stock sold today.... Maybe tomorrow though... I was watching this one though and like you said ..I see a 6.13 possible on the upside but will wait and see. I did put in an order at 4.84 in antisapation of a pullback and will leave it stand just in case it does.
king...
The Market was flat today, and so was SANM...eom
Yes, it did...The Market was flat today...
So that makes sense...I used to daytrade the heck out of this one a couple of years ago...It used to move tick for tick with the S&P500 chart...I'm keeping an eye on it to see if it will still do that...
The ten day hourly chart looks good, and the daily chart shows 6.13 as the possible upside here...
It was the first day it closed down in a while...There are some mixed signals from the technical indicators, so we'll just have to see what's next...
I'm still fairly bullish on this one...Tomorrow will decide it's direction I'm fairly sure...
I'm all out as of today until I see what's next...I'll keep you advised as it happens...
Did you buy some today?...I did warn you it may have to rest or pullback here for a while...
Looking forward to tomorrow...
PP
What happened at 11:30?Why the sudden drop?
Also,at the daily chart i see a black candle followed by a red one,today.
This means we can see some correction,so i think i will sell my calls here,at $5.70'ish.
PowerPole,your opinion?
Looking GOOD!!! $5.8496 !!!
I totally agree 'mugur'...I was getting ready to post...
And comment on SANM's day Friday, and it was going to be Super Bullish....
The chart it formed until the last half hour was Extremely Bullish...
It was the "usual" Friday afternoon day traders bailing out when it didn't bust up hard in time for the close...I know I did just in time ;^)))
Friday is also famous for a lot of traders taking all their money off the table for the weekend...I know I do that at times too...
So other than a light volume selloff at the end of the day, and what would've been a tall green candlestick somehow ends up looking like a black bodied spinning top...
I'm not going to worry about it...I saw the whole day develop...So this time I'm not concerned about Friday's candlestick...
Just look at the Weekly Chart in the IBox!!!...The PPO hasn't turned down on the Daily or Weekly Charts!...Volume is Outstanding!...
Sure a consolidation or even a pullback may come soon...Maybe it doesn't...I think it's slow and steady up 1-2% a day on average this year...
I've got a few K shares in the low 5.60's and I day trade 5K shares a pop, so this one's got my interest...lol
EDGA is the MM to watch on Level 2...He'll let you know which way he's going to take it...At least last week he was top dog...
Good Luck To ALL ;^))
Well.it was Friday,end of the day and end of the week,ao...the usual profit takers,nothing serious.
It looks like a black candel has formed though.What are your thought on that?
I am up 50% on my option calls, and i am thinking about selling them for a profit,hoping to buy them back later .
What a nice day SANM had going...
UNTIL THE FINAL HALF HOUR ;^(((
It sets a new high by a penny, and one minute later...
It's Down .10...
It just went to touch the Parabolic SAR and give one of the Big Boys a good entry price ;^))
Don't worry,still within the Bollinger Bands 5.62-5.82
Yeah, but look at what it just did ;^(((
Fantastic strength!!!I think you caught a reversal trend here,PP!
Nice close today!...eom
Haha,thanks for the compliment on the charts,PP.Just joking
$5.70!!!!Nice
SANM is breaking out to a new high of day now...
With an increase of Volume...Man, it's a strong looking set of charts! ;^))
HUGE trades After Hours.Here is the list.Something is up if they trade all these shares AH.
Good find Power Pole!This is a HOLD for now!
SanminaSCI Corp. DL (5/4/2006 12:56 AM)
Level II Quotebook
Time & Sales
Price Size Exch Time
5.54 3725 NSD 18:28:31
5.51 1300 NSD 17:55:53
5.52 700 NSD 17:55:49
5.55 3723 NSD 17:41:12
5.55 177 NSD 17:40:43
5.55 900 NSD 17:21:28
5.61 14119 NSD 17:00:16
5.61 5618 NSD 17:00:02
5.61 17539 NSD 17:00:01
5.61 22826 NSD 16:59:47
5.61 14725 NSD 16:59:46
5.55 5817 NSD 16:46:13
5.55 1248 NSD 16:41:46
5.55 5912 NSD 16:14:52
5.55 100 NSD 16:14:35
5.55 100 NSD 16:13:56
5.60 31000 NSD 16:13:45
5.60 36900 NSD 16:10:04
5.55 2270 NSD 16:08:54
5.58 1960 PAC 16:05:10
5.56 24500 NSD 16:02:39
5.55 100 NSD 16:01:42
5.55 3014 NSD 16:01:42
5.55 35171 NSD 16:01:33
5.55 300 NSD 16:00:26
5.55 200 NSD 16:00:25
5.55 500 NSD 16:00:23
5.50 437 PAC 16:00:05
5.48 500 PAC 16:00:05
5.55 35171 NSD 16:00:01
Also,looking at the weekly chart,the PPO (black line) still going straight up,no curling or turning yet,at the 5 mark.
At the first sign of turning around ,i will sell my July calls at a profit and i will buy them later in the month.
Today's candlestick on the daily chart...
Is starting to look like it could turn into a shooting star...
This could be the near term top, so it can consolidate or retreat for a while...
It HAS had a really nice run so far...
The day isn't over yet, so we'll have to see how it looks at the close...
|
Followers
|
10
|
Posters
|
|
|
Posts (Today)
|
0
|
Posts (Total)
|
167
|
|
Created
|
07/22/04
|
Type
|
Free
|
| Moderators | |||
| Volume | |
| Day Range: | |
| Bid Price | |
| Ask Price | |
| Last Trade Time: |


