


Sunday, May 21, 2006 6:57:37 PM
That's a nice 'Cup and Handle' formation it made Friday...
****************************************************************
If it breaks above 4.95 and then 5.00 Monday, that would be very bullish...Bollinger Bands say that's nearly impossible on this chart as it's already at the upper BBand...The next resistance level would be at 5.11-5.12

****************************************************************
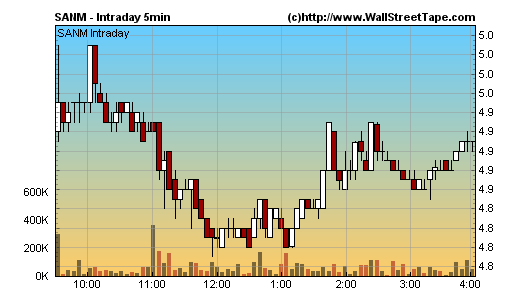
The hourly chart shows 5.00 is the potential upside before it struggles for more...4.80 should be a level of support at the lower BBand...But I'm not happy it set a new intraday low Friday that took out the support level it had Wednesday...CMF, OBV, and A/D lines still look terrible...RSI looks pretty good as it breaks out of a resistance level...ADX is neutral...So are Stochastics, but a solid run up to 5.00 should make it completely Overbought...Volume is still weak...

****************************************************************
The daily chart says OBV, Accumulation, and Money Flow are actually holding up very well during this pullback...If the RSI bounces up off the 50 line, that's bullish...The upper price targets are 5.60 by the Parabolic SAR, and 6.16 by the upper BBand...4.29 is the possible downside by the lower BBand...The candlesticks are both doji's for Thursday and Friday showing indecision...A reversal or a continuation are what they're saying, and need the first days of next week to decide it's direction...
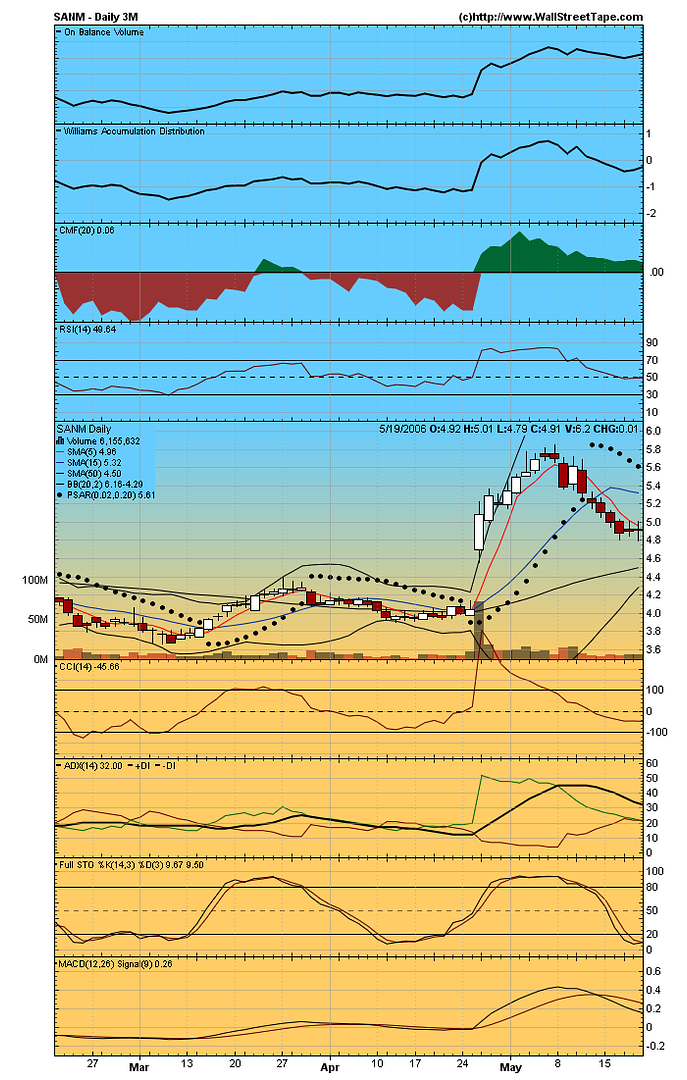
CCI is running flat...ADX is still downticking, and so are the DI's...Stochastics show it's very Oversold, and the fast line may cross up through the slow line Monday if it's an up day...MACD still looks Bad...Volume is still low compared to average...
****************************************************************
The weekly chart shows last week wasn't as bad as the previous week, so the bleeding is slowing down...Last weeks candlestick is only half as red as the previous one...5.54 is the upside price target on this chart, which is way lower than on the daily chart...
OBV, and Money Flow were fairly flat last week, but Accumulation still continues to downtick suggesting selling...RSI is still above 50 but it's headed that way...Moving Averages are still looking good however...Volume was also half of the previous week during the beginning of the selloff...
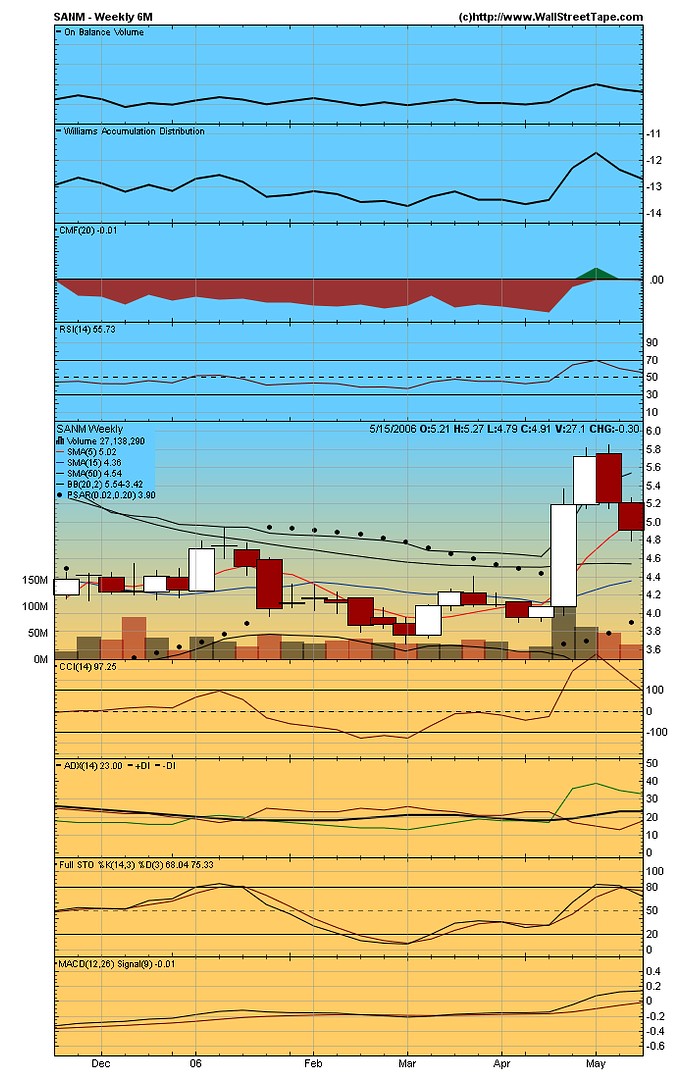
CCI is about to give another sell signal if it goes down early next week...ADX doesn't look too bad, but the DI's are converging...MACD still looks great...
****************************************************************
There are no clear indications on which way SANM will move next week...I'm getting mixed signals here like I'm a doji or something...lol
A lot will depend on what the Overall Market does next week to help determine which way this stock moves...It appears to be following the Naz and S&P charts, but to a lesser degree...
All I can say is I hope it starts up again next week and begins Elliot Wave #3...I'll be buying if it breaks above 4.95--5.00--and 5.11 with a thousand shares each buy...If it breaks below Friday's intraday low, more downside is to be expected, and I'll be moving on to greener pastures with a slight loss ;^((
GOOD LUCK TO ALL ;^))


PowerPole >>>>>>>>>>>>>>>>>>>>>>>>>>>>>>>>>
Recent SANM News
- Form 4 - Statement of changes in beneficial ownership of securities • Edgar (US Regulatory) • 08/16/2024 08:01:48 PM
- Form 4 - Statement of changes in beneficial ownership of securities • Edgar (US Regulatory) • 08/16/2024 08:01:22 PM
- Form 4 - Statement of changes in beneficial ownership of securities • Edgar (US Regulatory) • 08/16/2024 08:01:13 PM
- Form 144 - Report of proposed sale of securities • Edgar (US Regulatory) • 08/14/2024 08:39:34 PM
- Form 144 - Report of proposed sale of securities • Edgar (US Regulatory) • 08/14/2024 08:03:50 PM
- Form 4 - Statement of changes in beneficial ownership of securities • Edgar (US Regulatory) • 08/14/2024 12:12:03 AM
- Form 144 - Report of proposed sale of securities • Edgar (US Regulatory) • 08/09/2024 09:22:29 PM
- Form 4 - Statement of changes in beneficial ownership of securities • Edgar (US Regulatory) • 08/08/2024 08:02:01 PM
- Form 4 - Statement of changes in beneficial ownership of securities • Edgar (US Regulatory) • 08/08/2024 08:01:10 PM
- Form 144 - Report of proposed sale of securities • Edgar (US Regulatory) • 08/07/2024 08:27:25 PM
- Viking Enterprise Solutions WINS PRESTIGIOUS BEST OF SHOW AI/ML AWARD AT FMS: THE FUTURE OF MEMORY AND STORAGE • PR Newswire (US) • 08/07/2024 12:30:00 PM
- Form 144 - Report of proposed sale of securities • Edgar (US Regulatory) • 08/06/2024 09:11:13 PM
- Form 4 - Statement of changes in beneficial ownership of securities • Edgar (US Regulatory) • 08/01/2024 08:04:00 PM
- Form 144 - Report of proposed sale of securities • Edgar (US Regulatory) • 07/31/2024 10:35:13 PM
- Form 10-Q - Quarterly report [Sections 13 or 15(d)] • Edgar (US Regulatory) • 07/31/2024 08:29:01 PM
- Form 8-K - Current report • Edgar (US Regulatory) • 07/29/2024 08:04:30 PM
- Sanmina's Third Quarter Fiscal 2024 Financial Results • PR Newswire (US) • 07/29/2024 08:01:00 PM
- SANMINA CORPORATION INVITES YOU TO JOIN ITS THIRD QUARTER FISCAL 2024 EARNINGS CONFERENCE CALL • PR Newswire (US) • 07/19/2024 09:00:00 PM
- Form 8-K/A - Current report: [Amend] • Edgar (US Regulatory) • 06/14/2024 08:05:21 PM
- 42Q Launches Advanced Chatbot Powered by Amazon Bedrock, Redefining Customer Interaction and Manufacturing Automation • PR Newswire (US) • 06/13/2024 12:30:00 PM
- Form SD - Specialized disclosure report • Edgar (US Regulatory) • 05/30/2024 08:08:14 PM
- Form 8-K - Current report • Edgar (US Regulatory) • 05/30/2024 08:05:37 PM
- Form 4 - Statement of changes in beneficial ownership of securities • Edgar (US Regulatory) • 05/28/2024 09:04:23 PM
- Form 4 - Statement of changes in beneficial ownership of securities • Edgar (US Regulatory) • 05/17/2024 08:01:29 PM
- Form 4 - Statement of changes in beneficial ownership of securities • Edgar (US Regulatory) • 05/16/2024 09:04:42 PM
PickleJar Unveils Latest Venue Managed Services Innovations in Upcoming Webinar • PKLE • Aug 23, 2024 1:11 PM
Element79 Gold Corp Provides Update on Nevada Portfolio • ELMGF • Aug 23, 2024 8:00 AM
Maybacks Adds Award Winning Show to Its Lineup Discusses Maybacks Opportunity • AHRO • Aug 22, 2024 11:30 AM
North Bay Resources Announces First Gold Concentrate at Mt. Vernon Gold Mine, Assays 12 oz/ton Gold, 17.5 oz/ton Platinum, and 8 oz./ton Silver, Sierra County, California • NBRI • Aug 22, 2024 10:28 AM
All Things Mobile Analytic, Inc. Reports Major Growth with Over $11 Million in Revenue • ATMH • Aug 22, 2024 7:19 AM
Unitronix Announces Strategic Entry into Cryptocurrency Space • UTRX • Aug 21, 2024 10:00 AM

