 News
News  Market Data
  Discover
Support: 888-992-3836
Copyright © 2023 InvestorsHub Inc.


Register for free to join our community of investors and share your ideas. You will also get access to streaming quotes, interactive charts, trades, portfolio, live options flow and more tools.
BULLISH MATCHING LOW
Bullish Matching Low Pattern occurs when two black days appear with equal closes in a downtrend. The pattern is suggestive of a short-term support, and it may cause a reversal on the next day of trading.
Recognition Criteria:
1. The market moves in downtrend.
2. We then see a long black candlestick on the first day.
3. Second day follows with another black candlestick whose closing price is equal or extremely close to the closing price of the first day.
Explanation:
Market continues to move down as evidenced by first black candlestick. Next day; prices open at a higher level, they then continue to go up during the day but the day closes at a price which is equal to the closing price of the previous day. This pattern suggests a short-term support. Shorts should be aware of this fact. If they ignore Bullish Matching Low Pattern as a possible reversal signal, they may pay for it soon. Two days closing at the same price is indicative of short-term support and this support may be followed by a reversal on the next day of trading.
Important Factors:
The reversal of downtrend requires a confirmation on the third day. The confirmation of the trend reversal may be in the form of a white candlestick, a large gap up or a higher close on the next trading day (on the third day). 
Issuers of ETFs
? AdvisorShares issues actively managed ETFs.
? Bips Investment Managers issues Bips (Beta Investment Performance Securities).
? BNP Paribas issues EasyETFs.
? BlackRock issues iShares.
? Charles Schwab offers several commission-free ETFs for its clients.
? Deutsche Bank issues db x-trackers ETFs, as well as managing PowerShares DB commodity- and currency-based ETFs.
? ETF Securities issues ETFs or specialised commodity ETCs.
? Global X Funds issues ETFs.
? Guggenheim Funds issues specialty Guggenheim Funds ETFs.
? Invesco issues PowerShares ETFs, as well as BLDRS based on American Depositary Receipts.
? Lyxor Asset Management issues Lyxor ETFs.
? Merrill Lynch issues HOLDRs.
? Source UK Services, a European joint-venture between Bank of America Merrill Lynch, Goldman Sachs, Morgan Stanley, Nomura and J. P. Morgan issues ETFs and ETCs
? State Street Global Advisors issues SPDRs.
? Van Eck Global issues Market Vectors ETFs.
? Vanguard Group issues Vanguard ETFs, formerly known as VIPERs.
Form 10-K~ SEC Filings Explained
A Form 10-K is an annual report required by the U.S. Securities and Exchange Commission (SEC), that gives a comprehensive summary of a public company's performance. Although similarly named, the annual report on Form 10-K is distinct from the often glossy "annual report to shareholders," which a company must send to its shareholders when it holds an annual meeting to elect directors (though some companies combine the annual report and the 10-K into one document). The 10-K includes information such as company history, organizational structure, executive compensation, equity, subsidiaries, and audited financial statements, among other information.
Companies with more than $10 million in assets and a class of equity securities that is held by more than 500 owners must file annual and other periodic reports, regardless of whether the securities are publicly or privately traded. Up until March 16, 2009, smaller companies could use Form 10-KSB. If a shareholder requests a company’s Form 10-K, the company must provide a copy. In addition, most large companies must disclose on Form 10-K whether the company makes its periodic and current reports available, free of charge, on its website. Form 10-K, as well as other SEC filings may be searched at theEDGAR database on the SEC's website.
In addition to the 10-K, which is filed annually, a company is also required to file quarterly reports on Form 10-Q. Information for the final quarter of a firm'sfiscal year is included in the annual 10-K, so only three 10-Q filings are made each year. In the period between these filings, and in case of a significant event, such as a CEO departing or bankruptcy, a Form 8-K must be filed in order to provide up to date information.
The name of the Form 10-K comes from the CFR (Code of Federal Regulations) designation of the form pursuant to sections 13 and 15(d) of the Securities Exchange Act of 1934 as amended.
Related Forms
Unlike the 10-K filed annually, other forms serve related purposes, but have different schedules. Form 10-Q, much briefer, is filed after each of the three quarters that do not have a 10-K filing. Form 8-K covers special material events that occur between 10-K and 10-Q filings.
A substantial number of firms filed their 10-K as a Form 10-K405 during the late 1990s and early 2000s (decade). A 10-K405 is a 10-K where the Regulation S-K Item 405 box on the cover page is checked. Due to confusion in its application, the 10-K405 was eliminated in 2002.
Filing Deadlines
Historically, Form 10-K had to be filed with the SEC within 90 days after the end of the company's fiscal year. However, in September 2002, the SEC approved a Final Rule that changed the deadlines to 75 days for Form 10-K for "accelerated filers"; meaning issuers that have a public float of at least $75 million, that have been subject to the Exchange Act's reporting requirements for at least 12 calendar months, that previously have filed at least one annual report, and that are not eligible to file their quarterly and annual reports on Forms 10-QSB and 10-KSB. These shortened deadlines were to be phased in over a three-year period, however in 2004 the SEC postponed the three-year phase in by one year. In December 2005, the SEC created a third category of "large accelerated filers," accelerated filers with a public float of over $700 million. As of December 27, 2005, the deadline for filing for large accelerated filers was still 75 days, however beginning with the fiscal year ending on or after December 15, 2006, the deadline will be 60 days. For other accelerated filers the deadline will remain at 75 days and for non-accelerated filers the deadline will remain at 90 days. For further reading, see the Final Rules [1] section of the SEC's website, referencing Rule 33-8644.
Parts
Every annual report contains 4 parts and 15 schedules. They are
PART I
ITEM 1. Description of Business
ITEM 1A. Risk Factor
ITEM 1B. Unresolved Staff Comments
ITEM 2. Description of Properties
ITEM 3. Legal Proceedings
ITEM 4. Mine Safety Disclosures
PART II
ITEM 5. Market for Registrant’s Common Equity, Related Stockholder Matters and Issuer Purchases of Equity Securities
ITEM 6. Selected Financial Data
ITEM 7. Management’s Discussion and Analysis of Financial Condition and Results of Operations
ITEM 7A. Quantitative and Qualitative Disclosures About Market Risk
ITEM 8. Financial Statements and Supplementary Data
ITEM 9. Changes in and Disagreements With Accountants on Accounting and Financial Disclosure
ITEM 9A(T). Controls and Procedures
ITEM 9B. Other Information
PART III
ITEM 10. Directors, Executive Officers and Corporate Governance
ITEM 11. Executive Compensation
ITEM 12. Security Ownership of Certain Beneficial Owners and Management and Related Stockholder Matters
ITEM 13. Certain Relationships and Related Transactions, and Director Independence
ITEM 14. Principal Accounting Fees and Services
PART IV
ITEM 15. Exhibits, Financial Statement Schedules Signatures
Part 1
Item 1 - Business
This describes the business of the company: who and what the company does, what subsidiaries it owns, and what markets it operates in. It may also include recent events, competition, regulations, and labor issues. (Some industries are heavily regulated, have complex labor requirements, which have significant effects on the business.) Other topics in this section may include special operating costs, seasonal factors, or insurance matters.
Item 1A - Risk Factors
Here, the company lays out anything that could go wrong, likely external effects, possible future failures to meet obligations, and other risks disclosed to adequately warn investors and potential investors.
[Item 2 - Properties
This section lays out the significant properties, physical assets, of the company. This only includes physical types of property, not intellectual or intangible property.
Item 3 - Legal Proceedings
Here, the company discloses any significant pending law suit or other legal proceeding. References to these proceedings could also be disclosed in the Risks section or other parts of the report.
Item 4 - Mine Safety Disclosures
This section requires some companies to provide information about mine safety violations or other regulatory matters.
Item 5 - Market
Gives high's and low's of stock, in a simple statement. Market for Registrant's Common Equity, related stockholder matters and issuer purchases of equity securities.
Item 6 - Consolidated Financial Data
In this section Financial Data showing consolidated records for the legal entity as well as subsidiary companies.
Item 7 - Management's Discussion and Analysis
Here, management discusses the operations of the company in detail by usually comparing the current period versus prior period. These comparisons provide a reader an overview of the operational issues of what causes such increases or decreases in the business.
Forward Looking Statements
Forward-looking statement is the disclaimer that projections as to future performance are not guaranteed, and things could go otherwise.
Item 8 - Financial Statements
1. Independent Auditor's Report 2. Consolidated Statements of Operation 3. Consolidated Balance Sheets 4. other accounting reports and notes.
Here, also, is the going concern opinion. This is the opinion of the auditor as to the viability of the company. Look for "unqualified opinion" expressed by auditor. This means the auditor had no hesitations or reservations about the state of the company, and the opinion is without any qualifications (unconditional).
Five percent ownership
Five percent ownership refers to companies or individuals who hold at least 5% of the total value of the stock of a public company. They usually are founders of the company or large mutual fund companies, and because of how much stock they own, they usually have access to the board of directors of the company and hold significant sway over the company.
Five percent owners must also file Schedule 13d with the SEC.
Moving Averages - Double Crossovers
Two moving averages can be used together to generate crossover signals. In Technical Analysis of the Financial Markets, John Murphy calls this the "double crossover method". Double crossovers involve one relatively short moving average and one relatively long moving average. As with all moving averages, the general length of the moving average defines the timeframe for the system. A system using a 5-day EMA and 35-day EMA would be deemed short-term. A system using a 50-day SMA and 200-day SMA would be deemed medium-term, perhaps even long-term.
A bullish crossover occurs when the shorter moving average crosses above the longer moving average. This is also known as a golden cross. A bearish crossover occurs when the shorter moving average crosses below the longer moving average. This is known as a dead cross.
Moving average crossovers produce relatively late signals. After all, the system employs two lagging indicators. The longer the moving average periods, the greater the lag in the signals. These signals work great when a good trend takes hold. However, a moving average crossover system will produce lots of whipsaws in the absence of a strong trend.
There is also a triple crossover method that involves three moving averages. Again, a signal is generated when the shortest moving average crosses the two longer moving averages. A simple triple crossover system might involve 5-day, 10-day and 20-day moving averages.

The chart above shows Home Depot (HD) with a 10-day EMA (green dotted line) and 50-day EMA (red line). The black line is the daily close. Using a moving average crossover would have resulted in three whipsaws before catching a good trade. The 10-day EMA broke below the 50-day EMA in late October (1), but this did not last long as the 10-day moved back above in mid November (2). This cross lasted longer, but the next bearish crossover in January (3) occurred near late November price levels, resulting in another whipsaw. This bearish cross did not last long as the 10-day EMA moved back above the 50-day a few days later (4). After three bad signals, the fourth signal foreshadowed a strong move as the stock advanced over 20%.
There are two takeaways here. First, crossovers are prone to whipsaw. A price or time filter can be applied to help prevent whipsaws. Traders might require the crossover to last 3 days before acting or require the 10-day EMA to move above/below the 50-day EMA by a certain amount before acting. Second, MACD can be used to identify and quantify these crossovers. MACD (10,50,1) will show a line representing the difference between the two exponential moving averages. MACD turns positive during a golden cross and negative during a dead cross. The Percentage Price Oscillator (PPO) can be used the same way to show percentage differences. Note that MACD and the PPO are based on exponential moving averages and will not match up with simple moving averages.

This chart shows Oracle (ORCL) with the 50-day EMA, 200-day EMA and MACD(50,200,1). There were four moving average crossovers over a 2 1/2 year period. The first three resulted in whipsaws or bad trades. A sustained trend began with the fourth crossover as ORCL advanced to the mid 20s. Once again, moving average crossovers work great when the trend is strong, but produce losses in the absence of a trend.
Form S-4 ~ SEC Filings Explained
Registration of securities issued in business combination transactions
Exponential Moving Average (EMA)
EMA helps with the lag we get on Simple Moving Averages (SMA) by giving more weight to the more recent price information. The weight given to the most recent price will depend on the number of periods in the moving average. EMA is calculated using 3 steps:
1st - get the SMA by adding the closing prices over the specified period i.e. 5 SMA on a daily chart is the closing price each day over a 5 day period, divided by 5.
2nd - Calculate the weighting multiplier by dividing 2 by the time period 1 and multiplying that answer by 100 to get the percentage i.e. 5 EMA = 2/(5 1) = 0.3333 X 100 = 33.33%
3rd - Calculate the EMA using the % that applies to the time period you are using. Here is the formula:
EMA: {Close - EMA(previous day)} x multiplier EMA(previous day).
Your head may be hurting right now, don't worry most trading platforms will calculate the EMA for you. The important thing is that you remember that the lagging we get with SMA is counteracted with the EMA, giving us a stronger trend indicator.
For those of you who are math freaks like myself, below is an example of how to calculate EMA:
A 10-period exponential moving average applies an 18.18% weighting to the most recent price. A 10-period EMA can also be called an 18.18% EMA. A 20-period EMA applies a 9.52% weighing to the most recent price (2/(20 1) = .0952). Notice that the weighting for the shorter time period is more than the weighting for the longer time period. In fact, the weighting drops by half every time the moving average period doubles.
Below is a spreadsheet example of a 10-day simple moving average and a 10-day exponential moving average for Intel. Simple moving averages are straight forward and require little explanation. The 10-day average simply moves as new prices become available and old prices drop off. The exponential moving average starts with the simple moving average value (22.22) in the first calculation. After the first calculation, the normal formula takes over. Because an EMA begins with a simple moving average, its true value will not be realized until 20 or so periods later. In other words, the value on the excel spreadsheet may differ from the chart value because of the short look-back period. This spreadsheet only goes back 30 periods, which means the affect of the simple moving average has had 20 periods to dissipate.

Below is an example of a chart with both the SMA
Simple Moving Average or (SMA)
The SMA does not predict the price direction but it smooths out the price action to give a trend indication.
Moving averages are lagging indicators because they are based on past prices. Despite this lag, moving averages help smooth price action and filter out the noise. They are also used to form the building blocks for many other technical indicators and overlays, such as Bollinger Bands, MACD and the McClellan Oscillator. Moving averages can be used to identify the direction of the trend or define potential support and resistance levels.
Here's a chart with a 5 day SMA on it:
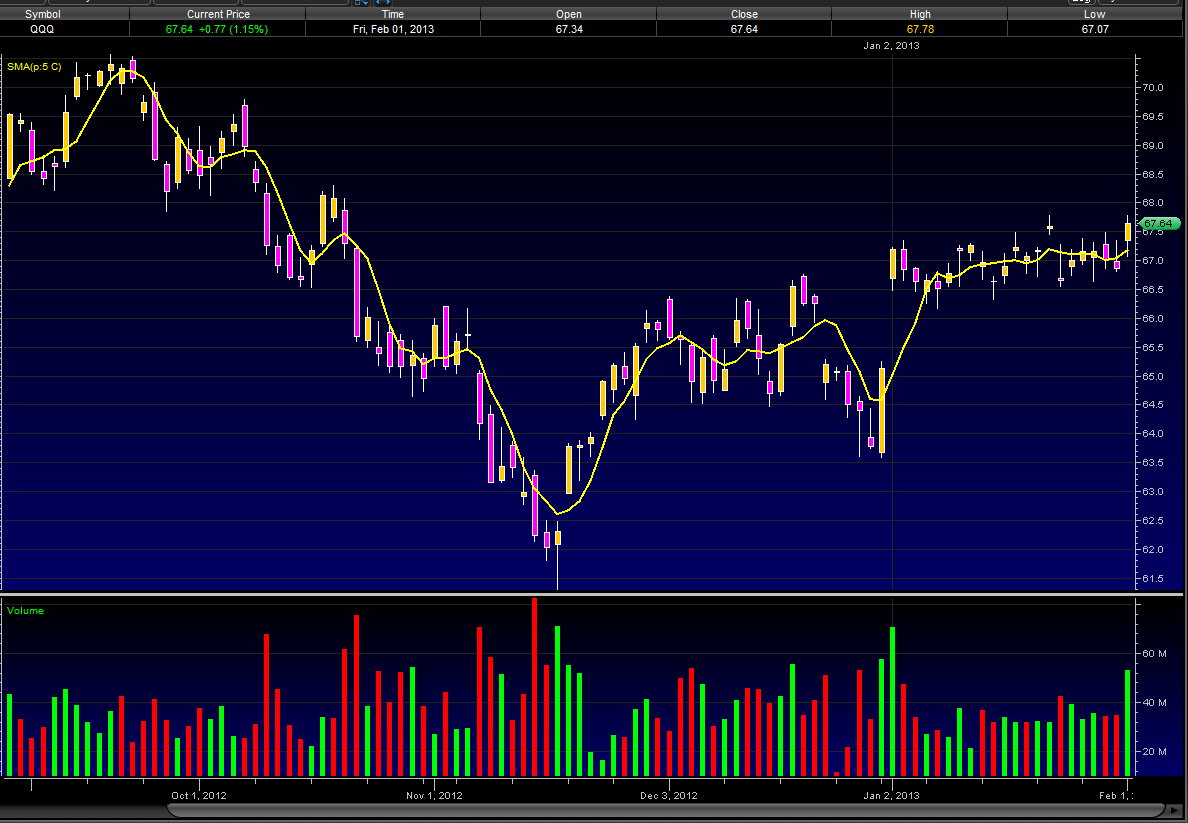
A simple moving average is made by calculating the average price of a security over a specific number of closing costs. The SMA will reflect the average closing cost, based on the time line of the chart you are looking at. i.e.: A 5 SMA on a daily chart will plot a line showing the average closing daily price, on a 60 minute chart that 5 SMA will plot a line showing the average hourly closing price. If the closing price changes so too does the SMA, hence the Moving part of Simple Moving Average. Old data is dropped and new data is added as it comes and goes, making the average move along the timeline. For those who need a visual take a look at how a SMA is plotted.
We will start our SMA on day 5
Daily Closing Prices:
Day 1 ------ 10
Day 2 ------ 12
Day 3 ------ 11
Day 4 ------ 14
Day 5 ------ 13
Day 6 ------ 15
Day 7 ------ 18
Day 8 ------ 19
SMA Plot points:
Day 5 ---- 10 12 11 14 13(closing price each day, 1 through 5) = 60 /5(# of days) = SMA of 12
Day 6 ---- Drop the 10 from day 1 and add the 15 from day 6 = 65 /5 = 13
Day 7 ---- Drop the 12 from day 2 and add 18 from day 7 = 71 /5 = 14.2
Day 8 ---- Drop the 11 from day 3 and add 19 from day 8 = 79 /5 = 15.8
Using Moving Averages to Find Support and Resistance
Moving averages can also act as support in an uptrend and resistance in a downtrend. A short-term uptrend might find support near the 20-day simple moving average, which is also used in Bollinger Bands. A long-term uptrend might find support near the 200-day simple moving average, which is the most popular long-term moving average. If fact, the 200-day moving average may offer support or resistance simply because it is so widely used. It is almost like a self-fulfilling prophecy.

The chart above shows the NY Composite with the 200-day simple moving average from mid 2004 until the end of 2008. The 200-day provided support numerous times during the advance. Once the trend reversed with a double top support break, the 200-day moving average acted as resistance around 9500.
Do not expect exact support and resistance levels from moving averages, especially longer moving averages. Markets are driven by emotion, which makes them prone to overshoots. Instead of exact levels, moving averages can be used to identify support or resistance zones.
Piercing Line
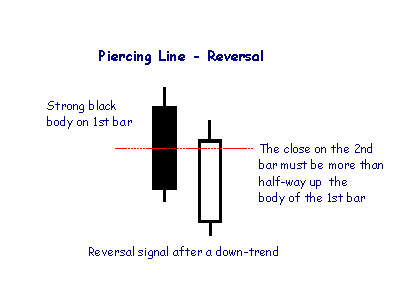
The Piercing Line is the opposite of the Dark Cloud pattern and is a reversal signal if it appears after a down-trend.
Hanging Man
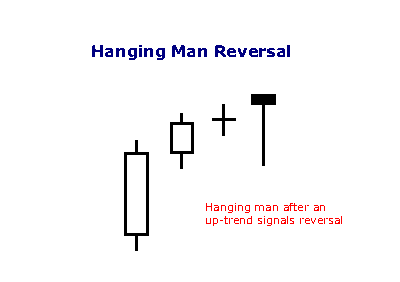
A hammer that occurs after an up trend is called a 'hanging man' and is a bearish signal.
Form N-1A ~ SEC Filings Explained
Initial registration statement for open-end management investment companies
Doji Candlesticks (General)
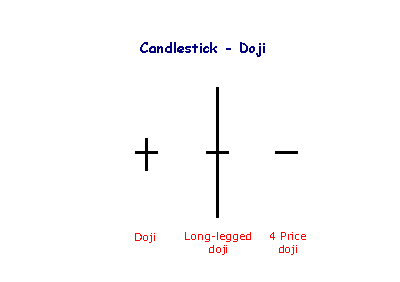
The doji candlestick occurs when the open and closing price are equal.
An open and close in the middle of the candlestick signal indecision. Long-legged dojis, when they occur after small candlesticks, indicate a surge in volatility and warn of a potential trend change. 4 Price dojis, where the high and low are equal, are normally only seen on thinly traded stocks.
Form 15F-15D, 15F-15D/A ~ SEC Filings Explained
Notice of a foreign private issuers suspension of duty to file reports pursuant to Section 13 and 15(d) of the Act (and amendment thereto)
Form 10-D, 10-D/A ~ SEC Filings Explained
Periodic distribution reports by Asset-Backed issuers pursuant to Rule 13a-17 or 15d-17 (and amendment thereto)
Form 13F-NT, 13F-NT/A ~ SEC Filings Explained
Initial Quarterly Form 13F Notice Report filed by institutional managers (and amendment thereto)
Form 13F-HR, 13F-HR/A ~ SEC Filings Explained
Initial Quarterly Form 13F Holdings report filed by institutional managers (and amendment thereto)
Form S-6 ~ SEC Filings Explained
Initial registration statement filed on Form S-6 for unit investment trusts
Parabolic SAR
Introduction
Developed by Welles Wilder, the Parabolic SAR refers to a price and time based trading system. Wilder called this the "Parabolic Time/Price System". SAR stands for "stop and reverse", which is the actual indicator used in the system. SAR trails price as the trend extends over time. The indicator is below prices when prices are rising and above prices when prices are falling. In this regard, the indicator stops and reverses when the price trend reverses and breaks above or below the indicator.
Wilder introduced the Parabolic Time/Price System in his 1978 book, New Concepts in Technical Trading Systems. This book also includes RSI, Average True Range and the Directional Movement Concept (ADX). Despite being developed before the computer age, Wilder's indicators have stood the test of time and remain extremely popular.

Calculation
Calculation of SAR is complex with if/then variables that make it difficult to put in a spreadsheet. These examples will provide a general idea of how SAR is calculated. Because the formulas for rising and falling SAR are different, it is easier to divide the calculation into two parts. The first calculation covers rising SAR and the second covers falling SAR.
Rising SAR
Prior SAR: The SAR value for the previous period.
Extreme Point (EP): The highest high of the current uptrend.
Acceleration Factor (AF): Starting at .02, AF increases by .02 each
time the extreme point makes a new high. AF can reach a maximum
of .20, no matter how long the uptrend extends.
Current SAR = Prior SAR Prior AF(Prior EP - Prior SAR)
13-Apr-10 SAR = 48.28 = 48.13 .14(49.20 - 48.13)
The Acceleration Factor is multiplied by the difference between the
Extreme Point and the prior period's SAR. This is then added to the
prior period's SAR. Note however that SAR can never be above the
prior two periods' lows. Should SAR be above one of those lows, use
the lowest of the two for SAR.


Falling SAR
Prior SAR: The SAR value for the previous period.
Extreme Point (EP): The lowest low of the current downtrend.
Acceleration Factor (AF): Starting at .02, AF increases by .02 each
time the extreme point makes a new low. AF can reach a maximum
of .20, no matter how long the downtrend extends.
Current SAR = Prior SAR - Prior AF(Prior SAR - Prior EP)
9-Feb-10 SAR = 43.56 = 43.84 - .16(43.84 - 42.07)
The Acceleration Factor is multiplied by the difference between the
Prior period's SAR and the Extreme Point. This is then subtracted
from the prior period's SAR. Note however that SAR can never be
below the prior two periods' highs. Should SAR be below one of
those highs, use the highest of the two for SAR.


Interpretation
SAR follows price and can be considered a trend following indicator. Once a downtrend reverses and starts up, SAR follows prices like a trailing stop. The stop continuously rises as long as the uptrend remains in place. In other words, SAR never decreases in an uptrend and continuously protects profits as prices advance. The indicator acts as a guard against the propensity to lower a stop-loss. Once price stops rising and reverses below SAR, a downtrend starts and SAR is above the price. SAR follows prices lower like a trailing stop. The stop continuously falls as long as the downtrend extends. Because SAR never rises in a downtrend, it continuously protects profits on short positions.
Step Increments
The Acceleration Factor (AF), which is also referred to as the Step, dictates SAR sensitivity. SharpCharts users can set the Step and the Maximum Step. As shown in the spreadsheet example, the Step is a multiplier that influences the rate-of-change in SAR. That is why it is referred to as the Acceleration Factor. Step gradually increases as the trend extends until it hits a maximum. SAR sensitivity can be decreased by decreasing the Step. A lower step moves SAR further from price, which makes a reversal less likely.
SAR sensitivity can be increased by increasing the step. A higher step moves SAR closer to the price action, which makes a reversal more likely. The indicator will reverse too often if the step is set too high. This will produce whipsaws and fail to capture the trend. Chart 6 shows IBM with SAR (.01, .20). The step is .01 and the Maximum Step is .20. Chart 7 shows IBM with a higher Step (.03). SAR is more sensitive in chart 7 because there are more reversals. This is because the Step is higher in chart 7 (.03) than chart 6 (.01).


Maximum Step
The sensitivity of the indicator can also be adjusted using the Maximum Step. While the Maximum Step can influence sensitivity, the Step carries more weight because it sets the incremental rate-of-increase as the trend develops. Also note that increasing the Step insures that the Maximum Step will be hit quicker when a trend develops. Chart 8 shows Best Buy (BBY) with a Maximum Step (.10), which is lower than the default setting (.20). This lower Maximum Step decreases the sensitivity of the indicator and produces fewer reversals. Notice how this setting caught a two month downtrend and a subsequent two month uptrend. Chart 9 shows BBY with a higher Maximum Step (.20). This higher reading produced extra reversals in early February and early April.


Conclusions
The Parabolic SAR works best with trending securities, which occur roughly 30% of the time according to Wilder's estimates. This means the indicator will be prone to whipsaws over 50% of the time or when a security is not trending. After all, SAR is designed to catch the trend and follow it like a trailing stop. As with most indicators, the signal quality depends on the settings and the characteristics of the underlying security. The right settings combined with decent trends can produce a great trading system. The wrong settings will result in whipsaws, losses and frustration. There is no golden rule or one-size-fits-all setting. Each security should be evaluated based on its own characteristics. Parabolic SAR should also be used in conjunction with other indicators and technical analysis techniques. For example, Wilder's Average Directional Index can be used to estimate the strength of the trend before considering signals.
Scans
Break above falling SAR: This scan starts with stocks that have an average price of $10 or greater over the last three months and average volume greater than 40,000. The scan then filters for stocks that have a bullish SAR reversal (Parabolic SAR (.01,.20)). This scan is just meant as a starter for further refinement.
Break below rising SAR: This scans starts with stocks that have an average price of $10 or greater over the last three months and average volume greater than 40,000. The scan then filters for stocks that have a bearish SAR reversal (Parabolic SAR (.01,.20)). This scan is just meant as a starter for further refinement.
Inverse ETF’s
An inverse exchange-traded fund is an exchange-traded fund (ETF), traded on a public stock market, which is designed to perform as the inverse of whatever index or benchmark it is designed to track. These funds work by using short selling, tradingderivatives such as futures contracts, and other leveraged investment techniques.
By providing, over short investing horizons and excluding the impact of fees and other costs, performance opposite to their benchmark, inverse ETFs give a result similar to short selling the stocks in the index. An inverse S
WHITE SPINNING TOP
The White Spinning Top is a single candlestick pattern. Its shape is a small white body with upper and lower shadows that have a greater length than the body's length.
Recognition Criteria:
1. The real body of the pattern is white and small.
2. The upper and lower shadows are longer than the real body's length.
Explanation:
The market moves higher and then sharply lower, or vice versa. It then closes above the opening price creating a white body. This represents complete indecision between the bulls and the bears. The actual length of the shadows is not important. The small body relative to the shadows is what makes the spinning top.
Important Factors:
If a White Spinning Top is observed after a long rally or a long white candlestick, this implies weakness among the bulls and it is a warning about a potential change or interruption in trend.
If a White Spinning Top is observed after a long decline or a long black candlestick, this implies weakness among the bears and it is a warning about a potential change or interruption in trend.
Like most other single candlestick patterns, the White Spinning Top has low reliability. It reflects only one day's trading and can be interpreted both as a continuation and a reversal pattern. This candlestick needs to be used with other candlesticks for a healthier confirmation of a trend.
Form 8-K~ SEC Filings Explained
Form 8-K is a very broad form used to notify investors of any material event that is important to shareholders or the United States Securities and Exchange Commission. This is one of the most common types of forms filed with the SEC. After a significant event like bankruptcy or departure of a CEO, a public company generally must file a Current Report on Form 8-K within four business days to provide an update to previously filed quarterly reports on Form 10-Qand/or Annual Reports on Form 10-K. Form 8-K is required to be filed by public companies with the SEC pursuant to the Securities Exchange Act of 1934, as amended. For a list of events that would trigger a Form 8-K to be filed, see the Official SEC Form 8-K Summary, reproduced below.
When Form 8-K is required
Form 8-K is used to notify investors of a current event. These types of events include:
? Material definitive agreements not made in the ordinary course of business
? Bankruptcies or receiverships
? Director is elected
? Director departs
? If a director departs because of a disagreement with the company on any matter relating to the registrant’s operations, policies, or practices then an 8-K must be filed to disclose a brief description of the circumstances representing the disagreement.[1]
? Asset movement: acquisition or sale
? Result of operations and financial condition
? Material Direct Financial obligations (bonds, debentures)
? Triggering events that accelerate material obligations (defaults on a loan)
? Exit or disposal plans
? Layoffs
? shutting down a plant
? material change in services or outlets
? Material impairments
? Delisting or transfer exchange notices
? Unregistered equity sales
? Modifications to shareholder rights
? Change in accountant - and good idea to explain why
? SEC investigations and internal reviews
? Financial non-reliance notices
? Changes in control of the company
? Someone takes a large equity position (more than 15%); shareholder also needs to file with SEC as to intent
? Someone takes a 51% position
? Changes in executive management
? Officer leaves
? Officer is fired
? Officer is hired
? Departure or appointment of company officers
? Amendments to company Governance Policies
? Code of Ethics
? Board Committee Governance Policies
? Trading suspension
? Change in credit
? Change in company status
? Other events
? Financial exhibits
Investors should always read any 8-K filings that are made by companies in which they are invested. These reports are both material and relevant to the company, and often contain information that will affect the share price.
Reading Form 8K
Typically an 8-K filing will only have two major parts. They are:
? The name and description of the event - this contains all the information that the company considers relevant to shareholders and the SEC. It is important to read this information, as it has been deemed "material" by the company.
? Any exhibits that are relevant - these exhibits may include financial statements, press releases, data tables, or other information that is referenced in the description of the event.
Definitions For The Fifth Letter Of Ticker Symbols
Have you ever wondered what that fifth letter at the end of the stock symbol is? It signifies that the issuer may have additional circumstances involved with the stock. Most recognizable is the infamous "E".
Complete "Letter" list enclosed below. You may want to print it out for your own reference.
The Eligibility Rule protects investors by ensuring that they have access to companies current financial information when considering investments in OTCBB-eligible securities.
Nasdaq will continue to monitor the filing status of all OTCBB issuers. In the event of a filing delinquency, Nasdaq will append the trading symbol(s) of the delinquent issuer's security with an "E". The fifth character "E" will be removed from the symbol once Nasdaq receives notification that the security meets the requirements of the Eligibility Rule. After 30 days (60 days for non-SEC filers), if Nasdaq has not been notified that the appropriate filing has been made with the issuer's regulatory authority, the issuer's security will be removed from the OTCBB.
Code: Meaning
A: Class A.
B: Class B.
C: Exempt from Nasdaq listing requirements for a limited period of time.
D: A new issue of an existing stock. (Often the result of a reverse split.)
E: Delinquent in required filings with the SEC as determined by the NASD.
F: Foreign.
G: First Convertible Bond.
H: Second Convertible Bond, same company.
I: Third Convertible Bond, same company.
J: Voting.
K Non-voting.
L: Miscellaneous situations such as foreign preferred, preferred when-issued, a second class of units, a third class of warrants, or a sixth class of preferred stock.
M: Fourth preferred, same company.
N: Third preferred, same company.
O: Second preferred, same company.
P: First preferred.
Q: In bankruptcy proceedings.
R: Rights.
S: Beneficial interest.
T: With warrants or with rights.
U: Units.
V: When-issued and when-distributed.
W: Warrants.
X: Mutual Fund.
Y: ADR (American Depositary Receipts).
Z: Miscellaneous situations such as a second class of warrants, a fifth class of preferred stock, a stub, a foreign preferred when-issued, or any unit, receipt, or certificate representing a limited partnership interest."
CONCEALING BABY SWALLOW
This Bullish pattern is highlighted by two consecutive Black Marubozu. They are characterized by the fact that a gapping black candlestick trades into the body of the previous day and it is seen during a downtrend. Then there is another Black Marubozu on the third day showing sale of positions since it closes at a new low. However this may give incentive to the shorts to cover their positions implying that a bullish reversal is now possible.

Recognition Criteria:
1. Market is characterized by downtrend.
2. We see two consecutive Black Marubozu in the first and second days.
3. Then we see a black candlestick on the third day opening with a downward gap but trading into the body of the second day and it is characterized by a long upper shadow.
4. Finally we see another Black Marubozu on the fourth day that completely engulfs the candlestick of the third day including the shadow.
Explanation:
Two black Marubozu show that downtrend is continuing to the satisfaction of the bears. On the third day, we see a downward gap further confirming the downtrend. However, prices on the third day start going above the close of the previous day causing some doubts about the bearish direction even though the day closes at or near its low. The next day shows us a significantly higher gap in the opening. After the opening, however, prices again go down closing at a new low. This last day may be interpreted as a good chance for the short-sellers to cover their short positions.
Form N-23C-2 ~ SEC Filings Explained
Notice by closed-end investment companies of intention to call or redeem their own securities
BLACK SPINNING TOP
The Black Spinning Top is a single candlestick pattern. Its shape is a small black body with upper and lower shadows having a greater length than the body's length.
Recognition Criteria:
1. The real body of the pattern is black and small.
2. The upper and lower shadows are longer than the real body's length.
Explanation:
The market moves higher and then sharply lower, or vice versa. It then closes below the opening price creating a black body. This represents complete indecision between the bulls and the bears. The actual length of the shadows is not important. The small body relative to the shadows is what makes the spinning top.
Important Factors:
If a Black Spinning Top is observed after a long rally or long white candlestick, this implies weakness among the bulls and it is a warning about a potential change or interruption in trend.
If a Black Spinning Top is observed after a long decline or a long black candlestick, this implies weakness among the bears and it is a warning about a potential change or interruption in trend.
Like most other single candlestick patterns, the Black Spinning Top has low reliability. It reflects only one day's trading and can be interpreted both as a continuation and a reversal pattern. This pattern must be used with other candlesticks for a better and healthier confirmation of a trend.
Keltner Channels
Introduction
Keltner Channels are volatility-based envelopes set above and below an exponential moving average. This indicator is similar to Bollinger Bands, which use the standard deviation to set the bands. Instead of using the standard deviation, Keltner Channels use the Average True Range (ATR) to set channel distance. The channels are typically set two Average True Range values above and below the 20-day EMA. The exponential moving average dictates direction and the Average True Range sets channel width. Keltner Channels are a trend following indicator used to identify reversals with channel breakouts and channel direction. Channels can also be used to identify overbought and oversold levels when the trend is flat.
In his 1960 book, How to Make Money in Commodities, Chester Keltner introduced the "Ten-Day Moving Average Trading Rule," which is credited as the original version of Keltner Channels. This original version started with a 10-day SMA of the typical price {(H L C)/3)} as the centerline. The 10-day SMA of the High-Low range was added and subtracted to set the upper and lower channel lines. Linda Bradford Raschke introduced the newer version of Keltner Channels in the 1980s. Like Bollinger Bands, this new version used a volatility based indicator, Average True Range (ATR), to set channel width. StockCharts.com uses this newer version of Keltner Channels.
Calculation
There are three steps to calculating Keltner Channels. First, select the length for the exponential moving average. Second, choose the time periods for the Average True Range (ATR). Third, choose the multiplier for the Average True Range.
Middle Line: 20-day exponential moving average
Upper Channel Line: 20-day EMA (2 x ATR(10))
Lower Channel Line: 20-day EMA - (2 x ATR(10)
Because moving averages lag price, a longer moving average will have more lag and a shorter moving average will have less lag. ATR is the basic volatility setting. Short timeframes, such as 10, produce a more volatile ATR that fluctuates as 10-period volatility ebbs and flows. Longer timeframes, such a 100, smooth these fluctuations to produce a more constant ATR reading. The multiplier has the most affect on the channel width. Simply changing from 2 to 1 will cut channel width in half. Increasing from 2 to 3 will increase channel width by 50%.

The chart above shows the default Keltner Channels in red, a wider channel in blue and a narrower channel in green. The blue channels were set three Average True Range values above and below (3 x ATR). The green channels used one ATR value. All three share the 20-day EMA, which is the dotted line in the middle. The indicator windows show differences in the Average True Range (ATR) for 10 periods, 50 periods and 100 periods. Notice how the short ATR (10) is more volatile and has the widest range. In contrast, 100-period ATR is much smoother with a less volatile range.
Interpretation
Indicators based on channels, bands and envelopes are designed to encompass most price action. Therefore, moves above or below the channel lines warrant attention because they are relatively rare. Trends often start with strong moves in one direction or another. A surge above the upper channel line shows extraordinary strength, while a plunge below the lower channel line shows extraordinary weakness. Such strong moves can signal the end of one trend and the beginning of another.
With an exponential moving average as its foundation, Keltner Channels are a trend following indicator. As with moving averages and trend following indicators, Keltner Channels lag price action. The direction of the moving average dictates the direction of the channel. In general, a downtrend is present when the channel moves lower, while an uptrend exists when the channel moves higher. The trend is flat when the channel moves sideways.
A channel upturn and break above the upper trendline can signal the start of an uptrend. A channel downturn and break below the lower trendline can signal the start a downtrend. Sometimes a strong trend does not take hold after a channel breakout and prices oscillate between the channel lines. Such trading ranges are marked by a relatively flat moving average. The channel boundaries can then be used to identify overbought and oversold levels for trading purposes.
Versus Bollinger Bands
There are two differences between Keltner Channels and Bollinger Bands. First, Keltner Channels are smoother than Bollinger Bands because the width of the Bollinger Bands is based on the standard deviation, which is more volatile than the Average True Range (ATR). Many consider this a plus because it creates a more constant width. This makes Keltner Channels well suited for trend following and trend identification. Second, Keltner Channels also use an exponential moving average, which is more sensitive than the simple moving average used in Bollinger Bands. The chart below shows Keltner Channels (blue), Bollinger Bands (pink), Average True Range (10), Standard Deviation (10) and Standard Deviation (20) for comparison. Notice how the Keltner Channels are smoother than the Bollinger Bands. Also notice how the Standard Deviation covers a larger range than the Average True Range (ATR).

Uptrend
The chart below shows Archer Daniels Midland (ADM) starting an uptrend as the Keltner Channels turn up and the stock surges above the upper channel line. ADM was in a clear downtrend in April-May as prices continued to pierce the lower channel. With a strong thrust up in June, prices exceeded the upper channel and the channel turned up to start a new uptrend. Notice that prices held above the lower channel on dips in early and late July.

Even with a new uptrend established, it is often prudent to wait for a pullback or better entry point to improve the reward-to-risk ratio. Momentum oscillators or other indicators can then be employed to define oversold readings. This chart shows StochRSI, one of the more sensitive momentum oscillators, dipping below .20 to become oversold at least three times during the uptrend. The subsequent crosses back above .20 signaled a resumption of the uptrend.
Downtrend
The second chart shows Nvidia (NVDA) starting a downtrend with a sharp decline below the lower channel line. After this initial break, the stock met resistance near the 20-day EMA (middle line) from mid May until early August. The inability to even come close to the upper channel line showed strong downside pressure.

A 10-period Commodity Channel Index (CCI) is shown as the momentum oscillator to identify short-term overbought conditions. A move above 100 is considered overbought. A subsequent move back below 100 signals a resumption of the downtrend. This signal worked well until September. These failed signals indicated a possible trend change that was subsequently confirmed with a break above the upper channel line.
Flat Trend
Once a trading range or flat trading environment has been identified, traders can use the Keltner Channels to identify overbought and oversold levels. A trading range can be identified with a flat moving average and the Average Directional Index (ADX). The chart below shows IBM fluctuating between support in the 120-122 area and resistance in the 130-132 area from February to late September. The 20-day EMA, middle line, lagged price action, but flattened out from April to September.
The indicator window shows ADX (black line) confirming a weak trend. Low and falling ADX shows a weak trend. High and rising ADX shows a strong trend. ADX was below 40 the entire time and below 30 most of the time. This reflects the absence of trend. Also, notice that ADX peaked in early June and fell until late August.

Armed with the prospects of a weak trend and trading range, traders can use Keltner Channels to anticipate reversals. In addition, notice that the channel lines often coincide with chart support and resistance. IBM dipped below the lower channel line three times from late May until late August. These dips provided low-risk entry points. The stock did not manage to reach the upper channel line, but did get close as it reversed in the resistance zone. The Disney chart shows a similar situation.

Conclusions
Keltner Channels are a trend following indicator designed to identify the underlying trend. Trend identification is more than half the battle. The trend can be up, down or flat. Using the methods described above, traders and investors can identify the trend to establish a trading preference. Bullish trades are favored in an uptrend and bearish trades are favored in a downtrend. A flat trend requires a more nimble approach because prices often peak at the upper channel line and trough at the lower channel line. As with all analysis techniques, Keltner Channels should be used in conjunction with other indicators and analysis. Momentum indicators offer a good complement to the trend-following Keltner Channels.
Pivot Points ~ Time Frames
Pivot Points for 1, 5, 10 and 15 minute charts use the prior day's high, low and close. In other words, Pivot Points for today's intraday charts would be based solely on yesterday's high, low and close. Once Pivot Points are set, they do not change and remain in play throughout the day.

Pivot Points for 30 and 60 minute charts use the prior week's high, low and close. These calculations are based on calendar weeks. Once the week starts, the Pivot Points for 30 and 60 minute charts remain fixed for the entire week. They do not change until the week ends and new Pivots can be calculated.

Pivot Points for daily charts use the prior month's data. Pivot Points for June 1st would be based on the high, low and close for May. They remain fixed the entire month of June. New Pivot Points would be calculated on the first trading day of July. These would be based on the high, low and close for June.

Pivot Points for weekly and monthly charts use the prior year's data.
Standard Pivot Points
Standard Pivot Points begin with a base Pivot Point. This is a simple average of the high, low and close. The middle Pivot Point is shown as a solid line between the support and resistance pivots. Keep in mind that the high, low and close are all from the prior period.
Pivot Point (P) = (High Low Close)/3
Support 1 (S1) = (P x 2) - High
Support 2 (S2) = P - (High - Low)
Resistance 1 (R1) = (P x 2) - Low
Resistance 2 (R2) = P (High - Low)
The chart below shows the Nasdaq 100 ETF (QQQ) with Standard Pivot points on a 15 minute chart. At the start of trading on June 9th, the Pivot Point is in the middle, the resistance levels are above and the support levels are below. These levels remain constant throughout the day.

Pivot Points ~ Setting the Tone
The Pivot Point sets the general tone for price action. This is the middle line of the group that is marked (P). A move above the Pivot Point is positive and shows strength. Keep in mind that this Pivot Point is based on the prior period's data. It is put forth in the current period as the first important level. A move above the Pivot Point suggests strength with a target to the first resistance. A break above first resistance shows even more strength with a target to the second resistance level.

The converse is true on the downside. A move below the Pivot Point suggests weakness with a target to the first support level. A break below the first support level shows even more weakness with a target to the second support level.
iShares MSCI Emerging Market Index (NYSE:EEM)
This investment attempts to mimic the returns seen in the MSCI Emerging Markets index which was created as an equity benchmark for international security performance. If you would like to gain some international exposure, specifically to emerging markets, this ETF might be for you.
Candlestick Colors
For improved presentation, Incredible Charts uses colors such as red and blue/green to indicate filled or hollow candlesticks:
Blue (or green) candlestick if the close is higher than the open;
Red candlestick if the open is higher than the close (i.e. the candlestick is filled);
The same color as the previous day, if the open is equal to the close.
Simple vs Exponential Moving Averages
Even though there are clear differences between simple moving averages and exponential moving averages, one is not necessarily better than the other. Exponential moving averages have less lag and are therefore more sensitive to recent prices - and recent price changes. Exponential moving averages will turn before simple moving averages. Simple moving averages, on the other hand, represent a true average of prices for the entire time period. As such, simple moving averages may be better suited to identify support or resistance levels.
Moving average preference depends on objectives, analytical style and time horizon. Chartists should experiment with both types of moving averages as well as different timeframes to find the best fit.
Below is an example of a chart with both the SMA
Form TA-W ~ SEC Filings Explained
Notice of withdrawal from registration as transfer agent filed pursuant to the Securities Exchange Act of 1934
Form 20-F, 20-F/A ~ SEC Filings Explained
Annual and transition report of foreign private issuerspursuant to sections 13 or 15(d) (and amendment thereto)
Form N-14 8C ~ SEC Filings Explained
Initial registration statement filed on Form N14 by closed-end investment company (business combinations)
Inverted Hammer

The Inverted Hammer is a type of bullish reversal pattern. As its name implies, the Inverted Hammer looks like an upside down version of the hammer candlestick pattern. Like the hammer candlestick pattern, the Inverted Hammer consists of one candle and when found in a downtrend is considered a potential reversal pattern.
The pattern is made up of a candle with a small lower body and a long upper wick which is at least two times as large as the short lower body. The body of the candle should be at the low end of the trading range and there should be little or no lower wick in the candle.

The long upper wick of the candlestick pattern indicates that the buyers drove prices up at some point during the period in which the candle was formed but encountered selling pressure which drove prices back down for the period to close near to where they opened. As this occurred in an uptrend the selling pressure is seen as a potential reversal sign. When encountering the Inverted Hammer traders will look for a higher open on the next period before considering the pattern confirmed and potentially including it in their trading strategy.
Form T-3 ~ SEC Filings Explained
Initial application for qualification of trust indentures
Form 15F-12G, 15F-12G/A ~ SEC Filings Explained
Notice of termination of a foreign private issuer's registration of a class of securities under Section 12(g) (and amendment thereto)
Dark Cloud
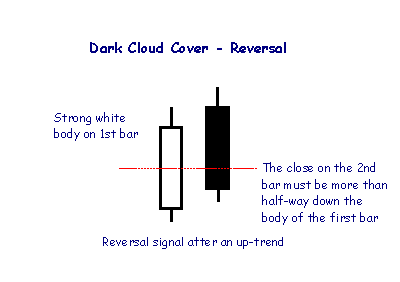
A Dark Cloud pattern encountered after an up-trend is a reversal signal, warning of "rainy days" ahead.
13H, 13H-Q, 13H-A, 13H-I, 13H-R, 13H-T ~ SEC Filings Explained
Large Trader Registration Information Required of Large Traders Pursuant to the Securities Exchange Act of 1934 and Rule 13h-1 Thereunder. Initial Filing (13H), Amended Filing (13H-Q), Annual Filing (13H-A), Inactive Status (13H-I), Reactivated Status (13H-R), and Termination Filing (13H-T)
Dragon Fly Doji usually occurs when a downward change is about to break.

Long Legged Doji indicates a battle between the Bulls and Bears that resulted in a draw. When this happens trend is usually broken from an uptrend to a downturn OR from a downtrend to an upturn.

Form N-4 ~ SEC Filings Explained
Initial registration statement on Form N-4 for separate accounts (unit investment trusts)
Leveraged ETFs
Leveraged exchange-traded funds (LETFs), or simply leveraged ETFs, are a special type of ETF that attempt to achieve returns that are more sensitive to market movements than non-leveraged ETFs.[33] Leveraged index ETFs are often marketed as bull or bear funds. A leveraged bull ETF fund might for example attempt to achieve daily returns that are 2x or 3x more pronounced than the Dow Jones Industrial Average or the S
History of ETF’s
ETFs had their genesis in 1989 with Index Participation Shares, an S
DEF 14A~ SEC Filings Explained
A proxy statement is a statement required of a firm when soliciting shareholder votes. This statement is filed in advance of the annual meeting. The firm needs to file a proxy statement, otherwise known as a Form DEF 14A (Definitive Proxy Statement), with the U.S. Securities and Exchange Commission. This statement is useful in assessing how management is paid and potential conflict-of-interest issues with auditors. The statement includes:
? Voting procedure and information.
? Background information about the company's nominated directors including relevant history in the company or industry, positions on other corporate boards, and potential conflicts in interest.
? Board compensation.
? Executive compensation, including salary, bonus, non-equity compensation, stock awards, options, and deferred compensation. Also, information is included about perks such as personal use of company aircraft, travel, and tax gross-ups. Many companies will also include pre-determined payout packages for if an executive leaves the company.
? Who is on the audit committee, as well as a breakdown of audit and non-audit fees paid to the auditor.
SEC proxy rules: The term "proxy statement" means the statement required by Section 240.14a-3(a) whether or not contained in a single document.
In many cases, shareholder votes - particularly institutional shareholder votes - are determined by proxy firms which advise the shareholders...
Traditionally, broker-dealers have been permitted to vote for "routine" proposals on behalf of their shareholders if the shareholders do not return the proxy statement. This has been controversial, and in 2006 the NYSE Proxy Working Group recommended that the rules be modified so that uncontested director elections were not considered routine.[1] The SEC approved the rule on July 1, 2009.[2]
In July 2010, the SEC announced that it was seeking public comment on the efficiency of the proxy system.[3]
There has been some controversy over "proxy access" which is a method to allow shareholders to nominate candidates which appear on the proxy statement. Currently, only the nominating board can place candidates on the proxy statement. The United States Dodd–Frank Wall Street Reform and Consumer Protection Act specifically allowed the SEC to rule on this issue. In 2010, the SEC passed a rule which allowed certain shareholders to place candidates on the proxy statement,;[4] however, the rule was struck down by the United States Court of Appeals for the District of Columbia Circuit in 2011
Form N-8B-2 ~ SEC Filings Explained
Initial registration statement for unit investment trusts
Direxion Daily Financial Bear 3X Shares (NYSE:FAZ)
Not all ETFs are designed to move in the same direction or even in the same amount as the index they are tracking. For example, this triple bear fund attempts to perform 300% in the opposite direction of the Russell 1000 Financial Services Index. This fund became popular in 2008 and 2009 when the financial crisis placed downward pressure on financial stocks.
Pivot Points ~ Conclusion
Pivot Points offer chartists a methodology to determine price direction and then set support and resistance levels. It usually starts with a cross of the Pivot Point. Sometimes the market starts above or below the Pivot Point. Support and resistance come into play after the crossover. While originally designed for floor traders, the concepts behind Pivot Points can be applied across various timeframes. As with all indicators, it is important to confirm Pivot Point signals with other aspects of technical analysis. A bearish candlestick reversal pattern could confirm a reversal at second resistance. Oversold RSI could confirm oversold conditions at second support. An upturn in MACD could be used to confirm a successful support test. On a final note, sometimes the second or third support/resistance levels are not seen on the chart. This is simply because their levels exceed the price scale on the right. In other words, they are off the chart.
A great reason to consider ETFs is that they simplify index and sector investing in a way that is easy to understand. If you feel a turnaround is around the corner, go long. If, however, you think ominous clouds will be over the market for some time, you have the option of going short.
The combination of the instant diversification, low cost and the flexibility that ETFs offer, makes these instruments one of the most useful innovations and attractive pieces of financial engineering to date.
|
Followers
|
3284
|
Posters
|
|
|
Posts (Today)
|
0
|
Posts (Total)
|
2804248
|
|
Created
|
08/22/10
|
Type
|
Free
|
| Moderator Nilbud | |||
| Assistants mick ManicTrader PhotoChick Kirimi $Pistol Pete$ | |||
   Investor Hub Alerts: Sign up for 'STOCKGOODIES PLAYS OF THE WEEK ' E-Mail List Investor Hub Alerts: Sign up for 'STOCKGOODIES PLAYS OF THE WEEK ' E-Mail ListUPDATE; 5-1-22 courtesy of charting /\ wit tweezer top calls /\ Tony @Montana_Trades Really good study sheet on Candlestick Patterns [-chart]pbs.twimg.com/media/FRn8188XMAAdZvk?format=jpg&name=small[/chart] 

02-07-2021
|
|
Posts Today
|
0
|
|
Posts (Total)
|
2804248
|
|
Posters
|
|
|
Moderator
|
|
|
Assistants
|
| Volume | |
| Day Range: | |
| Bid Price | |
| Ask Price | |
| Last Trade Time: |


