 News
News  Market Data
  Discover

Support: 888-992-3836
Copyright © 2023 InvestorsHub Inc.


Register for free to join our community of investors and share your ideas. You will also get access to streaming quotes, interactive charts, trades, portfolio, live options flow and more tools.
SEC Filings Explained ~ Form 3
Form 3 is an SEC filing filed with the US Securities and Exchange Commission to indicate a preliminary insider transaction by an officer, director, or beneficial (10%) owner of the company's securities. These are typically seen after a company IPOs when insiders make their first transactions. After a Form 3 is filed, future filings of the same nature are filed under Form 4 (standard disclosure) or Form 5 (annual disclosure).

Hanging Man
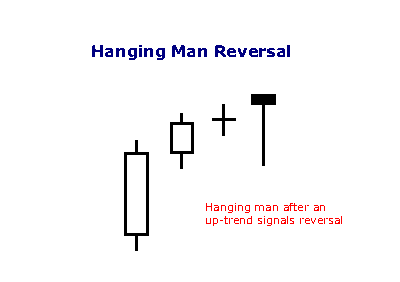
A hammer that occurs after an up trend is called a 'hanging man' and is a bearish signal.
Trading ETF’s
Trading
Perhaps the most important benefit of an ETF is the stock-like features offered. A mutual fund is bought or sold at the end of a day's trading, whereas ETFs can be traded whenever the market is open. Since ETFs trade on the market, investors can carry out the same types of trades that they can with a stock. For instance, investors can sell short, use a limit order, use a stop-loss order, buy on margin, and invest as much or as little money as they wish (there is no minimum investment requirement).[47]Also, many ETFs have the capability for options (puts and calls) to be written against them. Covered call strategies allow investors and traders to potentially increase their returns on their ETF purchases by collecting premiums (the proceeds of a call sale or write) on calls written against them. Mutual funds do not offer those features
Trend Identification Using Moving Averages
The same signals can be generated using simple or exponential moving averages. As noted above, the preference depends on each individual. These examples below will use both simple and exponential moving averages. The term "moving average" applies to both simple and exponential moving averages.
The direction of the moving average conveys important information about prices. A rising moving average shows that prices are generally increasing. A falling moving average indicates that prices, on average, are falling. A rising long-term moving average reflects a long-term uptrend. A falling long-term moving average reflects a long-term downtrend.

The chart above shows 3M (MMM) with a 150-day exponential moving average. This example shows just how well moving averages work when the trend is strong. The 150-day EMA turned down in November 2007 and again in January 2008. Notice that it took a 15% decline to reverse the direction of this moving average. These lagging indicators identify trend reversals as they occur (at best) or after they occur (at worst). MMM continued lower into March 2009 and then surged 40-50%. Notice that the 150-day EMA did not turn up until after this surge. Once it did, however, MMM continued higher the next 12 months. Moving averages work brilliantly in strong trends.
Pivot Points ~ Time Frames
Pivot Points for 1, 5, 10 and 15 minute charts use the prior day's high, low and close. In other words, Pivot Points for today's intraday charts would be based solely on yesterday's high, low and close. Once Pivot Points are set, they do not change and remain in play throughout the day.

Pivot Points for 30 and 60 minute charts use the prior week's high, low and close. These calculations are based on calendar weeks. Once the week starts, the Pivot Points for 30 and 60 minute charts remain fixed for the entire week. They do not change until the week ends and new Pivots can be calculated.

Pivot Points for daily charts use the prior month's data. Pivot Points for June 1st would be based on the high, low and close for May. They remain fixed the entire month of June. New Pivot Points would be calculated on the first trading day of July. These would be based on the high, low and close for June.

Pivot Points for weekly and monthly charts use the prior year's data.
Form 8-K~ SEC Filings Explained
Form 8-K is a very broad form used to notify investors of any material event that is important to shareholders or the United States Securities and Exchange Commission. This is one of the most common types of forms filed with the SEC. After a significant event like bankruptcy or departure of a CEO, a public company generally must file a Current Report on Form 8-K within four business days to provide an update to previously filed quarterly reports on Form 10-Qand/or Annual Reports on Form 10-K. Form 8-K is required to be filed by public companies with the SEC pursuant to the Securities Exchange Act of 1934, as amended. For a list of events that would trigger a Form 8-K to be filed, see the Official SEC Form 8-K Summary, reproduced below.
When Form 8-K is required
Form 8-K is used to notify investors of a current event. These types of events include:
? Material definitive agreements not made in the ordinary course of business
? Bankruptcies or receiverships
? Director is elected
? Director departs
? If a director departs because of a disagreement with the company on any matter relating to the registrant’s operations, policies, or practices then an 8-K must be filed to disclose a brief description of the circumstances representing the disagreement.[1]
? Asset movement: acquisition or sale
? Result of operations and financial condition
? Material Direct Financial obligations (bonds, debentures)
? Triggering events that accelerate material obligations (defaults on a loan)
? Exit or disposal plans
? Layoffs
? shutting down a plant
? material change in services or outlets
? Material impairments
? Delisting or transfer exchange notices
? Unregistered equity sales
? Modifications to shareholder rights
? Change in accountant - and good idea to explain why
? SEC investigations and internal reviews
? Financial non-reliance notices
? Changes in control of the company
? Someone takes a large equity position (more than 15%); shareholder also needs to file with SEC as to intent
? Someone takes a 51% position
? Changes in executive management
? Officer leaves
? Officer is fired
? Officer is hired
? Departure or appointment of company officers
? Amendments to company Governance Policies
? Code of Ethics
? Board Committee Governance Policies
? Trading suspension
? Change in credit
? Change in company status
? Other events
? Financial exhibits
Investors should always read any 8-K filings that are made by companies in which they are invested. These reports are both material and relevant to the company, and often contain information that will affect the share price.
Reading Form 8K
Typically an 8-K filing will only have two major parts. They are:
? The name and description of the event - this contains all the information that the company considers relevant to shareholders and the SEC. It is important to read this information, as it has been deemed "material" by the company.
? Any exhibits that are relevant - these exhibits may include financial statements, press releases, data tables, or other information that is referenced in the description of the event.
Form 11-K, 11-K/A ~ SEC Filings Explained
Annual report of employee stock purchase, savings and similar plans (and amendment thereto)
Form N-2 ~ SEC Filings Explained
Initial filing of a registration statement on Form N-2 for closed-end investment companies
Form 10-12G, 10-12G/A ~ SEC Filings Explained
Initial general form for registration of a class of securities pursuant to section 12(g) (and amendment thereto)
THREE OUTSIDE UP
The Bearish Upside Gap Two Crows Pattern is a three-candlestick pattern and it signals a top reversal. The first candlestick is a long white candlestick followed by a real body that gaps higher. Then another black real body appears, which opens above the second day’s open and closes under the second day’s close, completing the pattern
Recognition Criteria:
1. Market is characterized by downtrend.
2. We see a Bullish Engulfing Pattern in the first two days.
3. The third day is a white candlestick with a higher close than the second day.
Explanation:
The first two days of this three-day pattern is simply a Bullish Engulfing Pattern, and the third day confirms the reversal suggested by the Bullish Engulfing Pattern since it is a white candlestick closing with a new high for the last three days.
Doji Candlesticks (General)
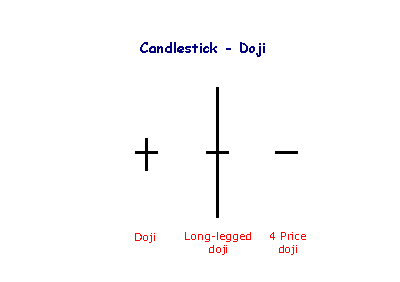
The doji candlestick occurs when the open and closing price are equal.
An open and close in the middle of the candlestick signal indecision. Long-legged dojis, when they occur after small candlesticks, indicate a surge in volatility and warn of a potential trend change. 4 Price dojis, where the high and low are equal, are normally only seen on thinly traded stocks.
Form N-Q ~ SEC Filings Explained
Quarterly Schedule of Portfolio Holdings of Registered Management Investment Company
Form T-3 ~ SEC Filings Explained
Initial application for qualification of trust indentures
Rising Three Methods
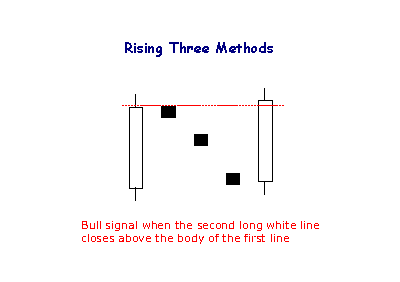
The Rising Method consists of two strong white lines bracketing 3 or 4 small declining black candlesticks. The final white line forms a new closing high. The pattern is definitely bullish.
ARS~ SEC Filings Explained
Annual Report to Security Holders.
Form N-4 ~ SEC Filings Explained
Initial registration statement on Form N-4 for separate accounts (unit investment trusts)
Form S-8 ~ SEC Filings Explained
Initial registration statement for securities to be offered to employees pursuant to employee benefit plans
Form N-30B-2 ~ SEC Filings Explained
Periodic and interim reports mailed to investment company shareholders
BULLISH GRAVESTONE DOJI
Gravestone Doji is a specific Doji with opening and closing prices equal to the low of the day. The Bullish Gravestone Doji Pattern is a bottom reversal pattern. Similar to its cousin the Bullish Inverted Hammer Pattern, it occurs in a downtrend and represents a possible reversal of trend.
Recognition Criteria:
1. Market is characterized by downtrend.
2. We see a black body formed at the lower end of the trading range.
3. We then see a Doji, which does not have a lower shadow in the second day.
4. No gap down is required.
Explanation:
The market opens below the closing price of the previous day. Then there is a brief rally but the rally is not enough to send prices over the closing price of previous day and prices then reverse direction and fall down to the day’s lows. This movement however leaves shorts in a losing position creating the potential for an upcoming rally. It may not be clear why it signals a potential reversal. The answer has to do with what happens over the next session. If the next day opens above the real body of the Gravestone Doji, it means those who shorted at the opening (or closing) of the Gravestone day are losing money. The longer the market holds above Gravestone Doji’s real body the more likely these shorts will cover. The short will then spark a rally by covering their positions, which also encourage the bottom pickers to go long. The Gravestone Doji represents the graves of those bears that have died defending their territory.
Important Factors:
Bullish Gravestone Doji requires further confirmation on the next day. Confirmation may be in the form of the next day opening above the Gravestone Doji’s body. The larger the gap the stronger the confirmation will be. A white candlestick with higher prices can also be another form of confirmation.
SEC Filings Explained ~ Form D
Form D is an SEC Filing form to be used to file a notice of an exempt offering of securities under Regulation D. Commission rules require the notice to be filed by companies and funds that have sold securities without registration under the Securities Act of 1933 in an offering based on a claim of exemption under Rule 504, 505 or 506 of Regulation D or Section 4(6) of that statute. Commission rules further require the notice to be filed within 15 days after the first sale of securities in the offering. For this purpose, the date of first sale is the date on which the first investor is irrevocably contractually committed to invest. If the due date falls on a Saturday, Sunday or holiday, it is moved to the next business day.
Privately held companies that raise capital are required to file a Form D with the SEC to declare exempt offering of securities. Many of these filings show investments in small, growing companies through venture capital and angel investors, as well as certain pooled investment funds.
Tweezer Tops

The Tweezer Top formation is a bearish reversal pattern seen at the top of uptrends.
Tweezer Top formation consists of two candlesticks:
Bullish Candle (Day 1)
Bearish Candle (Day 2)
Sometimes Tweezer Tops have three candlesticks.
A bearish Tweezer Top occurs during an uptrend when bulls take prices higher, often closing the day off near the highs (a bullish sign). However, on the second day, how traders feel (i.e. their sentiment) reverses completely. The market opens and goes straight down, often eliminating the entire gains of Day One.

On Day 1, the bulls were in charge of the Russell 2000 E-mini. On Day 2, however, the bulls began the day trying to make a new high, but were rejected by the overhead resistance created by the prior day's highs. The market then sank quickly only to recover halfway by the end of the close on Day 2. Day 3 opened with a spectacular gap up, but the bulls were promptly rejected by the bears at the now established resistance line. The Russell 2000 E-mini then fell for the rest of the day. Many classic chartists will recognize this triple Tweezer Top as a Double Top formation (see: Double Top).
The Tweezer Top and Bottom reversal pattern is extremely helpful because it visually indicates a transfer of power and sentiment from the bulls and the bears. Of course other technical indicators should be consulted before making a buy or sell signal based on the Tweezer patterns.
Form F-7 ~ SEC Filings Explained
Registration statement for securities of certain Canadian issuers offered for cash upon the exercise of rights granted to existing security holders
Form N-30D ~ SEC Filings Explained
Initial annual and semi-annual reports mailed to investment company shareholders
BEARISH BREAKAWAY
We see this pattern during an uptrend marked with a bullish surge that eventually weakens. This weakening is illustrated by a long black candlestick that is unable to close the gap into the body of the first day. These events warn us about a short-term reversal.
Recognition Criteria:
1. Market is characterized by uptrend.
2. We see a long white candlestick in the first day.
3. Then we see a white candlestick with a gap above the first day on the second day.
4. However the third and fourth days continue in the direction of the second day with higher consecutive closes.
5. Finally we see a long black candlestick on the fifth day with a closing price inside the gap caused by the first and second days.
Explanation:
The Bearish Breakaway Pattern is constituted by a gap in the direction of the uptrend followed by three consecutively higher price days. This shows that the trend has suddenly accelerated with a big gap but then it started to fizzle, however it still manages to move in the same direction. There is evidently a slow deterioration of the trend even though the uptrend continues. Finally, we see a burst in the opposite direction completely recovering the previous three days' price action. A possible reversal is also implied by the fact the gap has not been filled. We are now ready for a short-term reversal.
Important Factors:
A confirmation on the sixth day is recommended in the form of a black candlestick, a large gap down or a lower close to be sure that there is indeed a reversal.
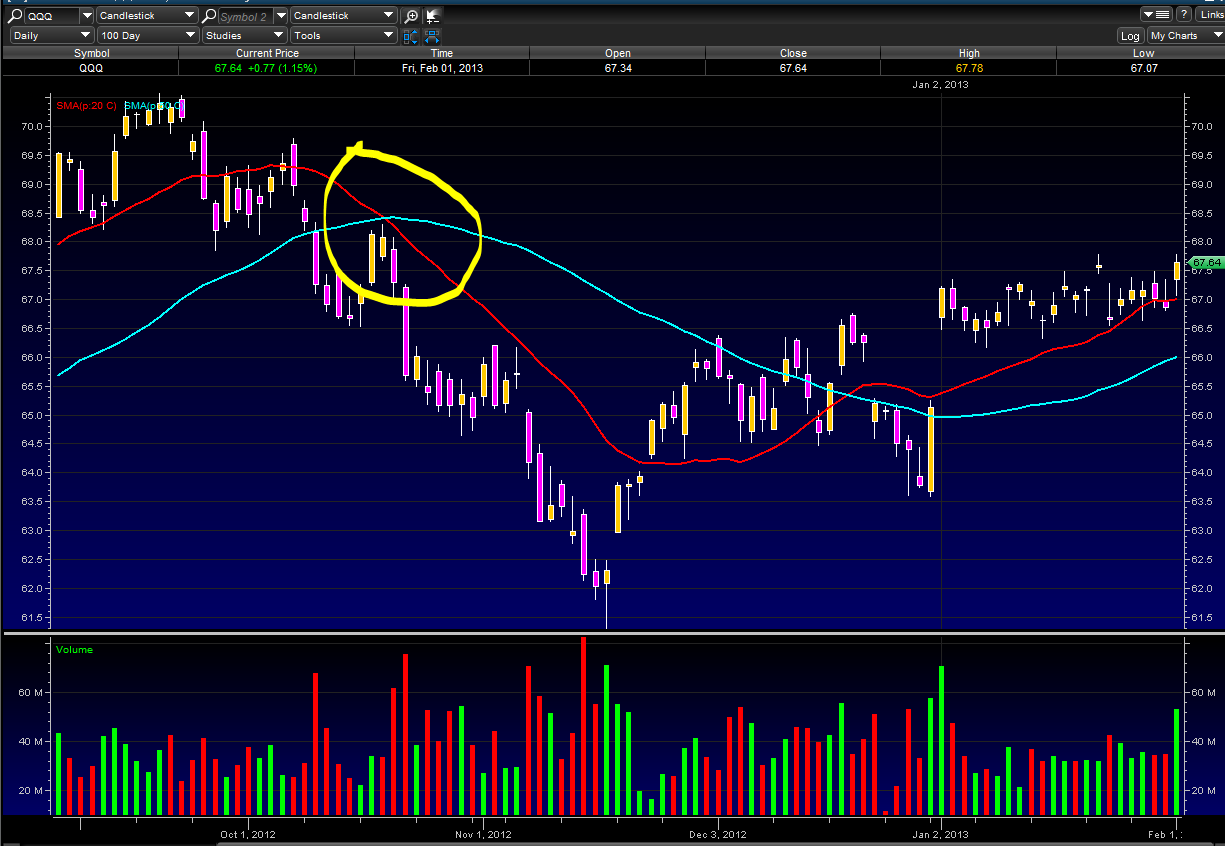
Death Cross
A Death Cross is when a shorter term moving average crosses below a longer term moving average, for example a 20 day SMA crossing under a 50 day SMA. A death cross indicates a bearish trend, especially when it is coupled with higher trading volume. As well as being a trend indicator, the longer term moving average becomes a resistance line as the price rises.
The chart below shows a 20/50 SMA Death cross:
20 SMA is in Red
50 SMA is in Blue
Bollinger Bands aka Bollies
Developed by John Bollinger, Bollinger Bands® are volatility bands placed above and below a moving average. You will find that most of the time stocks will trade within the Bollies. Volatility is based on the standard deviation, which changes as volatility increases and decreases. The bands widen when volatility increases and narrow when volatility decreases. This dynamic nature of Bollinger Bands also means they can be used on different securities with the standard settings.
Note: Bollinger Bands® is a registered trademark of John Bollinger.
Below is a chart showing Bollinger Bands:
Pink line is the Upper Bollie or UBB
Blue line is the Lower Bollie or LBB
White line is the Middle Bollie or 20 SMA
Note how during the down trend the price stayed between the Lower
Form 10-Q~ SEC Filings Explained
Form 10-Q, (also known as a 10-Q or 10Q) is a quarterly report mandated by the United States federalSecurities and Exchange Commission, to be filed by publicly traded corporations.
Pursuant to Section 13 or 15(d) of the Securities Exchange Act of 1934, it's an SEC filing that must be filed quarterly with the US Securities and Exchange Commission. It contains similar information to the annual form 10-K, however the information is generally less detailed, and the financial statements are generally unaudited. Information for the final quarter of a firm's fiscal year is included in the 10-K, so only three 10-Q filings are made each year.
These reports generally compare last quarter to the current quarter and last years quarter to this years quarter. The SEC put this form in place to facilitate better informed investors. The form 10-Q must be filed within 40 days for large accelerated filers and accelerated filers or 45 days after the end of the fiscal quarter for all other registrants (formerly 45 days)
Form N-23C3A ~ SEC Filings Explained
Notification of periodic repurchase offer Filed pursuant to Rule 23c-3(b) only
Taxation on ETF’s
ETFs are structured for tax efficiency and can be more attractive than mutual funds. In the U.S., whenever a mutual fund realizes a capital gain that is not balanced by a realized loss, the mutual fund must distribute the capital gains to its shareholders. This can happen whenever the mutual fund sells portfolio securities, whether to reallocate its investments or to fund shareholder redemptions. These gains are taxable to all shareholders, even those who reinvest the gains distributions in more shares of the fund. In contrast, ETFs are not redeemed by holders (instead, holders simply sell their ETF shares on the stock market, as they would a stock, or effect a non-taxable redemption of a creation unit for portfolio securities), so that investors generally only realize capital gains when they sell their own shares or when the ETF trades to reflect changes in the underlying index.[5]
In most cases, ETFs are more tax-efficient than conventional mutual funds in the same asset classes or categories.[42] Because Vanguard's ETFs are a share-class of their mutual funds, they don't get all the tax advantages if there are net redemptions on the mutual fund shares.[43] Although they do not get all the tax advantages, they get an additional advantage from tax loss harvesting any capital losses from net redemptions.[44][45]
In the U.K., ETFs can be shielded from capital gains tax by placing them in an Individual Savings Account or self-invested personal pension, in the same manner as many other shares. Because UK-resident ETFs would be liable for UK corporation tax on non-UK dividends, most ETFs which hold non-UK companies sold to UK investors are issued in Ireland or Luxembourg
SEC Filings Explained ~ Rule 144
On December 6, 2007, the SEC published final rules revising Rule 144 under the Securities Act of 1933, which regulates the resale of restricted securities and securities held by affiliates. The amendments to Rule 144, among other things:
1. Shorten the holding period for affiliate and non-affiliate holders of restricted securities of SEC-reporting companies to six months, subject to certain conditions
2. Permit unlimited resale by non-affiliate holders of restricted securities by complying only with the current public information condition for resale of restricted securities issued by SEC reporting companies made after the six-month holding period; and without complying with any Rule 144 conditions for resale of restricted securities issued by both SEC reporting and non-reporting companies made after a one-year holding period.
3. permit resale of equity securities by affiliates that meet certain conditions through riskless principal transactions and brokers’ transactions in which the broker has published bid and asked quotations for the security in an alternative trading system.
4. Eliminate the manner of sale conditions and ease the volume limitations for resale of debt securities by affiliates.
5. Increase the thresholds that trigger the Form 144 filing requirement to 5,000 shares or $50,000.
The SEC did not adopt previously proposed provisions relating to the tolling of holding periods in connection with hedging transactions.
The amendments will become effective on February 15, 2008, and will apply to securities acquired before or after that date. Background
Rule 144 regulates the resale of “restricted securities”1 and “control securities,”2 by establishing certain conditions that must be satisfied in order for the resale to be exempt from the Securities Act registration requirements pursuant to Section 4(1) of the Securities Act—a safe harbor from “underwriter” status for the selling security holder.
The conditions include the following:
? There must be adequate current public information available about the issuer;
? If the securities being sold are restricted securities, the security holder must have held the security for a specified holding period;
? The resale must be within specified sales volume limitations;
? The resale must comply with the manner of sale requirements of the rule; and
? The selling security holder must file Form 144 with the SEC if the amount of securities being sold exceeds specified thresholds.
Amendments to Conditions for Resale of Restricted Securities
Restricted Securities of SEC-Reporting Companies. The SEC has reduced the holding period under Rule 144 for restricted securities of SEC-reporting companies held by both affiliates and non-affiliates from one year to six months. Affiliate holders of reporting company securities may now resell their restricted securities after six months, subject to the other Rule 144 requirements. Non-affiliate holders of reporting company securities (who have also not been affiliates during the prior three months) may now resell their restricted securities held between six months and one year subject only to Rule 144’s current public information requirement. Any such resale by a non-affiliate after one year will be exempt from all Rule 144 requirements.
Restricted Securities of Non-Reporting Companies. There is still a one-year holding period for affiliate and non-affiliate holders of restricted securities in non-reporting companies under amended Rule 144. After the one-year holding period, non-affiliates may now resell their restricted securities without having to comply with any other Rule 144 requirements; affiliates seeking to resell their restricted securities must still meet all Rule 144 requirements.
The manner of sale requirements of Rule 144 require securities to be sold in “brokers’ transactions” or in transactions directly with a “market maker.”
The rule includes restrictions on (1) soliciting or arranging for the solicitation of orders to buy the securities in anticipation of, or in connection with, the Rule 144 transaction or (2) making any payment in connection with the offer or sale of the securities to any person other than the broker who executes the order to sell the securities.
The SEC amended these rules to also permit the resale of restricted equity securities by affiliates through riskless principal transactions in which trades are executed at the same price, exclusive of any explicitly disclosed markup or markdown, commission equivalent or other fee, and the rules for a self-regulatory organization permit the transaction to be reported as riskless.3 The amended rule also expands the definition of a “brokers’ transaction” for purposes of such resale by permitting a broker to insert bid and ask quotations for the security in an alternative trading system, provided that the broker has published bona fide bid and ask quotations for such security on each of the last 12 business days. Resale of Restricted Debt Securities The SEC has eliminated the manner-of-sale requirements for affiliate resale of debt securities, including non-participatory preferred stock (which has debt-like characteristics) and asset-backed securities. The SEC also raised the volume limitations for the resale of debt securities to permit resale in an amount that does not exceed ten percent of a tranche (or a class with respect to non-participatory preferred stock), together with all sales of securities of the same tranche sold for the selling debt security holder within a three-month period. Form 144 Filing Triggers
The sales thresholds for filing Form 144 have been increased from 500 shares or $10,000 worth of securities to 5,000 shares or $50,000. Codified
SEC Staff Interpretations
The SEC has also codified various staff interpretations relating to Rule 144, including the following:
1. Stating that securities acquired by accredited investors pursuant to Section 4(6) of the Securities Act are considered restricted securities
2. Permitting tacking of holding periods when a company reorganizes into a holding company structure
3. Permitting tacking of holding periods for conversions and exchanges of securities
4. Deeming the acquisition dates for securities acquired pursuant to the cashless exercise of options and warrants as the dates the options or warrants were acquired
5. Permitting a pledgee of restricted securities to sell the pledged securities without having to aggregate the sale with sales by other pledgees from the same pledgor (as long as there is no concerted action by those pledgees), for purposes of the Rule 144 volume limitation condition
6. Permitting the Form 144 representations required from security holders relying on Exchange Act Rule 10b5-1 to be made as of the date the holder adopted a trading plan or gave trading instructions
7. Confirming the unavailability of Rule 144 for the resale of securities by reporting and non-reporting firms
ETFs offer public investors an undivided interest in a pool of securities and other assets and thus are similar in many ways to traditional mutual funds, except that shares in an ETF can be bought and sold throughout the day like stocks on a securities exchange through a broker-dealer. Unlike traditional mutual funds, ETFs do not sell or redeem their individual shares at net asset value, or NAV. Instead, financial institutions purchase and redeem ETF shares directly from the ETF, but only in large blocks, varying in size by ETF from 25,000 to 200,000 shares, called "creation units". Purchases and redemptions of the creation units generally are in kind, with the institutional investor contributing or receiving a basket of securities of the same type and proportion held by the ETF, although some ETFs may require or permit a purchasing or redeeming shareholder to substitute cash for some or all of the securities in the basket of assets.[4]
The ability to purchase and redeem creation units gives ETFs an arbitrage mechanism intended to minimize the potential deviation between the market price and the net asset value of ETF shares. Existing ETFs have transparent portfolios, so institutional investors will know exactly what portfolio assets they must assemble if they wish to purchase a creation unit, and the exchange disseminates the updated net asset value of the shares throughout the trading day, typically at 15-second intervals.[4]
If there is strong investor demand for an ETF, its share price will (temporarily) rise above its net asset value per share, giving arbitrageurs an incentive to purchase additional creation units from the ETF and sell the component ETF shares in the open market. The additional supply of ETF shares reduces the market price per share, generally eliminating the premium over net asset value. A similar process applies when there is weak demand for an ETF and its shares trade at a discount from net asset value.
In the United States, most ETFs are structured as open-end management investment companies (the same structure used by mutual funds and money market funds), although a few ETFs, including some of the largest ones, are structured as unit investment trusts. ETFs structured as open-end funds have greater flexibility in constructing a portfolio and are not prohibited from participating in securities lending programs or from using futures and options in achieving their investment objectives.[5]
Under existing regulations, a new ETF must receive an order from the Securities and Exchange Commission, or SEC, giving it relief from provisions of the Investment Company Act of 1940 that would not otherwise allow the ETF structure. In 2008, however, the SEC proposed rules that would allow the creation of ETFs without the need for exemptive orders. Under the SEC proposal, an ETF would be defined as a registered open-end management investment company that:
? Issues (or redeems) creation units in exchange for the deposit (or delivery) of basket assets the current value of which is disseminated per share by a national securities exchange at regular intervals during the trading day;
? Identifies itself as an ETF in any sales literature;
? Issues shares that are approved for listing and trading on a securities exchange;
? Discloses each business day on its publicly available web site the prior business day's net asset value and closing market price of the fund's shares, and the premium or discount of the closing market price against the net asset value of the fund's shares as a percentage of net asset value; and
? Either is an index fund, or discloses each business day on its publicly available web site the identities and weighting of the component securities and other assets held by the fund.[4]
The SEC rule proposal would allow ETFs either to be index funds or to be fully transparent actively managed funds. Historically, all ETFs in the United States have been index funds. In 2008, however, the SEC began issuing exemptive orders to fully transparent actively managed ETFs. The first such order was to PowerShares Actively Managed Exchange-Traded Fund Trust,[6] and the first actively managed ETF in the United States was the Bear Stearns Current Yield Fund, a short-term income fund that began trading on the American Stock Exchange under the symbol YYY on 25 March 2008.[7] The SEC rule proposal indicates that the SEC may still consider future applications for exemptive orders for actively managed ETFs that do not satisfy the proposed rule's transparency requirements.[4]
Some ETFs invest primarily in commodities or commodity-based instruments, such as crude oil and precious metals. Although these commodity ETFs are similar in practice to ETFs that invest in securities, they are not "investment companies" under the Investment Company Act of 1940.[4]
Publicly traded grantor trusts, such as Merrill Lynch's HOLDRs securities, are sometimes considered to be ETFs, although they lack many of the characteristics of other ETFs. Investors in a grantor trust have a direct interest in the underlying basket of securities, which does not change except to reflect corporate actions such as stock splits and mergers. Funds of this type are not "investment companies" under the Investment Company Act of 1940.[8]
As of 2009, there were approximately 1,500 exchange-traded funds traded on US exchanges.[9] This count uses the wider definition of ETF, including HOLDRs and closed-end funds.
Form TA-W ~ SEC Filings Explained
Notice of withdrawal from registration as transfer agent filed pursuant to the Securities Exchange Act of 1934
Standard Pivot Points
Standard Pivot Points begin with a base Pivot Point. This is a simple average of the high, low and close. The middle Pivot Point is shown as a solid line between the support and resistance pivots. Keep in mind that the high, low and close are all from the prior period.
Pivot Point (P) = (High Low Close)/3
Support 1 (S1) = (P x 2) - High
Support 2 (S2) = P - (High - Low)
Resistance 1 (R1) = (P x 2) - Low
Resistance 2 (R2) = P (High - Low)
The chart below shows the Nasdaq 100 ETF (QQQ) with Standard Pivot points on a 15 minute chart. At the start of trading on June 9th, the Pivot Point is in the middle, the resistance levels are above and the support levels are below. These levels remain constant throughout the day.

MORNING STAR
This is a three-candlestick formation that signals a major bottom. It is composed of a first long black body, a second small real body, white or black, gapping lower to form a star. These two candlesticks define a basic star pattern. The third is a white candlestick that closes well into the first session’s black real body. Third candlestick shows that the market turned bullish now.

Recognition Criteria:
1. Market is characterized by downtrend.
2. We see a long black candlestick in the first day.
3. Then we see a small body on the second day gapping in the direction of the previous downtrend.
4. Finally we see a white candlestick on the third day.
Explanation:
We see the black body in a falling market suggesting that the bears are in command. Then a small real body appears implying the incapacity of sellers to drive the market lower. The strong white body of third day proves that bulls have taken over. An ideal Bullish Morning Star Pattern preferably has a gap before and after the middle candlestick. The second gap is rare, but lack of it does not take away from the power of this formation.
Important Factors:
The stars may be more than one, two or even three.
The color of the star and its gaps are not important.
Form N-CSRS ~ SEC Filings Explained
Certified semi-annual shareholder report of registered management investment companies
Form 2-E, 2-E/A ~ SEC Filings Explained
Sales material filed pursuant to Rule 609 under Regulation E. (and amendment thereto)
Nasdaq-100 Index Tracking Stock (Nasdaq:QQQQ)
This ETF represents the Nasdaq-100 Index, which consists of the 100 largest and most actively traded non-financial stocks on the Nasdaq, QQQQ offers broad exposure to the tech sector. Because it curbs the risk that comes with investing in individual stocks, the QQQQ is a great way to invest in the long-term prospects of the technology industry. The diversification it offers can be a huge advantage when there's volatility in the markets. If a tech company falls short of projected earnings, it will likely be hit hard. Between 2000 and 2004, QQQQ was by far the most heavily traded index fund.
Fibonacci Pivot Points
Fibonacci Pivot Points start just the same as Standard Pivot Points. From the base Pivot Point, Fibonacci multiples of the high-low differential are added to form resistance levels and subtracted to form support levels.
Pivot Point (P) = (High Low Close)/3
Support 1 (S1) = P - {.382 * (High - Low)}
Support 2 (S2) = P - {.618 * (High - Low)}
Support 3 (S3) = P - {1 * (High - Low)}
Resistance 1 (R1) = P {.382 * (High - Low)}
Resistance 2 (R2) = P {.618 * (High - Low)}
Resistance 3 (R3) = P {1 * (High - Low)}
The chart below shows the Dow Industrials SPDR (DIA) with Fibonacci Pivot Points on a 15 minute chart. R1 and S1 are based on 38.2%. R2 and S2 are based on 61.8%. R3 and S3 are based on 100%.

BEARISH DELIBERATION
The Bearish Deliberation Pattern is a derivative of the Bearish Three White Soldiers Pattern. This pattern also shows a weakness similar to the Bearish Advance Block Pattern since it becomes weaker in a short period of time. However here the weakness occurs all at once on the third day. The small third body of the pattern shows that the rally is losing strength and a reversal is possible.
Recognition Criteria:
1. Market is characterized by uptrend.
2. We see long white bodies in the first and second days.
3. The second day has a higher close than the first day.
4. Then the third day opens near the second day's close.
5. The third day is typically a short white candlestick, a spinning top or a star that gaps above the second day.
Explanation:
The Bearish Deliberation Pattern appears after a sustained upward move and is suggestive of the fact that the rally is losing strength and a reversal is possible. The formation is a proof that the bulls’ strength is at least temporarily exhausted.
Important Factors:
The last small white candlestick may show a gap away from the long white body, thus becoming a star, or it can be riding on the shoulder of the long white real body.
The Bearish Deliberation Pattern is not normally a top reversal pattern but it has potential to precede a meaningful price decline. This pattern is more important at higher price levels. It must be used to liquidate long positions but it is yet too early for short positions.
A confirmation on fourth day is required to confirm that the uptrend has reversed. This may be in the form of a black candlestick, a large gap down or a lower close on the fourth day.
ETF’s Explained
An exchange-traded fund (ETF) is an investment fund traded on stock exchanges, much like stocks.[1] An ETF holds assets such as stocks, commodities, or bonds, and trades close to its net asset value over the course of the trading day. Most ETFs track an index, such as a stock index or bond index. ETFs may be attractive as investments because of their low costs, tax efficiency, and stock-like features.[2][3] ETFs are the most popular type of exchange-traded product.[citation needed]
Only so-called authorized participants (typically, large institutional investors) actually buy or sell shares of an ETF directly from or to the fund manager, and then only in creation units, which are large blocks of tens of thousands of ETF shares, usually exchanged in-kind with baskets of the underlying securities. Authorized participants may wish to invest in the ETF shares for the long-term, but they usually act as market makers on the open market, using their ability to exchange creation units with their underlying securities to provide liquidity of the ETF shares and help ensure that their intraday market price approximates to the net asset value of the underlying assets.[4] Other investors, such as individuals using a retail broker, trade ETF shares on this secondary market.
An ETF combines the valuation feature of a mutual fund or unit investment trust, which can be bought or sold at the end of each trading day for its net asset value, with the tradability feature of a closed-end fund, which trades throughout the trading day at prices that may be more or less than its net asset value. Closed-end funds are not considered to be "ETFs", even though they are funds and are traded on an exchange. ETFs have been available in the US since 1993 and in Europe since 1999. ETFs traditionally have been index funds, but in 2008 the U.S. Securities and Exchange Commission began to authorize the creation of actively managed ETFs.
BULLISH TRI STAR
The Bullish Tri Star Pattern is a very rare but significant bottom reversal pattern. Three Dojis form this pattern. The middle Doji is a Doji Star.

Recognition Criteria:
1. Market is characterized by downtrend.
2. Then we see three consecutive Doji.
3. The second day Doji gaps below the first and third.
Explanation:
In the case of a Bullish Tri Star Pattern, we have a market, which is in a downtrend for a long time. However the weakening trend shows itself by the fact that the real bodies are probably becoming smaller. The first Doji is a matter of concern. The second Doji clearly indicates that market is losing its direction. Finally, the third Doji warns that the downtrend is over. This pattern indicates too much indecision leading to reversal of positions.
Important Factors:
A confirmation on fourth day is required to be sure that the downtrend has reversed. Confirmation may be in the form of a white candlestick, a large gap up or a higher close on the fourth day.
Pivot Points ~ Support and Resistance
Support and resistance levels based on Pivot Points can be used just like traditional support and resistance levels. The key is to watch price action closely when these levels come into play. Should prices decline to support and then firm, traders can look for a successful test and bounce off support. It often helps to look for a bullish chart pattern or indicator signal to confirm an upturn from support. Similarly, should prices advance to resistance and stall, traders can look for a failure at resistance and decline. Again, chartists should look for a bearish chart pattern or indicator signal to confirm a downturn from resistance.

The second support and resistance levels can also be used to identify potentially overbought and oversold situations. A move above the second resistance level would show strength, but it would also indicate an overbought situation that could give way to a pullback. Similarly, a move below the second support would show weakness, but would also suggest a short-term oversold condition that could give way to a bounce.

Form S-4 ~ SEC Filings Explained
Registration of securities issued in business combination transactions
Doji Star
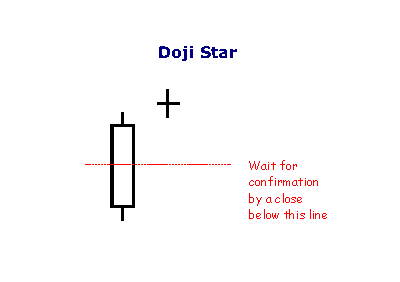
A Doji Star is weaker than the Morning or Evening Star: the doji represents indecision. The doji star requires confirmation from the next candlestick closing in the bottom half of the body of the first candlestick.
Form TA-2 ~ SEC Filings Explained
Annual report of transfer agent activities filed pursuant to the Securities Exchange Act of 1934
BULLISH HOMING PIGEON
Bullish Homing Pigeon Pattern is a small black real body contained by a prior relatively long black real body.
Recognition Criteria:
1. Market is in downtrend.
2. We see a black body in the first day.
3. Then we again see a black body in the second day where the real body of this second day is completely engulfed by the real body of the first day. It is not required that the shadows (high/low) of the second candlestick are contained within the first, though it's preferable if they are.
Explanation:
The Bullish Homing Pigeon Pattern is a signal of disparity. In a market characterized by downtrend, we first see heavy selling reflected by the long, black real body of the first day. However small body of second day points out to diminished power and enthusiasm of the sellers thus suggesting a trend reversal.
Important Factors:
The important fact about this pattern is the requirement that the second day has a minute real body relative to the prior candlestick and that this small body is completely contained by the larger one. The Bullish Homing Pigeon Pattern is not necessarily a signal for a rally. Market usually has a tendency to enter into a congestion phase following a Homing Pigeon.
We must check the third day to confirm that the downtrend has reversed. This confirmation may be in the form of a white candlestick, a large gap up or a higher close on the next trading day (on the third day).
List of Direxion ETF’s
Symbol Fund Index/Benchmark Daily Target Bloomberg Index Symbol
Long Term Investment
ETFs
KNOW
Direxion All Cap Insider Sentiment Shares
Sabrient Multi-Cap Insider/Analyst Quant-Weighted Index - SBRQAM
INSD
Direxion Large Cap Insider Sentiment Shares
Sabrient Large-Cap Insider/Analyst Quant-Weighted Index - SBRQAL
VSPY
Direxion S
Shooting Star
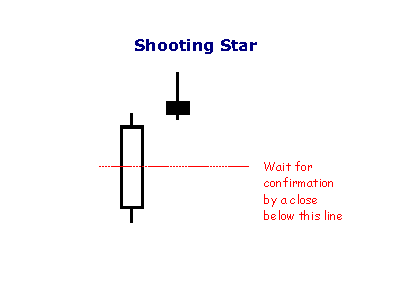
The shooting star is a type of bearish reversal pattern. The Shooting Star looks exactly the same as the Inverted hammer, but instead of being found in a downtrend it is found in an uptrend and thus has different implications. Like the Inverted hammer it is made up of a candle with a small lower body, little or no lower wick, and a long upper wick that is at least two times the size of the lower body.
The long upper wick of the candlestick pattern indicates that the buyers drove prices up at some point during the period in which the candle was formed but encountered selling pressure which drove prices back down for the period to close near to where they opened. As this occurred in an uptrend the selling pressure is seen as a potential reversal sign. When encountering this pattern traders will look for a lower open on the next period before considering the pattern valid and potentially including it in their trading strategy.
As with the Inverted hammer most traders will see a longer wick as a sign of a greater potential reversal and like to see an increase in volume on the day the Shooting Star forms.
Varieties of ETFs
The first ETF was the S
|
Followers
|
3286
|
Posters
|
|
|
Posts (Today)
|
0
|
Posts (Total)
|
2804248
|
|
Created
|
08/22/10
|
Type
|
Free
|
| Moderator Nilbud | |||
| Assistants mick ManicTrader PhotoChick Kirimi $Pistol Pete$ | |||
   Investor Hub Alerts: Sign up for 'STOCKGOODIES PLAYS OF THE WEEK ' E-Mail List Investor Hub Alerts: Sign up for 'STOCKGOODIES PLAYS OF THE WEEK ' E-Mail ListUPDATE; 5-1-22 courtesy of charting /\ wit tweezer top calls /\ Tony @Montana_Trades Really good study sheet on Candlestick Patterns [-chart]pbs.twimg.com/media/FRn8188XMAAdZvk?format=jpg&name=small[/chart] 

02-07-2021
|
|
Posts Today
|
0
|
|
Posts (Total)
|
2804248
|
|
Posters
|
|
|
Moderator
|
|
|
Assistants
|
| Volume | |
| Day Range: | |
| Bid Price | |
| Ask Price | |
| Last Trade Time: |


