 News
News  Market Data
  Discover
Support: 888-992-3836
Copyright © 2023 InvestorsHub Inc.


Register for free to join our community of investors and share your ideas. You will also get access to streaming quotes, interactive charts, trades, portfolio, live options flow and more tools.
Trend Identification Using Moving Averages
The same signals can be generated using simple or exponential moving averages. As noted above, the preference depends on each individual. These examples below will use both simple and exponential moving averages. The term "moving average" applies to both simple and exponential moving averages.
The direction of the moving average conveys important information about prices. A rising moving average shows that prices are generally increasing. A falling moving average indicates that prices, on average, are falling. A rising long-term moving average reflects a long-term uptrend. A falling long-term moving average reflects a long-term downtrend.

The chart above shows 3M (MMM) with a 150-day exponential moving average. This example shows just how well moving averages work when the trend is strong. The 150-day EMA turned down in November 2007 and again in January 2008. Notice that it took a 15% decline to reverse the direction of this moving average. These lagging indicators identify trend reversals as they occur (at best) or after they occur (at worst). MMM continued lower into March 2009 and then surged 40-50%. Notice that the 150-day EMA did not turn up until after this surge. Once it did, however, MMM continued higher the next 12 months. Moving averages work brilliantly in strong trends.

What prompts individuals to buy or sell a security? How do investors handle risk or loss? Why do speculative bubbles appear and then burst?

For All Your $RTXB DD ~ Use PennyStock Tweets
http://www.pennystocktweets.com/stocks/profile/RTXB

Candlestick Charts
The Japanese have been using candlestick charts since the 17th century to analyze rice prices. Candlesticks were introduced into modern technical analysis by Steve Nison in his book Japanese Candlestick Charting Techniques.
Candlesticks contain the same data as a normal bar chart but highlight the relationship between opening and closing prices. The narrow stick represents the range of prices traded during the period (high to low) while the broad mid-section represents the opening and closing prices for the period.
If the close is higher than the open - the candlestick mid-section is hollow or shaded blue/green.
If the open is higher than the close - the candlestick mid-section is filled in or shaded red.
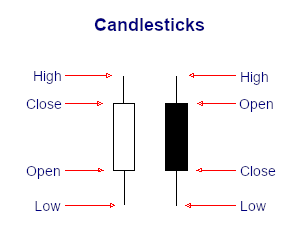
The advantage of candlestick charts is the ability to highlight trend weakness and reversal signals that may not be apparent on a normal bar chart.
News of the October 14th price decline was also included in this list. At the time, this was the single largest one-day point decline in the Dow Industrials. Surprisingly, the stories relating to the past price declines were deemed the most significant news events. As Shiller states:
Use PennyStock Tweets For All Your $NWPP DD
http://www.pennystocktweets.com/stocks/profile/NWPP
Tweezer Tops

The Tweezer Top formation is a bearish reversal pattern seen at the top of uptrends.
Tweezer Top formation consists of two candlesticks:
Bullish Candle (Day 1)
Bearish Candle (Day 2)
Sometimes Tweezer Tops have three candlesticks.
A bearish Tweezer Top occurs during an uptrend when bulls take prices higher, often closing the day off near the highs (a bullish sign). However, on the second day, how traders feel (i.e. their sentiment) reverses completely. The market opens and goes straight down, often eliminating the entire gains of Day One.

On Day 1, the bulls were in charge of the Russell 2000 E-mini. On Day 2, however, the bulls began the day trying to make a new high, but were rejected by the overhead resistance created by the prior day's highs. The market then sank quickly only to recover halfway by the end of the close on Day 2. Day 3 opened with a spectacular gap up, but the bulls were promptly rejected by the bears at the now established resistance line. The Russell 2000 E-mini then fell for the rest of the day. Many classic chartists will recognize this triple Tweezer Top as a Double Top formation (see: Double Top).
The Tweezer Top and Bottom reversal pattern is extremely helpful because it visually indicates a transfer of power and sentiment from the bulls and the bears. Of course other technical indicators should be consulted before making a buy or sell signal based on the Tweezer patterns.
This marked a decoupling between stocks and bonds that would last for many years. Big deflationary events continued as the Nasdaq bubble burst in 2000, the housing bubble burst in 2006 and the financial crisis hit in 2007.

More On $PDOS At PennyStock Tweets
http://www.pennystocktweets.com/stocks/profile/PDOS
BULLISH UNIQUE THREE RIVER BOTTOM
The Bullish Unique Three River Bottom Pattern is an extremely rare bottom reversal pattern. Its first candlestick is an extended black candlestick then followed by a second black real body closing higher than the first candlestick’s close, and the third candlestick is a white candlestick with a very small real body. The real white body shows that the market lost the selling pressure.

Recognition Criteria:
1. Market is characterized by a downtrend.
2. We see a long black candlestick in the first day.
3. Then we see a Hammer-like black candlestick on the second day.
4. The lower shadow of the second day sets a new low.
5. Then we see a short white candlestick, which is below the second day candlestick.
Explanation:
With the Unique Three River Bottom bull pattern, we first see a long black stick in a falling market. The next day opens at a higher level, however bearish sentiment is strong causing a new low during the day however the day closes near the high thus producing a small black body within the body of the first day. This rally questions the strength of bears. The increasing uncertainty is further strengthened when the third day opens lower, but not lower than the low of the second day. There is some stability on the third day as evidenced by its small white body. Third day ends by a rally closing below the close of the second day. If price rises to new high on the fourth day, then a reversal of trend is confirmed.
Important Factors:
A confirmation on fourth day is advisable to show that that the downtrend has reversed. This may be in the form of a white candlestick, a large gap up or a higher close on the fourth day.
Put another way, the consumer staples sector outperformed the consumer discretionary sector. Also notice that this ratio peaked ahead of the S
For All Your $LIQT DD ~ Use PennyStock Tweets
http://www.pennystocktweets.com/stocks/profile/LIQT
Form TA-1 ~ SEC Filings Explained
Application for registration as a transfer agent filed pursuant to the Securities Exchange Act of 1934
From the PeopleSoft (PSFT)[PSFT] example, we can see that support can turn into resistance and then back into support. PeopleSoft found support at 18 from Oct-98 to Jan-99 (green oval), but broke below support in Mar-99 as the bears overpowered the bulls. When the stock rebounded (red oval), there was still overhead supply at 18 and resistance was met from Jun-99 to Oct-99.

$FFFC Profile on PST - For All Your DD Use More http://www.pennystocktweets.com/stocks/stockprofile/FFFC
Parabolic SAR
Introduction
Developed by Welles Wilder, the Parabolic SAR refers to a price and time based trading system. Wilder called this the "Parabolic Time/Price System". SAR stands for "stop and reverse", which is the actual indicator used in the system. SAR trails price as the trend extends over time. The indicator is below prices when prices are rising and above prices when prices are falling. In this regard, the indicator stops and reverses when the price trend reverses and breaks above or below the indicator.
Wilder introduced the Parabolic Time/Price System in his 1978 book, New Concepts in Technical Trading Systems. This book also includes RSI, Average True Range and the Directional Movement Concept (ADX). Despite being developed before the computer age, Wilder's indicators have stood the test of time and remain extremely popular.

Calculation
Calculation of SAR is complex with if/then variables that make it difficult to put in a spreadsheet. These examples will provide a general idea of how SAR is calculated. Because the formulas for rising and falling SAR are different, it is easier to divide the calculation into two parts. The first calculation covers rising SAR and the second covers falling SAR.
Rising SAR
Prior SAR: The SAR value for the previous period.
Extreme Point (EP): The highest high of the current uptrend.
Acceleration Factor (AF): Starting at .02, AF increases by .02 each
time the extreme point makes a new high. AF can reach a maximum
of .20, no matter how long the uptrend extends.
Current SAR = Prior SAR Prior AF(Prior EP - Prior SAR)
13-Apr-10 SAR = 48.28 = 48.13 .14(49.20 - 48.13)
The Acceleration Factor is multiplied by the difference between the
Extreme Point and the prior period's SAR. This is then added to the
prior period's SAR. Note however that SAR can never be above the
prior two periods' lows. Should SAR be above one of those lows, use
the lowest of the two for SAR.


Falling SAR
Prior SAR: The SAR value for the previous period.
Extreme Point (EP): The lowest low of the current downtrend.
Acceleration Factor (AF): Starting at .02, AF increases by .02 each
time the extreme point makes a new low. AF can reach a maximum
of .20, no matter how long the downtrend extends.
Current SAR = Prior SAR - Prior AF(Prior SAR - Prior EP)
9-Feb-10 SAR = 43.56 = 43.84 - .16(43.84 - 42.07)
The Acceleration Factor is multiplied by the difference between the
Prior period's SAR and the Extreme Point. This is then subtracted
from the prior period's SAR. Note however that SAR can never be
below the prior two periods' highs. Should SAR be below one of
those highs, use the highest of the two for SAR.


Interpretation
SAR follows price and can be considered a trend following indicator. Once a downtrend reverses and starts up, SAR follows prices like a trailing stop. The stop continuously rises as long as the uptrend remains in place. In other words, SAR never decreases in an uptrend and continuously protects profits as prices advance. The indicator acts as a guard against the propensity to lower a stop-loss. Once price stops rising and reverses below SAR, a downtrend starts and SAR is above the price. SAR follows prices lower like a trailing stop. The stop continuously falls as long as the downtrend extends. Because SAR never rises in a downtrend, it continuously protects profits on short positions.
Step Increments
The Acceleration Factor (AF), which is also referred to as the Step, dictates SAR sensitivity. SharpCharts users can set the Step and the Maximum Step. As shown in the spreadsheet example, the Step is a multiplier that influences the rate-of-change in SAR. That is why it is referred to as the Acceleration Factor. Step gradually increases as the trend extends until it hits a maximum. SAR sensitivity can be decreased by decreasing the Step. A lower step moves SAR further from price, which makes a reversal less likely.
SAR sensitivity can be increased by increasing the step. A higher step moves SAR closer to the price action, which makes a reversal more likely. The indicator will reverse too often if the step is set too high. This will produce whipsaws and fail to capture the trend. Chart 6 shows IBM with SAR (.01, .20). The step is .01 and the Maximum Step is .20. Chart 7 shows IBM with a higher Step (.03). SAR is more sensitive in chart 7 because there are more reversals. This is because the Step is higher in chart 7 (.03) than chart 6 (.01).


Maximum Step
The sensitivity of the indicator can also be adjusted using the Maximum Step. While the Maximum Step can influence sensitivity, the Step carries more weight because it sets the incremental rate-of-increase as the trend develops. Also note that increasing the Step insures that the Maximum Step will be hit quicker when a trend develops. Chart 8 shows Best Buy (BBY) with a Maximum Step (.10), which is lower than the default setting (.20). This lower Maximum Step decreases the sensitivity of the indicator and produces fewer reversals. Notice how this setting caught a two month downtrend and a subsequent two month uptrend. Chart 9 shows BBY with a higher Maximum Step (.20). This higher reading produced extra reversals in early February and early April.


Conclusions
The Parabolic SAR works best with trending securities, which occur roughly 30% of the time according to Wilder's estimates. This means the indicator will be prone to whipsaws over 50% of the time or when a security is not trending. After all, SAR is designed to catch the trend and follow it like a trailing stop. As with most indicators, the signal quality depends on the settings and the characteristics of the underlying security. The right settings combined with decent trends can produce a great trading system. The wrong settings will result in whipsaws, losses and frustration. There is no golden rule or one-size-fits-all setting. Each security should be evaluated based on its own characteristics. Parabolic SAR should also be used in conjunction with other indicators and technical analysis techniques. For example, Wilder's Average Directional Index can be used to estimate the strength of the trend before considering signals.
Scans
Break above falling SAR: This scan starts with stocks that have an average price of $10 or greater over the last three months and average volume greater than 40,000. The scan then filters for stocks that have a bullish SAR reversal (Parabolic SAR (.01,.20)). This scan is just meant as a starter for further refinement.
Break below rising SAR: This scans starts with stocks that have an average price of $10 or greater over the last three months and average volume greater than 40,000. The scan then filters for stocks that have a bearish SAR reversal (Parabolic SAR (.01,.20)). This scan is just meant as a starter for further refinement.
Stage 2 marks a bottom in the economy and the stock market. Even though economic conditions have stopped deteriorating, the economy is still not at an expansion stage or actually growing. However, stocks anticipate an expansion phase by bottoming before the contraction period ends.
More On $ORRV At PennyStock Tweets
http://www.pennystocktweets.com/stocks/profile/ORRV
Form 13F-HR, 13F-HR/A ~ SEC Filings Explained
Initial Quarterly Form 13F Holdings report filed by institutional managers (and amendment thereto)
Not all factors or influences are listed in this article. Shiller offers more factors and detailed evidence in the book. After examining efficient markets, random walks, bubbles and investor attitudes, Shiller also offers several remedies to contain speculative volatility in a free society.
For All Your $MDRPF DD ~ Use PennyStock Tweets
http://www.pennystocktweets.com/stocks/profile/MDRPF
SEC Filings Explained ~ Rule 144
On December 6, 2007, the SEC published final rules revising Rule 144 under the Securities Act of 1933, which regulates the resale of restricted securities and securities held by affiliates. The amendments to Rule 144, among other things:
1. Shorten the holding period for affiliate and non-affiliate holders of restricted securities of SEC-reporting companies to six months, subject to certain conditions
2. Permit unlimited resale by non-affiliate holders of restricted securities by complying only with the current public information condition for resale of restricted securities issued by SEC reporting companies made after the six-month holding period; and without complying with any Rule 144 conditions for resale of restricted securities issued by both SEC reporting and non-reporting companies made after a one-year holding period.
3. permit resale of equity securities by affiliates that meet certain conditions through riskless principal transactions and brokers’ transactions in which the broker has published bid and asked quotations for the security in an alternative trading system.
4. Eliminate the manner of sale conditions and ease the volume limitations for resale of debt securities by affiliates.
5. Increase the thresholds that trigger the Form 144 filing requirement to 5,000 shares or $50,000.
The SEC did not adopt previously proposed provisions relating to the tolling of holding periods in connection with hedging transactions.
The amendments will become effective on February 15, 2008, and will apply to securities acquired before or after that date. Background
Rule 144 regulates the resale of “restricted securities”1 and “control securities,”2 by establishing certain conditions that must be satisfied in order for the resale to be exempt from the Securities Act registration requirements pursuant to Section 4(1) of the Securities Act—a safe harbor from “underwriter” status for the selling security holder.
The conditions include the following:
? There must be adequate current public information available about the issuer;
? If the securities being sold are restricted securities, the security holder must have held the security for a specified holding period;
? The resale must be within specified sales volume limitations;
? The resale must comply with the manner of sale requirements of the rule; and
? The selling security holder must file Form 144 with the SEC if the amount of securities being sold exceeds specified thresholds.
Amendments to Conditions for Resale of Restricted Securities
Restricted Securities of SEC-Reporting Companies. The SEC has reduced the holding period under Rule 144 for restricted securities of SEC-reporting companies held by both affiliates and non-affiliates from one year to six months. Affiliate holders of reporting company securities may now resell their restricted securities after six months, subject to the other Rule 144 requirements. Non-affiliate holders of reporting company securities (who have also not been affiliates during the prior three months) may now resell their restricted securities held between six months and one year subject only to Rule 144’s current public information requirement. Any such resale by a non-affiliate after one year will be exempt from all Rule 144 requirements.
Restricted Securities of Non-Reporting Companies. There is still a one-year holding period for affiliate and non-affiliate holders of restricted securities in non-reporting companies under amended Rule 144. After the one-year holding period, non-affiliates may now resell their restricted securities without having to comply with any other Rule 144 requirements; affiliates seeking to resell their restricted securities must still meet all Rule 144 requirements.
The manner of sale requirements of Rule 144 require securities to be sold in “brokers’ transactions” or in transactions directly with a “market maker.”
The rule includes restrictions on (1) soliciting or arranging for the solicitation of orders to buy the securities in anticipation of, or in connection with, the Rule 144 transaction or (2) making any payment in connection with the offer or sale of the securities to any person other than the broker who executes the order to sell the securities.
The SEC amended these rules to also permit the resale of restricted equity securities by affiliates through riskless principal transactions in which trades are executed at the same price, exclusive of any explicitly disclosed markup or markdown, commission equivalent or other fee, and the rules for a self-regulatory organization permit the transaction to be reported as riskless.3 The amended rule also expands the definition of a “brokers’ transaction” for purposes of such resale by permitting a broker to insert bid and ask quotations for the security in an alternative trading system, provided that the broker has published bona fide bid and ask quotations for such security on each of the last 12 business days. Resale of Restricted Debt Securities The SEC has eliminated the manner-of-sale requirements for affiliate resale of debt securities, including non-participatory preferred stock (which has debt-like characteristics) and asset-backed securities. The SEC also raised the volume limitations for the resale of debt securities to permit resale in an amount that does not exceed ten percent of a tranche (or a class with respect to non-participatory preferred stock), together with all sales of securities of the same tranche sold for the selling debt security holder within a three-month period. Form 144 Filing Triggers
The sales thresholds for filing Form 144 have been increased from 500 shares or $10,000 worth of securities to 5,000 shares or $50,000. Codified
SEC Staff Interpretations
The SEC has also codified various staff interpretations relating to Rule 144, including the following:
1. Stating that securities acquired by accredited investors pursuant to Section 4(6) of the Securities Act are considered restricted securities
2. Permitting tacking of holding periods when a company reorganizes into a holding company structure
3. Permitting tacking of holding periods for conversions and exchanges of securities
4. Deeming the acquisition dates for securities acquired pursuant to the cashless exercise of options and warrants as the dates the options or warrants were acquired
5. Permitting a pledgee of restricted securities to sell the pledged securities without having to aggregate the sale with sales by other pledgees from the same pledgor (as long as there is no concerted action by those pledgees), for purposes of the Rule 144 volume limitation condition
6. Permitting the Form 144 representations required from security holders relying on Exchange Act Rule 10b5-1 to be made as of the date the holder adopted a trading plan or gave trading instructions
7. Confirming the unavailability of Rule 144 for the resale of securities by reporting and non-reporting firms
Therefore, if the price returns to this level, there is likely to be an increase in supply, and hence resistance.
Use PennyStock Tweets For All Your $MIESF DD
http://www.pennystocktweets.com/stocks/profile/MIESF
Form N-30D ~ SEC Filings Explained
Initial annual and semi-annual reports mailed to investment company shareholders
Psychological Factors
Shiller asserts that there is a human tendency towards "overconfidence in ones beliefs". Moreover, people often rely on intuition when making investment decisions.
Form 10-K~ SEC Filings Explained
A Form 10-K is an annual report required by the U.S. Securities and Exchange Commission (SEC), that gives a comprehensive summary of a public company's performance. Although similarly named, the annual report on Form 10-K is distinct from the often glossy "annual report to shareholders," which a company must send to its shareholders when it holds an annual meeting to elect directors (though some companies combine the annual report and the 10-K into one document). The 10-K includes information such as company history, organizational structure, executive compensation, equity, subsidiaries, and audited financial statements, among other information.
Companies with more than $10 million in assets and a class of equity securities that is held by more than 500 owners must file annual and other periodic reports, regardless of whether the securities are publicly or privately traded. Up until March 16, 2009, smaller companies could use Form 10-KSB. If a shareholder requests a company’s Form 10-K, the company must provide a copy. In addition, most large companies must disclose on Form 10-K whether the company makes its periodic and current reports available, free of charge, on its website. Form 10-K, as well as other SEC filings may be searched at theEDGAR database on the SEC's website.
In addition to the 10-K, which is filed annually, a company is also required to file quarterly reports on Form 10-Q. Information for the final quarter of a firm'sfiscal year is included in the annual 10-K, so only three 10-Q filings are made each year. In the period between these filings, and in case of a significant event, such as a CEO departing or bankruptcy, a Form 8-K must be filed in order to provide up to date information.
The name of the Form 10-K comes from the CFR (Code of Federal Regulations) designation of the form pursuant to sections 13 and 15(d) of the Securities Exchange Act of 1934 as amended.
Related Forms
Unlike the 10-K filed annually, other forms serve related purposes, but have different schedules. Form 10-Q, much briefer, is filed after each of the three quarters that do not have a 10-K filing. Form 8-K covers special material events that occur between 10-K and 10-Q filings.
A substantial number of firms filed their 10-K as a Form 10-K405 during the late 1990s and early 2000s (decade). A 10-K405 is a 10-K where the Regulation S-K Item 405 box on the cover page is checked. Due to confusion in its application, the 10-K405 was eliminated in 2002.
Filing Deadlines
Historically, Form 10-K had to be filed with the SEC within 90 days after the end of the company's fiscal year. However, in September 2002, the SEC approved a Final Rule that changed the deadlines to 75 days for Form 10-K for "accelerated filers"; meaning issuers that have a public float of at least $75 million, that have been subject to the Exchange Act's reporting requirements for at least 12 calendar months, that previously have filed at least one annual report, and that are not eligible to file their quarterly and annual reports on Forms 10-QSB and 10-KSB. These shortened deadlines were to be phased in over a three-year period, however in 2004 the SEC postponed the three-year phase in by one year. In December 2005, the SEC created a third category of "large accelerated filers," accelerated filers with a public float of over $700 million. As of December 27, 2005, the deadline for filing for large accelerated filers was still 75 days, however beginning with the fiscal year ending on or after December 15, 2006, the deadline will be 60 days. For other accelerated filers the deadline will remain at 75 days and for non-accelerated filers the deadline will remain at 90 days. For further reading, see the Final Rules [1] section of the SEC's website, referencing Rule 33-8644.
Parts
Every annual report contains 4 parts and 15 schedules. They are
PART I
ITEM 1. Description of Business
ITEM 1A. Risk Factor
ITEM 1B. Unresolved Staff Comments
ITEM 2. Description of Properties
ITEM 3. Legal Proceedings
ITEM 4. Mine Safety Disclosures
PART II
ITEM 5. Market for Registrant’s Common Equity, Related Stockholder Matters and Issuer Purchases of Equity Securities
ITEM 6. Selected Financial Data
ITEM 7. Management’s Discussion and Analysis of Financial Condition and Results of Operations
ITEM 7A. Quantitative and Qualitative Disclosures About Market Risk
ITEM 8. Financial Statements and Supplementary Data
ITEM 9. Changes in and Disagreements With Accountants on Accounting and Financial Disclosure
ITEM 9A(T). Controls and Procedures
ITEM 9B. Other Information
PART III
ITEM 10. Directors, Executive Officers and Corporate Governance
ITEM 11. Executive Compensation
ITEM 12. Security Ownership of Certain Beneficial Owners and Management and Related Stockholder Matters
ITEM 13. Certain Relationships and Related Transactions, and Director Independence
ITEM 14. Principal Accounting Fees and Services
PART IV
ITEM 15. Exhibits, Financial Statement Schedules Signatures
Part 1
Item 1 - Business
This describes the business of the company: who and what the company does, what subsidiaries it owns, and what markets it operates in. It may also include recent events, competition, regulations, and labor issues. (Some industries are heavily regulated, have complex labor requirements, which have significant effects on the business.) Other topics in this section may include special operating costs, seasonal factors, or insurance matters.
Item 1A - Risk Factors
Here, the company lays out anything that could go wrong, likely external effects, possible future failures to meet obligations, and other risks disclosed to adequately warn investors and potential investors.
[Item 2 - Properties
This section lays out the significant properties, physical assets, of the company. This only includes physical types of property, not intellectual or intangible property.
Item 3 - Legal Proceedings
Here, the company discloses any significant pending law suit or other legal proceeding. References to these proceedings could also be disclosed in the Risks section or other parts of the report.
Item 4 - Mine Safety Disclosures
This section requires some companies to provide information about mine safety violations or other regulatory matters.
Item 5 - Market
Gives high's and low's of stock, in a simple statement. Market for Registrant's Common Equity, related stockholder matters and issuer purchases of equity securities.
Item 6 - Consolidated Financial Data
In this section Financial Data showing consolidated records for the legal entity as well as subsidiary companies.
Item 7 - Management's Discussion and Analysis
Here, management discusses the operations of the company in detail by usually comparing the current period versus prior period. These comparisons provide a reader an overview of the operational issues of what causes such increases or decreases in the business.
Forward Looking Statements
Forward-looking statement is the disclaimer that projections as to future performance are not guaranteed, and things could go otherwise.
Item 8 - Financial Statements
1. Independent Auditor's Report 2. Consolidated Statements of Operation 3. Consolidated Balance Sheets 4. other accounting reports and notes.
Here, also, is the going concern opinion. This is the opinion of the auditor as to the viability of the company. Look for "unqualified opinion" expressed by auditor. This means the auditor had no hesitations or reservations about the state of the company, and the opinion is without any qualifications (unconditional).
Five percent ownership
Five percent ownership refers to companies or individuals who hold at least 5% of the total value of the stock of a public company. They usually are founders of the company or large mutual fund companies, and because of how much stock they own, they usually have access to the board of directors of the company and hold significant sway over the company.
Five percent owners must also file Schedule 13d with the SEC.
Bar charts can also be displayed using the open, high, low and close. The only difference is the addition of the open price, which is displayed as a short horizontal line extending to the left of the bar. Whether or not a bar chart includes the open depends on the data available.

This link will help thou $FMBV BarChart Technical Analysis NITE-LYNX
http://www.barchart.com/technicals/stocks/FMBV

Behold the $GRNH BarChart Technical Analysis NITE-LYNX
http://www.barchart.com/technicals/stocks/GRNH
Behold the $BTDG BarChart Technical Analysis NITE-LYNX
http://www.barchart.com/technicals/stocks/BTDG
For thou convenience $AAPH BarChart Technical Analysis NITE-LYNX
http://www.barchart.com/technicals/stocks/AAPH
For thou convenience $ACGJ BarChart Technical Analysis NITE-LYNX
http://www.barchart.com/technicals/stocks/ACGJ
BarChart Technical Analysis NITE-LYNX $NTRR
http://www.barchart.com/technicals/stocks/NTRR
For thou convenience $ZERO BarChart Technical Analysis NITE-LYNX
http://www.barchart.com/technicals/stocks/ZERO
$REFG BarChart Technical Analysis NITE-LYNX
http://www.barchart.com/technicals/stocks/REFG
This link will help thou $ITNS BarChart Technical Analysis NITE-LYNX
http://www.barchart.com/technicals/stocks/ITNS
$AMNF BarChart Technical Analysis NITE-LYNX
http://www.barchart.com/technicals/stocks/AMNF
NITE-LYNX $FMBV BarChart Technical Analysis
http://www.barchart.com/technicals/stocks/FMBV
This link will help thou $FWDG BarChart Technical Analysis NITE-LYNX
http://www.barchart.com/technicals/stocks/FWDG
Feast thine eyes upon $ACME BarChart Technical Analysis NITE-LYNX
http://www.barchart.com/technicals/stocks/ACME
$ENTB BarChart Technical Analysis NITE-LYNX
http://www.barchart.com/technicals/stocks/ENTB
This link will help thou $ACGI BarChart Technical Analysis NITE-LYNX
http://www.barchart.com/technicals/stocks/ACGI
Behold the $ACDP BarChart Technical Analysis NITE-LYNX
http://www.barchart.com/technicals/stocks/ACDP
$ICBT BarChart Technical Analysis NITE-LYNX
http://www.barchart.com/technicals/stocks/ICBT
This link will help thou $ANDI BarChart Technical Analysis NITE-LYNX
http://www.barchart.com/technicals/stocks/ANDI
NITE-LYNX $GNSZ BarChart Technical Analysis
http://www.barchart.com/technicals/stocks/GNSZ
$KBLB BarChart Technical Analysis NITE-LYNX
http://www.barchart.com/technicals/stocks/KBLB
NITE-LYNX $EXMT BarChart Technical Analysis
http://www.barchart.com/technicals/stocks/EXMT
NITE-LYNX $ILNS BarChart Technical Analysis
http://www.barchart.com/technicals/stocks/ILNS
|
Followers
|
3289
|
Posters
|
|
|
Posts (Today)
|
0
|
Posts (Total)
|
2804248
|
|
Created
|
08/22/10
|
Type
|
Free
|
| Moderator Nilbud | |||
| Assistants mick ManicTrader PhotoChick Kirimi $Pistol Pete$ | |||
   Investor Hub Alerts: Sign up for 'STOCKGOODIES PLAYS OF THE WEEK ' E-Mail List Investor Hub Alerts: Sign up for 'STOCKGOODIES PLAYS OF THE WEEK ' E-Mail ListUPDATE; 5-1-22 courtesy of charting /\ wit tweezer top calls /\ Tony @Montana_Trades Really good study sheet on Candlestick Patterns [-chart]pbs.twimg.com/media/FRn8188XMAAdZvk?format=jpg&name=small[/chart] 

02-07-2021
|
|
Posts Today
|
0
|
|
Posts (Total)
|
2804248
|
|
Posters
|
|
|
Moderator
|
|
|
Assistants
|
| Volume | |
| Day Range: | |
| Bid Price | |
| Ask Price | |
| Last Trade Time: |


