 News
News  Market Data
  Discover
Support: 888-992-3836
Copyright © 2023 InvestorsHub Inc.


Register for free to join our community of investors and share your ideas. You will also get access to streaming quotes, interactive charts, trades, portfolio, live options flow and more tools.
SEC Filings Explained ~ POS AM Form
Post-effective amendments to provide updated prospectus information.

Third, the consistent rise in stock prices provided a feedback loop that kept public attention on stocks. As the media reported the rise in the stock market, new money found its way into the stock market and pushed prices even higher.

Form 15F-12G, 15F-12G/A ~ SEC Filings Explained
Notice of termination of a foreign private issuer's registration of a class of securities under Section 12(g) (and amendment thereto)
$ETLS Profile on PST - For All Your DD Use More http://www.pennystocktweets.com/stocks/stockprofile/ETLS
The SEC publishes a series of guidelines for investors who wish to trade in microcap, or micro-capitalization, stocks, a group to which penny stocks belong. 
The 1995 Republican congress proposed cutting the capital gains tax and it was cut in 1997. Further cuts were proposed soon thereafter. These tax cuts as well as the anticipation of future capital gains tax cuts provided incentives to buy stocks.
The objective is not to buy low and sell high, but to buy high and to sell higher. We can never know what price is "low." Nor can we know what price is "high."
Form 11-KT, 11-KT/A ~ SEC Filings Explained
Transition report pursuant to Rule 13a-10 or 15d-10 (and amendment thereto)
For All Your $PTEEF DD ~ Use PennyStock Tweets
http://www.pennystocktweets.com/stocks/profile/PTEEF

Supply is synonymous with bearish, bears and selling. Demand is synonymous with bullish, bulls and buying.
there is only a few sectors that penny stocks dwell in , and that's because of the high speculation level is so easy to obtain.
DEF 14A~ SEC Filings Explained
A proxy statement is a statement required of a firm when soliciting shareholder votes. This statement is filed in advance of the annual meeting. The firm needs to file a proxy statement, otherwise known as a Form DEF 14A (Definitive Proxy Statement), with the U.S. Securities and Exchange Commission. This statement is useful in assessing how management is paid and potential conflict-of-interest issues with auditors. The statement includes:
? Voting procedure and information.
? Background information about the company's nominated directors including relevant history in the company or industry, positions on other corporate boards, and potential conflicts in interest.
? Board compensation.
? Executive compensation, including salary, bonus, non-equity compensation, stock awards, options, and deferred compensation. Also, information is included about perks such as personal use of company aircraft, travel, and tax gross-ups. Many companies will also include pre-determined payout packages for if an executive leaves the company.
? Who is on the audit committee, as well as a breakdown of audit and non-audit fees paid to the auditor.
SEC proxy rules: The term "proxy statement" means the statement required by Section 240.14a-3(a) whether or not contained in a single document.
In many cases, shareholder votes - particularly institutional shareholder votes - are determined by proxy firms which advise the shareholders...
Traditionally, broker-dealers have been permitted to vote for "routine" proposals on behalf of their shareholders if the shareholders do not return the proxy statement. This has been controversial, and in 2006 the NYSE Proxy Working Group recommended that the rules be modified so that uncontested director elections were not considered routine.[1] The SEC approved the rule on July 1, 2009.[2]
In July 2010, the SEC announced that it was seeking public comment on the efficiency of the proxy system.[3]
There has been some controversy over "proxy access" which is a method to allow shareholders to nominate candidates which appear on the proxy statement. Currently, only the nominating board can place candidates on the proxy statement. The United States Dodd–Frank Wall Street Reform and Consumer Protection Act specifically allowed the SEC to rule on this issue. In 2010, the SEC passed a rule which allowed certain shareholders to place candidates on the proxy statement,;[4] however, the rule was struck down by the United States Court of Appeals for the District of Columbia Circuit in 2011
For All Your $GDIMF DD ~ Use PennyStock Tweets
http://www.pennystocktweets.com/stocks/profile/GDIMF
Stocks and many other securities are judged in relative terms through the use of ratios such as PE, Price/Revenues and Price/Book. With this in mind, it also makes sense to analyze price movements in percentage terms.
Form N-14 ~ SEC Filings Explained
Initial registration statement for open-end investment company
Rule #4... Go back and look at past awareness days on the stock you thinking of buying off the momo hype and see how it traded will help you also as it will more than likely have the same sellers selling what they have left in most cases ... were they smart traders or morons
Form T-3 ~ SEC Filings Explained
Initial application for qualification of trust indentures
The crash apparently had nothing particularly to do with any news story other than that of the crash itself, but rather with theories about other investors' reasons for selling and about their psychology.
More On $RNDR At PennyStock Tweets
http://www.pennystocktweets.com/stocks/profile/RNDR
Be patient with winning trades; be enormously impatient with losing trades. Remember it is quite possible to make large sums trading/investing if we are "right" only 30% of the time, as long as our losses are small and our profits are large.
Dow Theory
There is also proof that one of the oldest systems around can outperform the market and reduce risk. Dow Theory seeks to buy when both the Dow Transports and the Dow Industrials record new reaction highs and sell or move into Treasuries when both record new reaction lows.
Check Out $MDHI On PennyStock Tweets
http://www.pennystocktweets.com/stocks/profile/MDHI
Dark Cloud
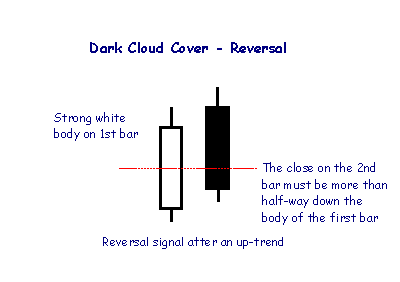
A Dark Cloud pattern encountered after an up-trend is a reversal signal, warning of "rainy days" ahead.
You should check daily at OTC markets to see if your stock has filed a 14-C for potential reverse splits and other valuable information
A break above is a victory for the bulls (demand) and a break below is a victory for the bears (supply).

Shadow and Tail
The shadow is the portion of the trading range outside of the body. We often refer to a candlestick as having a tall shadow or a long tail.
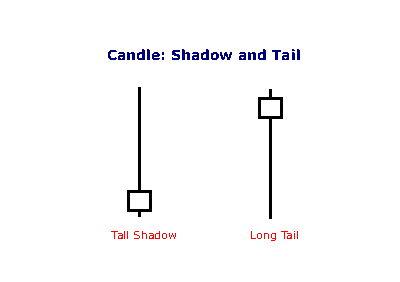
A tall shadow indicates resistance;
A long tail signals support.
The centerline marks the contraction/expansion threshold for the economy. Notice how the red market cycle leads the business cycle. The market turns up and crosses the centerline before the economic cycle turns. Similarly, the market turns down and crosses below the centerline ahead of the economic cycle.
Form 15-15D, 15-15D/A ~ SEC Filings Explained
Notice of suspension of duty to file reports pursuant to Section 13 and 15(d) of the Act (and amendment thereto)
Rumor has it EPXY has in development a crypto-currency based app and wallet. Crypto-Currencies like Bitcoin and Etherium will be some of the biggest dollar markets in history. EPXY going international.
This link will help thou $ITNS BarChart Technical Analysis NITE-LYNX
http://www.barchart.com/technicals/stocks/ITNS

The Coppock Breadth Indicator, originally known as Trendex's Timing Technique for Texas Traders, is a little known indicator used to identify buy signals from around the bottom of a bear market. It is very good at discriminating between bear market rallies and true bottoms in the stock market and has proven to be remarkably resistant to "whipsaws".
$AAXT BarChart Technical Analysis NITE-LYNX
http://www.barchart.com/technicals/stocks/AAXT
EVSV Massive military contract TBA next week. No dilution, no R/S, $90,000 in cash, $100,000+ Q3 sales and no toxic debt announced on Company Twitter: @EnviroServInc. Buying pressure increased on Friday. Setting up to run big on news.
Traders are often inclined to use Bollinger Bands with other indicators to confirm price action. In particular, the use of an oscillator like Bollinger Bands will often be coupled with a non-oscillator indicator like chart patterns or a trendline. If these indicators confirm the recommendation of the Bollinger Bands, the trader will have greater conviction that the bands are predicting correct price action in relation to market volatility.
Feast thine eyes upon $ACBC BarChart Technical Analysis NITE-LYNX
http://www.barchart.com/technicals/stocks/ACBC
Speed resistance lines are similar in interpretation to the Fibonacci Fan indicator. Many traders will watch for a move below the two-thirds level to signal a continued retracement toward the one-third level. It is important to remember that other technical indicators should be used when the price of the asset is near the trendline to confirm the strength of the predicted support/resistance.
For thou convenience $STEV BarChart Technical Analysis NITE-LYNX
http://www.barchart.com/technicals/stocks/STEV
The Coppock indicator was originally designed for use on a monthly time scale. It is effectively an oscillator calculated from the sum of a 14 month rate of change and 11-month rate of change, smoothed by a 10-period weighted moving average.
For thou convenience $MVTG BarChart Technical Analysis NITE-LYNX
http://www.barchart.com/technicals/stocks/MVTG
Volatility is based on the standard deviation, which changes as volatility increases and decreases. The bands automatically widen when volatility increases and narrow when volatility decreases. This dynamic nature of Bollinger Bands also means they can be used on different securities with the standard settings.
Feast thine eyes upon $ZERO BarChart Technical Analysis NITE-LYNX
http://www.barchart.com/technicals/stocks/ZERO
Developed J. Welles Wilder, the Relative Strength Index (RSI) is a momentum oscillator that measures the speed and change of price movements. RSI oscillates between zero and 100.
Feast thine eyes upon $CCNI BarChart Technical Analysis NITE-LYNX
http://www.barchart.com/technicals/stocks/CCNI
The Chaikin Money Flow line will fluctuate above and below a zero line similar to many other oscillators. Technical analyst can use the CMF indicator to study buying or selling pressure to help them forecast trend direction.
BarChart Technical Analysis NITE-LYNX $ABPR
http://www.barchart.com/technicals/stocks/ABPR
TRIX Bearish Signal Line Cross: This scan reveals stocks that meet four criteria. First, they must be below their 200-day moving average to be in an overall down trend. Second, the TRIX must be positive to signal a bounce. Third, the TRIX crossed its signal line and turned down. Fourth, volume moved above the 250-day average to show an increase in selling pressure.
BarChart Technical Analysis NITE-LYNX $ZAAP
http://www.barchart.com/technicals/stocks/ZAAP
Chaikin Money Flow (CMF) is an oscillator that fluctuates between -1 and 1. Rarely, if ever, will the indicator reach these extremes. It would take 20 consecutive closes on the high (low) for 20-day Chaikin Money Flow to reach 1 (-1). Typically, this oscillator fluctuates between -.50 and .50 with zero as the center-line.
$ORGC BarChart Technical Analysis NITE-LYNX
http://www.barchart.com/technicals/stocks/ORGC
Chaikin Money Flow can be set as an indicator above or below the main window. Because it is shown in area format, it is not really suited for placement behind the security's price plot. Once the indicator is chosen from the drop down list, the default parameter appears (20). These parameters can be adjusted to increase or decrease sensitivity. Users can click on "advanced options" to add horizontal lines, moving averages or other overlays. Chartists can even plot a second and longer Chaikin Money Flow indicator on top of the other. Period's of overlap show when money flow is strong for two different periods.
|
Followers
|
3289
|
Posters
|
|
|
Posts (Today)
|
0
|
Posts (Total)
|
2804248
|
|
Created
|
08/22/10
|
Type
|
Free
|
| Moderator Nilbud | |||
| Assistants mick ManicTrader PhotoChick Kirimi $Pistol Pete$ | |||
   Investor Hub Alerts: Sign up for 'STOCKGOODIES PLAYS OF THE WEEK ' E-Mail List Investor Hub Alerts: Sign up for 'STOCKGOODIES PLAYS OF THE WEEK ' E-Mail ListUPDATE; 5-1-22 courtesy of charting /\ wit tweezer top calls /\ Tony @Montana_Trades Really good study sheet on Candlestick Patterns [-chart]pbs.twimg.com/media/FRn8188XMAAdZvk?format=jpg&name=small[/chart] 

02-07-2021
|
|
Posts Today
|
0
|
|
Posts (Total)
|
2804248
|
|
Posters
|
|
|
Moderator
|
|
|
Assistants
|
| Volume | |
| Day Range: | |
| Bid Price | |
| Ask Price | |
| Last Trade Time: |


