 News
News  Market Data
  Discover
Support: 888-992-3836
Copyright © 2023 InvestorsHub Inc.


Register for free to join our community of investors and share your ideas. You will also get access to streaming quotes, interactive charts, trades, portfolio, live options flow and more tools.
$AVXL BarChart Technical Analysis NITE-LYNX
http://www.barchart.com/technicals/stocks/AVXL

Ulcer index indicator measure the stress of holding trade and investment by simply measuring the price retracements. Ulcer Index is based in the notion which downward volatility is bad, however upward volatility is good. Unlike the standard deviation, the economic industry benchmark way of measuring risks of the stock that equally weights both increase to upside volatility and the violent decrease to downside volatility.
This link will help thou $PUDA BarChart Technical Analysis NITE-LYNX
http://www.barchart.com/technicals/stocks/PUDA
Signal line crossovers are the most common TRIX signals. The signal line is a 9-day EMA of the TRIX. As a moving average of the indicator, it trails TRIX and makes it easier to spot turns. A bullish crossover occurs when TRIX turns up and crosses above the signal line. A bearish crossover occurs when TRIX turns down and crosses below the signal line. Crossovers can last a few days or a few weeks, it all depends on the strength of the move. Due diligence is required before relying on these frequent signals. Volatility in the underlying security can also increase the number of crossovers.
Feast thine eyes upon $ACLZ BarChart Technical Analysis NITE-LYNX
http://www.barchart.com/technicals/stocks/ACLZ
. The Force Index can be used to reinforce the overall trend, identify playable corrections or foreshadow reversals with divergences.
TRIX is negative as long as the triple-smoothed 15-day EMA is moving lower. TRIX turns positive when the triple-smoothed 15-day EMA turns up. The extra smoothing insures that up turns and down turns are kept to a minimum. In other words, it takes more than a one-day advance to reverse a downtrend.
Sanp " canoe pool america"biggest bitcoin minning in US bouta run hard imo
$SOUPQ
Why watch the run... when you could cash in Big Time!
This Low Float has a big surprise in store for Smart Money
Enjoy your weekend for my disturbed friends!
JBZY multi-billion dollar conglomerate looking strong for next week.
Throw a burger on the BBQ, grab another cold one and enjoy for my Linkin Park friends. RIP Chester!
Enjoy your weekend my friends for all the parrot heads!
Mass Index Video
WATCH VIDEO - CLICK HERE <-

Learn all aspects of trading penny stocks in Chart School, Videos include;
Accumulation Distribution
ADX - Average Directional Index
Aroon
ATR - Average True Range
Bollinger %B
Bollinger Band Width
CCI - Commodity Channel Index
Chaikin Oscillator
CMF - Chaikin Money Flow
Coppock Curve
Correlation Coefficient
EMV- Ease of Movement
Fibonacci Retracement
Force Index
KST - Know Sure Thing
MACD Histogram
Mass Index
MFI - Money Flow Index
OBV - On Balance Volume
PPO - Percentage Price Oscillator
PVO - Percentage Volume Oscillator
ROC - Rate Of Change
Standard Deviation - Volatility
Stochastics RSI
Support and Resistance
TRIX
TSI - True Strength Index
Ulcer Index
Ultimate Oscillator
Volume by Price
VTX - Vortex Indicator
Williams % R
Chart Setup 1
Chart Setup 2
Chart Patterns 1
Chart Patterns 2 The Best Bullish and Bearish Patterns
Choosing Indicators
Best part is that it's all FREE!
So what are you waiting for - Get started now!
Always do your own due diligence with any stock you may consider buying and never invest more than you are willing to lose.
Stocks mentioned here may or may not be held by members posting on this board.
UHLN - look at share structure. 5x nagger next week
PPO - Percentage Price Oscillator Video
WATCH VIDEO - CLICK HERE <-
Learn all aspects of trading penny stocks in Chart School, Videos include;
Accumulation Distribution
ADX - Average Directional Index
Aroon
ATR - Average True Range
Bollinger %B
Bollinger Band Width
CCI - Commodity Channel Index
Chaikin Oscillator
CMF - Chaikin Money Flow
Coppock Curve
Correlation Coefficient
EMV- Ease of Movement
Fibonacci Retracement
Force Index
KST - Know Sure Thing
MACD Histogram
Mass Index
MFI - Money Flow Index
OBV - On Balance Volume
PPO - Percentage Price Oscillator
PVO - Percentage Volume Oscillator
ROC - Rate Of Change
Standard Deviation - Volatility
Stochastics RSI
Support and Resistance
TRIX
TSI - True Strength Index
Ulcer Index
Ultimate Oscillator
Volume by Price
VTX - Vortex Indicator
Williams % R
Chart Setup 1
Chart Setup 2
Chart Patterns 1
Chart Patterns 2 The Best Bullish and Bearish Patterns
Choosing Indicators
Best part is that it's all FREE!
So what are you waiting for - Get started now!
StockGoodies Website and Learning Center is up and running!
Learn All You Can - It's Totally FREE!!!!
http://www.stockgoodies.com
ABOUT STOCKGOODIES
They are a Community of Traders who all Share the same Addiction.....Stocks, Charting and Trading.
They Scour Charts, Scanners, News and Current Promotions for Undervalued Quality OTC Bulletin Board, Pink Sheets, Big boards, Small Cap Companies, and Option Strategies.
They do this 24-7 and offer to their members newsletter mailings, sign up at http://trumpia.com/onlineSignup/Stockgoodies/HotPennyStocks
They post here on the StockGoodies Plays of the Week board, skype chat room and their Vast Social Media Network.
TONR Chart Waitin,,,for 50MDA to Break-Above 1Year MDA
Waitin,,,for "PR"
Waitin,,,for Conference Call
Watchin,,,for .002 -.004
8K - $SGMD $30 Million Acquisition and/or Mergers
https://www.sec.gov/Archives/edgar/data/919175/000152013817000334/sgmd-20171027_8k.htm
The Company is currently in late stage negotiations to acquire or to merge with two entities, which will further the Company’s strategic product goals and its movement toward e-commerce marketing:
Major Hydroponic Goods Distributor. Sugarmade is in late stage acquisition negotiations with a major distributor of hydroponic and agricultural supplies. Under the framework of the current negotiations, Sugarmade would acquire this privately held entity through a combination of cash and Company common shares, with Sugarmade being the surviving entity. This distributor is currently producing in excess of $30 million per year in revenues, is growing rapidly, and is profitable. Company management believes the resulting entity would be one of the largest publicly traded hydroponic and cannabis related operations and that such a combination would be highly accretive and beneficial to Sugarmade shareholders. Sugarmade plans to maintain its corporate policy of doing business in only the non-plant areas of the growing cannabis sector, although this is subject to change.
Force Index Video
WATCH VIDEO - CLICK HERE <-
Learn all aspects of trading penny stocks in Chart School, Videos include;
Accumulation Distribution
ADX - Average Directional Index
Aroon
ATR - Average True Range
Bollinger %B
Bollinger Band Width
CCI - Commodity Channel Index
Chaikin Oscillator
CMF - Chaikin Money Flow
Coppock Curve
Correlation Coefficient
EMV- Ease of Movement
Fibonacci Retracement
Force Index
KST - Know Sure Thing
MACD Histogram
Mass Index
MFI - Money Flow Index
OBV - On Balance Volume
PPO - Percentage Price Oscillator
PVO - Percentage Volume Oscillator
ROC - Rate Of Change
Standard Deviation - Volatility
Stochastics RSI
Support and Resistance
TRIX
TSI - True Strength Index
Ulcer Index
Ultimate Oscillator
Volume by Price
VTX - Vortex Indicator
Williams % R
Chart Setup 1
Chart Setup 2
Chart Patterns 1
Chart Patterns 2 The Best Bullish and Bearish Patterns
Choosing Indicators
Best part is that it's all FREE!
So what are you waiting for - Get started now!
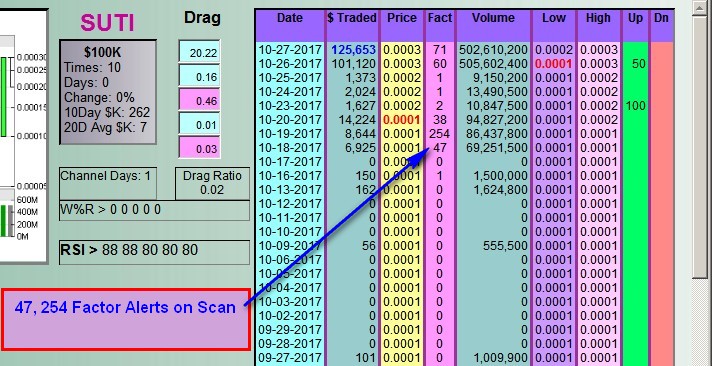
DDAmanda® Chart on: $SUTI SUTI #SUTI :
z
Bollinger %B Video
WATCH VIDEO - CLICK HERE <-
Learn all aspects of trading penny stocks in Chart School, Videos include;
Accumulation Distribution
ADX - Average Directional Index
Aroon
ATR - Average True Range
Bollinger %B
Bollinger Band Width
CCI - Commodity Channel Index
Chaikin Oscillator
CMF - Chaikin Money Flow
Coppock Curve
Correlation Coefficient
EMV- Ease of Movement
Fibonacci Retracement
Force Index
KST - Know Sure Thing
MACD Histogram
Mass Index
MFI - Money Flow Index
OBV - On Balance Volume
PPO - Percentage Price Oscillator
PVO - Percentage Volume Oscillator
ROC - Rate Of Change
Standard Deviation - Volatility
Stochastics RSI
Support and Resistance
TRIX
TSI - True Strength Index
Ulcer Index
Ultimate Oscillator
Volume by Price
VTX - Vortex Indicator
Williams % R
Chart Setup 1
Chart Setup 2
Chart Patterns 1
Chart Patterns 2 The Best Bullish and Bearish Patterns
Choosing Indicators
Best part is that it's all FREE!
So what are you waiting for - Get started now!
Correlation Coefficient
WATCH VIDEO - CLICK HERE <-
Learn all aspects of trading penny stocks in Chart School, Videos include;
Accumulation Distribution
ADX - Average Directional Index
Aroon
ATR - Average True Range
Bollinger %B
Bollinger Band Width
CCI - Commodity Channel Index
Chaikin Oscillator
CMF - Chaikin Money Flow
Coppock Curve
Correlation Coefficient
EMV- Ease of Movement
Fibonacci Retracement
Force Index
KST - Know Sure Thing
MACD Histogram
Mass Index
MFI - Money Flow Index
OBV - On Balance Volume
PPO - Percentage Price Oscillator
PVO - Percentage Volume Oscillator
ROC - Rate Of Change
Standard Deviation - Volatility
Stochastics RSI
Support and Resistance
TRIX
TSI - True Strength Index
Ulcer Index
Ultimate Oscillator
Volume by Price
VTX - Vortex Indicator
Williams % R
Chart Setup 1
Chart Setup 2
Chart Patterns 1
Chart Patterns 2 The Best Bullish and Bearish Patterns
Choosing Indicators
Best part is that it's all FREE!
So what are you waiting for - Get started now!
Sign Up For StockGoodies Board Mail Here:
Ihub Mailer http://bit.ly/PnsdN5
Bollinger Band Width Video
WATCH VIDEO - CLICK HERE <-
Learn all aspects of trading penny stocks in Chart School, Videos include;
Accumulation Distribution
ADX - Average Directional Index
Aroon
ATR - Average True Range
Bollinger %B
Bollinger Band Width
CCI - Commodity Channel Index
Chaikin Oscillator
CMF - Chaikin Money Flow
Coppock Curve
Correlation Coefficient
EMV- Ease of Movement
Fibonacci Retracement
Force Index
KST - Know Sure Thing
MACD Histogram
Mass Index
MFI - Money Flow Index
OBV - On Balance Volume
PPO - Percentage Price Oscillator
PVO - Percentage Volume Oscillator
ROC - Rate Of Change
Standard Deviation - Volatility
Stochastics RSI
Support and Resistance
TRIX
TSI - True Strength Index
Ulcer Index
Ultimate Oscillator
Volume by Price
VTX - Vortex Indicator
Williams % R
Chart Setup 1
Chart Setup 2
Chart Patterns 1
Chart Patterns 2 The Best Bullish and Bearish Patterns
Choosing Indicators
Best part is that it's all FREE!
So what are you waiting for - Get started now!
$SOUPQ
Dropping the Q
Mega runner here after the 31st and beyond
Can run .50+
Daily Candlestick Chart for CMRZF
[img]stockcharts.com/c-sc/sc?s=CMRZF
Bailout: A bailout is a financial term referring to an extraordinary act of lending, or outright giving, capital to an entity (a company, bank, individual, etc.) that is in danger of failure due to bankruptcy or insolvency. A bailout can also be given to a failing entity to allow it to exit gracefully without leading to a contagion.

Subjectivity
Fair value is based on assumptions. Any changes to growth or multiplier assumptions can greatly alter the ultimate valuation. Fundamental analysts are generally aware of this and use sensitivity analysis to present a base-case valuation, an average-case valuation and a worst-case valuation. However, even on a worst-case valuation, most models are almost always bullish, the only question is how much so. The chart below shows how stubbornly bullish many fundamental analysts can be.

Daily Candlestick Chart for AMNF
[img]stockcharts.com/c-sc/sc?s=AMNF
Volume will (should) pick up significantly, for not only the increased enthusiasm, but many are holding positions on the wrong side of the breakout and need to cover or sell them. It is better if the volume does not happen until the gap occurs. This means that the new change in market direction has a chance of continuing. The point of breakout now becomes the new support (if an upside breakout) or resistance (if a downside breakout). Don't fall into the trap of thinking this type of gap, if associated with good volume, will be filled soon. It might take a long time. Go with the fact that a new trend in the direction of the stock has taken place, and trade accordingly. Notice in the chart below how prices spent over 2 months without going lower than about 41. When they did, it was with increased volume and a downward breakaway gap.

General Motors Corp. (GM) Breakaway Gap example chart from StockCharts.com
A good confirmation for trading gaps is if they are associated with classic chart patterns. For example, if an ascending triangle suddenly has a breakout gap to the upside, this can be a much better trade than a breakaway gap without a good chart pattern associated with it. The chart below shows the normally bullish ascending triangle (flat top and rising, lower trend line) with a breakaway gap to the upside, as you would expect with an ascending triangle.

Ambac Financial Group, Inc. (ABK) Breakaway Gap example chart from StockCharts.com
Bolivia Bolivianos: The currency of Bolivia. Currency code (BOB)
Daily Candlestick Chart for MNLU
[img]stockcharts.com/c-sc/sc?s=MNLU
Many people simply buy stocks that are recommended to them by their brokerages, their friends, or experts from TV, magazines, and newspapers.
Durable Goods Order: A key indicator of future manufacturing activity. This goverment index measures the dollar volume of orders, shipments, and unfilled orders of durable goods. Durable goods are new or used items generally with a normal life expectancy of three years or more.
Daily Candlestick Chart for TDEY
[img]stockcharts.com/c-sc/sc?s=TDEY
General Steps to Technical Evaluation
Many technicians employ a top-down approach that begins with broad-based macro analysis. The larger parts are then broken down to base the final step on a more focused/micro perspective. Such an analysis might involve three steps:
Broad market analysis through the major indices such as the S
Cleared Funds: Funds that are freely available.
Daily Candlestick Chart for ABOT
[img]stockcharts.com/c-sc/sc?s=ABOT
What is a dividend?
A dividend is money that a company gives to its shareholders when it has extra profit. Since the shareholders own the company, they deserve its profits. However, sometimes companies want to use these profits to help grow their business and decide not to distribute dividends, at least for a while.
Cable: Slang for the GBPUSD currency pair. Due to the rate originally being transmitted by a transatlantic cable, the name stuck.
Daily Candlestick Chart for MMAB
[img]stockcharts.com/c-sc/sc?s=MMAB
What is Fundamental Analysis?
Fundamental analysis is the examination of the underlying forces that affect the well being of the economy, industry groups, and companies. As with most analysis, the goal is to derive a forecast and profit from future price movements. At the company level, fundamental analysis may involve examination of financial data, management, business concept and competition. At the industry level, there might be an examination of supply and demand forces for the products offered. For the national economy, fundamental analysis might focus on economic data to assess the present and future growth of the economy. To forecast future stock prices, fundamental analysis combines economic, industry, and company analysis to derive a stock's current fair value and forecast future value. If fair value is not equal to the current stock price, fundamental analysts believe that the stock is either over or under valued and the market price will ultimately gravitate towards fair value. Fundamentalists do not heed the advice of the random walkers and believe that markets are weak-form efficient. By believing that prices do not accurately reflect all available information, fundamental analysts look to capitalize on perceived price discrepancies.
Bank of England (BOE) Rate Decision: Release schedule : 11:00 AM GMT (about 7:00 AM EST); Monthly in the first or second week.
Source of report : Bank of England Monetary Policy Committee
Web Address : http://www.bankofengland.co.uk
Address of release : http://www.bankofengland.co.uk/monetarypolicy/decisions.htm
Daily Candlestick Chart for ASIBY
[img]stockcharts.com/c-sc/sc?s=ASIBY
|
Followers
|
3289
|
Posters
|
|
|
Posts (Today)
|
0
|
Posts (Total)
|
2804248
|
|
Created
|
08/22/10
|
Type
|
Free
|
| Moderator Nilbud | |||
| Assistants mick ManicTrader PhotoChick Kirimi $Pistol Pete$ | |||
   Investor Hub Alerts: Sign up for 'STOCKGOODIES PLAYS OF THE WEEK ' E-Mail List Investor Hub Alerts: Sign up for 'STOCKGOODIES PLAYS OF THE WEEK ' E-Mail ListUPDATE; 5-1-22 courtesy of charting /\ wit tweezer top calls /\ Tony @Montana_Trades Really good study sheet on Candlestick Patterns [-chart]pbs.twimg.com/media/FRn8188XMAAdZvk?format=jpg&name=small[/chart] 

02-07-2021
|
|
Posts Today
|
0
|
|
Posts (Total)
|
2804248
|
|
Posters
|
|
|
Moderator
|
|
|
Assistants
|
| Volume | |
| Day Range: | |
| Bid Price | |
| Ask Price | |
| Last Trade Time: |


