 News
News  Market Data
  Discover
Support: 888-992-3836
Copyright © 2023 InvestorsHub Inc.


Register for free to join our community of investors and share your ideas. You will also get access to streaming quotes, interactive charts, trades, portfolio, live options flow and more tools.
Use PennyStock Tweets For All Your $CRCUF DD
http://www.pennystocktweets.com/stocks/profile/CRCUF

Knowing a little bit about the fundamentals — those basic facts that affect the supply and demand for a security in all markets — can help the day trader respond better to news events. It can also give you a better feel for when swing trading (holding a position for several days) will generate a better profit than closing out every night. But knowing a lot can drag a day trader down.
The most recurring height (value) would be in the middle and the remaining heights would be equally distributed on either side. Furthermore, 68.5% of all values would fall within ±1 standard deviation of the mean, 95.4% would fall within ±2 standard deviations and 99.7% would fall within ±3 standard deviations. The solid black line shows a typical bell curve with a normal distribution


Form 11-K, 11-K/A ~ SEC Filings Explained
Annual report of employee stock purchase, savings and similar plans (and amendment thereto)

$DUSS Profile on PST - For All Your DD Use More http://www.pennystocktweets.com/stocks/stockprofile/DUSS
The simplest and most common type of stock trade is a market order. Market orders simply tell your broker that you are willing to take whatever price is presented to you when your order is executed. These orders are often subject to the lowest commission since they are the easiest to execute. 
Trading Range
Trading ranges can play an important role in determining support and resistance as turning points or as continuation patterns.
Form S-6 ~ SEC Filings Explained
Initial registration statement filed on Form S-6 for unit investment trusts
Use PennyStock Tweets For All Your $CRTP DD
http://www.pennystocktweets.com/stocks/profile/CRTP
In the beginning, reduce the use of margin. Although trading with margin looks very tempting, you must remember that until you have become fully skillful in the stock market trading, handling your feeling, or charts you should never go after it. By the time margin is capable of giving you greater profits, it has the advantage. However, remember that it can also eliminate your account causing you the disadvantages.
In other words, one would have left a lot of money on the table by selling in early 2005 or one would have gone broke shorting stocks in early 2005. To his credit, Shiller does provide evidence of past mispricing in the stock market. It can and does happen.
Pivot Points ~ Time Frames
Pivot Points for 1, 5, 10 and 15 minute charts use the prior day's high, low and close. In other words, Pivot Points for today's intraday charts would be based solely on yesterday's high, low and close. Once Pivot Points are set, they do not change and remain in play throughout the day.

Pivot Points for 30 and 60 minute charts use the prior week's high, low and close. These calculations are based on calendar weeks. Once the week starts, the Pivot Points for 30 and 60 minute charts remain fixed for the entire week. They do not change until the week ends and new Pivots can be calculated.

Pivot Points for daily charts use the prior month's data. Pivot Points for June 1st would be based on the high, low and close for May. They remain fixed the entire month of June. New Pivot Points would be calculated on the first trading day of July. These would be based on the high, low and close for June.

Pivot Points for weekly and monthly charts use the prior year's data.
Trading in penny stocks tends to attract the interest of newbie investors because it can seem accessible thanks to the small amounts of money needed to make a first purchase. The mistake many make however is having the false hope that they can magically hit it rich with some awesome penny stocks as soon as they get started. They can become greedy, lose all their money very quickly and then become disillusioned with the whole thing.
More On $CHBO At PennyStock Tweets
http://www.pennystocktweets.com/stocks/profile/CHBO
Form N-1A ~ SEC Filings Explained
Initial registration statement for open-end management investment companies
Line charts are also used when open, high and low data points are not available. Sometimes only closing data are available for certain indices, thinly traded stocks and intraday prices.
Successful traders buy into bad news and sell into good news.
More On $FROG At PennyStock Tweets
http://www.pennystocktweets.com/stocks/profile/FROG
Form F-7 ~ SEC Filings Explained
Registration statement for securities of certain Canadian issuers offered for cash upon the exercise of rights granted to existing security holders
Once the price breaks below a support level, the broken support level can turn into resistance.
A crucial break of support and resistance points must be located to get the best result.
$CLNP Profile on PST - For All Your DD Use More http://www.pennystocktweets.com/stocks/stockprofile/CLNP
SEC Filings Explained ~ F-1
Registration statement for certain foreign private issuers.
Good stories replaced hard news. Increased media exposure led to more advertising and this simply fed the public appetite for stocks. The media continues to pour it one with Mad Money debuting in 2005
Use PennyStock Tweets For All Your $TNEN DD
http://www.pennystocktweets.com/stocks/profile/TNEN
Schedule 13G Definition the party must own between 5% and 20% in the company. It must also be clearly understood that the party acquiring the stake in the company is only a passive investor, and does not intend to exert control.
BLACK SPINNING TOP
The Black Spinning Top is a single candlestick pattern. Its shape is a small black body with upper and lower shadows having a greater length than the body's length.
Recognition Criteria:
1. The real body of the pattern is black and small.
2. The upper and lower shadows are longer than the real body's length.
Explanation:
The market moves higher and then sharply lower, or vice versa. It then closes below the opening price creating a black body. This represents complete indecision between the bulls and the bears. The actual length of the shadows is not important. The small body relative to the shadows is what makes the spinning top.
Important Factors:
If a Black Spinning Top is observed after a long rally or long white candlestick, this implies weakness among the bulls and it is a warning about a potential change or interruption in trend.
If a Black Spinning Top is observed after a long decline or a long black candlestick, this implies weakness among the bears and it is a warning about a potential change or interruption in trend.
Like most other single candlestick patterns, the Black Spinning Top has low reliability. It reflects only one day's trading and can be interpreted both as a continuation and a reversal pattern. This pattern must be used with other candlesticks for a better and healthier confirmation of a trend.
Investors make decision based on "good stories" or stories that seem logical. Because people get their information from the same sources, there is little or no evidence of independent behavior. Instead, individuals getting the same information react the same way to produce a herd mentality.

An understanding of mass psychology is often more important than an understanding of economics. Markets are driven by human beings making human errors and also making super-human insights.
Use PennyStock Tweets For All Your $GDNEF DD
http://www.pennystocktweets.com/stocks/profile/GDNEF
LONG LEGGED DOJI
Long Legged Doji is a doji characterized with very long shadows. It shows the indecision of the buyers and sellers. It is one of the important reversal signals.

Recognition Criteria:
1. Market is characterized by a bearish mood and downtrend.
2. Then we see a Doji that gaps in the direction of the downtrend.
3. The real body is either a horizontal line or it is significantly small.
4. Both of the upper and lower shadows are long and they are almost equal in length.
Explanation:
Long Legged Doji shows that there is a great deal of confusion and indecision in the market. This particular pattern shows that the prices moved well above and below the day's opening level, however they finally closed virtually at the same level with the opening price. The end result is only a little change from the opening price despite the whole volatility and excitement during the day that clearly reflects that the market lost its sense of direction.
Important Factors:
Long Legged Doji is more important at tops.
Long Legged Doji is a single candlestick pattern. It requires confirmation in the form of a move opposite to the prior trade on the next trading day.
After each bounce off support, the stock traded all the way up to resistance. Resistance was first established by the September support break at 42.5.
Continually strive for patience, perseverance, determination, and rational action.
Use PennyStock Tweets For All Your $PDOS DD
http://www.pennystocktweets.com/stocks/profile/PDOS
Form 10-12G, 10-12G/A ~ SEC Filings Explained
Initial general form for registration of a class of securities pursuant to section 12(g) (and amendment thereto)
There are clear relationships between stocks and bonds, bonds and commodities, and commodities and the Dollar. Knowing these relationships can help chartists determine the stage of the investing cycle, select the best sectors and avoid the worst performing sectors. Much of the material for this article comes from John Murphy's book and his postings in the Market Message at Stockcharts.com.

As a beginner, set up a cash account, not a margin account.
$EXPU Profile on PST - For All Your DD Use More http://www.pennystocktweets.com/stocks/stockprofile/EXPU
BEARISH MEETING LINES
Market may gap up sharply as it opens but it closes unchanged from the prior session’s close during an uptrend. Such a pattern is called Bearish Meeting Lines Pattern, which is a pattern that reflects a balance between the bulls and the bears.

Recognition Criteria:
1. Market is characterized by uptrend.
2. We see a long white candlestick in the first day.
3. Then we see a long black candlestick, which has a body that is also higher than the previous trend on the second day.
4. The close of both days is same or almost same.
5. Both of the candlesticks are long but second day candlestick may be shorter than the first.
Explanation:
The Bearish Meeting Lines Pattern is a top reversal pattern suggesting a stall in uptrend. The first candlestick, a long white one, shows that the bullish momentum is going on. The next day opens higher with a gap but then the bears pull prices down to the prior day’s close. So the initial optimism on the second day’s opening now turns into concern of the longs.
Important Factors:
The Bearish Meeting Lines Pattern is similar to the Bearish Dark Cloud Cover Pattern. The Dark Cloud Cover has the same two-candlestick pattern. The main difference between the two is the fact that the bearish counterattack line does not usually move into the prior session’s white real body. It just gets back to prior session’s close. The Bearish Dark Cloud Cover Pattern’s second line pushes well into the white real body. So the Dark Cloud Cover Pattern is a more important top reversal signal than the Bearish Meeting Lines Pattern.
A confirmation on third day is required to be sure that the uptrend has reversed. This confirmation may be in the form a black candlestick, a large gap down or a lower close on the third day.
Technology stocks are not far behind. These two groups are the big leaders at the beginning of a bull run in the stock market.
The key is for individual trader to take the initiative to learn how to Trade, Invest, and Prosper from the Plentiful Profit Opportunities that penny stocks offer! A 100% Gain (or a double) is considered a Home Run when investing in NYSE and NASDAQ stocks. While 100% is a nice gain, only penny stocks offer on the opportunity to make 1,000% Plus Grand Slam Gains (ten bagger), which is why so many people trade in penny stocks!Stockgoodies takes the guessing game out of penny stock trading and finds the penny stocks that have the potential to make Big Gains!
More On $EWRL At PennyStock Tweets
http://www.pennystocktweets.com/stocks/profile/EWRL
Simple Moving Average or (SMA)
The SMA does not predict the price direction but it smooths out the price action to give a trend indication.
Moving averages are lagging indicators because they are based on past prices. Despite this lag, moving averages help smooth price action and filter out the noise. They are also used to form the building blocks for many other technical indicators and overlays, such as Bollinger Bands, MACD and the McClellan Oscillator. Moving averages can be used to identify the direction of the trend or define potential support and resistance levels.
Here's a chart with a 5 day SMA on it:
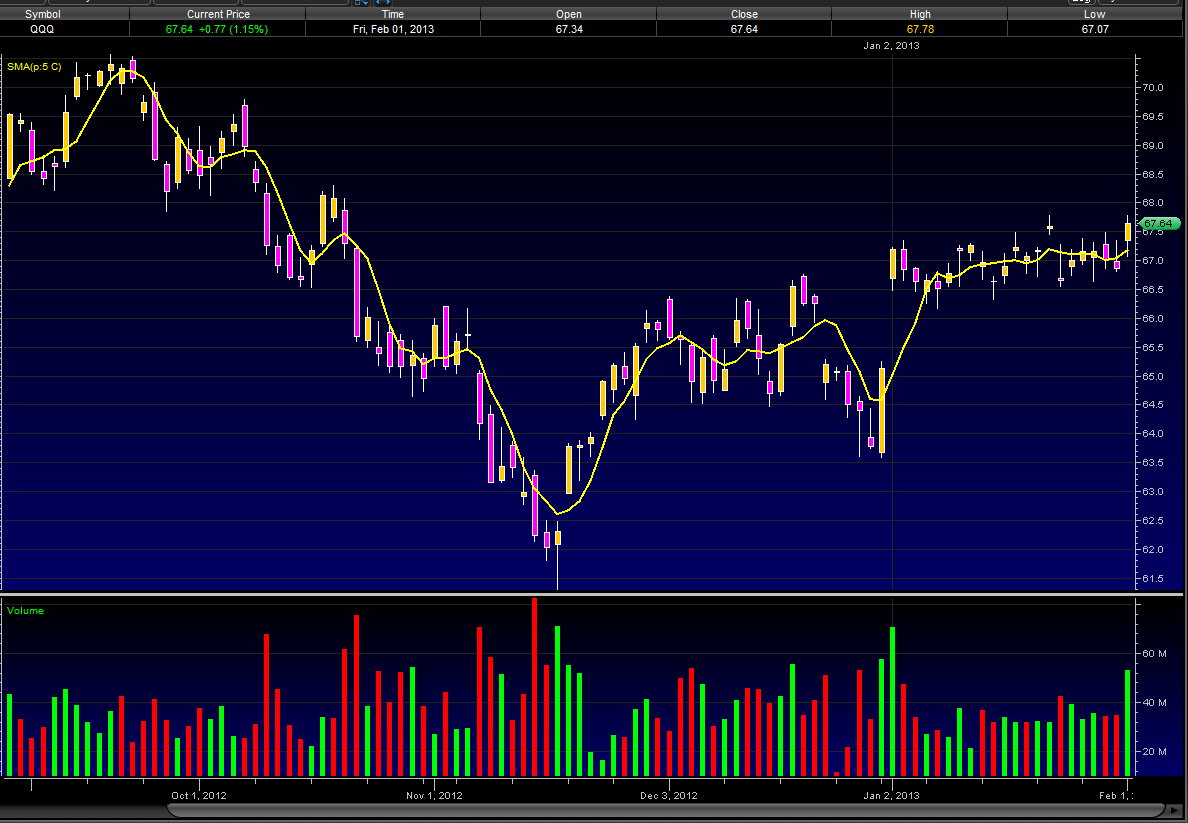
A simple moving average is made by calculating the average price of a security over a specific number of closing costs. The SMA will reflect the average closing cost, based on the time line of the chart you are looking at. i.e.: A 5 SMA on a daily chart will plot a line showing the average closing daily price, on a 60 minute chart that 5 SMA will plot a line showing the average hourly closing price. If the closing price changes so too does the SMA, hence the Moving part of Simple Moving Average. Old data is dropped and new data is added as it comes and goes, making the average move along the timeline. For those who need a visual take a look at how a SMA is plotted.
We will start our SMA on day 5
Daily Closing Prices:
Day 1 ------ 10
Day 2 ------ 12
Day 3 ------ 11
Day 4 ------ 14
Day 5 ------ 13
Day 6 ------ 15
Day 7 ------ 18
Day 8 ------ 19
SMA Plot points:
Day 5 ---- 10 12 11 14 13(closing price each day, 1 through 5) = 60 /5(# of days) = SMA of 12
Day 6 ---- Drop the 10 from day 1 and add the 15 from day 6 = 65 /5 = 13
Day 7 ---- Drop the 12 from day 2 and add 18 from day 7 = 71 /5 = 14.2
Day 8 ---- Drop the 11 from day 3 and add 19 from day 8 = 79 /5 = 15.8
Random Walk vs Non-Random Walk
Pfizer (PFE) shows an example of three sizable trends emerging over a two year period. The stock was up over 50% in 2009, down around 25% in the first half of 2010 and up around 50% from July 2010 to March 2011.

Form N-14 ~ SEC Filings Explained
Initial registration statement for open-end investment company
The chart above shows this ratio with the S
Force Index Technical Indicator was developed by Alexander Elder. This index measures the Bulls Power at each increase, and the Bulls Power at each decrease. It connects the basic elements of market information: price trend, its drops, and volumes of transactions.
BarChart Technical Analysis NITE-LYNX $ISHI
http://www.barchart.com/technicals/stocks/ISHI

The Chaikin Money Flow (CMF) measures the amount of money flow over time. CMF is used to study the volume of money flow and form the basis for an Accumulation Distribution Line. The Chaikin Money Flow does not tally a cumulative total money flow volume instead it simply sums the money flow volume for a specific trading period.
$APRU BarChart Technical Analysis NITE-LYNX
http://www.barchart.com/technicals/stocks/APRU
|
Followers
|
3289
|
Posters
|
|
|
Posts (Today)
|
0
|
Posts (Total)
|
2804248
|
|
Created
|
08/22/10
|
Type
|
Free
|
| Moderator Nilbud | |||
| Assistants mick ManicTrader PhotoChick Kirimi $Pistol Pete$ | |||
   Investor Hub Alerts: Sign up for 'STOCKGOODIES PLAYS OF THE WEEK ' E-Mail List Investor Hub Alerts: Sign up for 'STOCKGOODIES PLAYS OF THE WEEK ' E-Mail ListUPDATE; 5-1-22 courtesy of charting /\ wit tweezer top calls /\ Tony @Montana_Trades Really good study sheet on Candlestick Patterns [-chart]pbs.twimg.com/media/FRn8188XMAAdZvk?format=jpg&name=small[/chart] 

02-07-2021
|
|
Posts Today
|
0
|
|
Posts (Total)
|
2804248
|
|
Posters
|
|
|
Moderator
|
|
|
Assistants
|
| Volume | |
| Day Range: | |
| Bid Price | |
| Ask Price | |
| Last Trade Time: |


