 News
News  Market Data
  Discover
Support: 888-992-3836
Copyright © 2023 InvestorsHub Inc.


Register for free to join our community of investors and share your ideas. You will also get access to streaming quotes, interactive charts, trades, portfolio, live options flow and more tools.
The resistance level of the trading range was well marked by three reaction peaks at 47.5. The support level was not as clearly marked, but appeared to be between 40 and 41.
M-Tops Using Bollinger Bands
M-Tops were also part of Arthur Merrill's work that identified 16 patterns with a basic M shape. Bollinger uses these various M patterns with Bollinger Bands to identify M Bottoms. According to Bollinger, tops are usually more complicated and drawn out than bottoms. Double tops, head-and-shoulders patterns and diamonds represent evolving tops.
In its most basic form, an M-Top is similar to a double top. However, the reaction highs are not always equal. The first high can be higher or lower than the second high. Bollinger suggests looking for signs of non-confirmation when a security is making new highs. This is basically the opposite of the W-Bottom. A non-confirmation occurs with three steps. First, a security forges a reaction high above the upper band. Second, there is a pullback towards the middle band. Third, prices move above the prior high, but fail to reach the upper band. This is a warning sign. The inability of the second reaction high to reach the upper band shows waning momentum, which can foreshadow a trend reversal. Final confirmation comes with a support break or bearish indicator signal.

The chart shows Exxon Mobil (XOM) with an M-Top in April-May 2008. The stock moved above the upper band in April. There was a pullback in May and then another push above 90. Even though the stock moved above the upper band on an intraday basis, it did not CLOSE above the upper band. The M-Top was confirmed with a support break two weeks later. Also notice that MACD formed a bearish divergence and moved below its signal line for confirmation.

Check Out $PROP On PennyStock Tweets
http://www.pennystocktweets.com/stocks/profile/PROP

Only price movements that exceed specified levels are recorded. This focus on price movement makes it easier to identify support and resistance levels, bullish breakouts and bearish breakdowns. This P
Form N-8B-2 ~ SEC Filings Explained
Initial registration statement for unit investment trusts
Use PennyStock Tweets For All Your $RNDR DD
http://www.pennystocktweets.com/stocks/profile/RNDR
Bar charts can also be displayed using the open, high, low and close. The only difference is the addition of the open price, which is displayed as a short horizontal line extending to the left of the bar. Whether or not a bar chart includes the open depends on the data available.

Form 6-K~ SEC Filings Explained
Form 6K is an SEC filing submitted to the US Securities and Exchange Commission used by certain foreign private issuers to provide information that is:
? Required to be made public in the country of its domicile
? Filed with and made public by a foreign stock exchange on which its securities are traded
? Are distributed to security holders.
The report must be furnished promptly after such material is made public. The form is not considered "filed" because of Section 18 (for liability purposes). This is the only information furnished by foreign private issuers between annual reports, since such issuers are not required to file on Forms 10-Q or 8-K.
Some investors and traders consider the closing level to be more important than the open, high or low. By paying attention to only the close, intraday swings can be ignored.
For All Your $BBDA DD ~ Use PennyStock Tweets
http://www.pennystocktweets.com/stocks/profile/BBDA
SEC Filings Explained ~ POS AM Form
Post-effective amendments to provide updated prospectus information.
Check Out $RYPE On PennyStock Tweets
http://www.pennystocktweets.com/stocks/profile/RYPE
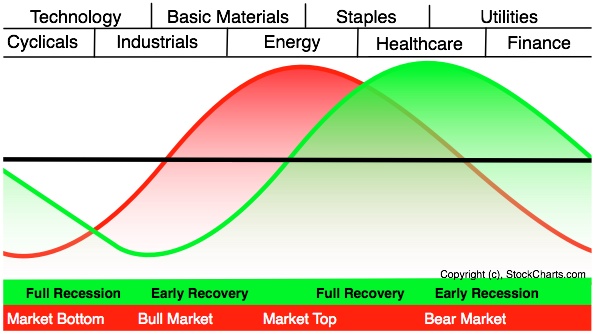
Cyclicals, which is the same as the consumer discretionary sector, are the first to turn up in anticipation of a bottom in the economy.

Form 13F-NT, 13F-NT/A ~ SEC Filings Explained
Initial Quarterly Form 13F Notice Report filed by institutional managers (and amendment thereto)
The more creativity you bring to the investment process, the more rewarding it will be. The only way to maintain ongoing success, however, is to constantly innovate.
Check Out $CLKTF On PennyStock Tweets
http://www.pennystocktweets.com/stocks/profile/CLKTF
Form T-3 ~ SEC Filings Explained
Initial application for qualification of trust indentures
Stage 1 shows the economy contracting and bonds turning up as interest rates decline. Economic weakness favors loose monetary policy and the lowering of interest rates, which is bullish for bonds.
Check Out $SRGE On PennyStock Tweets
http://www.pennystocktweets.com/stocks/profile/SRGE
Check Out $UCHC On PennyStock Tweets
http://www.pennystocktweets.com/stocks/profile/UCHC
Issuers of ETFs
? AdvisorShares issues actively managed ETFs.
? Bips Investment Managers issues Bips (Beta Investment Performance Securities).
? BNP Paribas issues EasyETFs.
? BlackRock issues iShares.
? Charles Schwab offers several commission-free ETFs for its clients.
? Deutsche Bank issues db x-trackers ETFs, as well as managing PowerShares DB commodity- and currency-based ETFs.
? ETF Securities issues ETFs or specialised commodity ETCs.
? Global X Funds issues ETFs.
? Guggenheim Funds issues specialty Guggenheim Funds ETFs.
? Invesco issues PowerShares ETFs, as well as BLDRS based on American Depositary Receipts.
? Lyxor Asset Management issues Lyxor ETFs.
? Merrill Lynch issues HOLDRs.
? Source UK Services, a European joint-venture between Bank of America Merrill Lynch, Goldman Sachs, Morgan Stanley, Nomura and J. P. Morgan issues ETFs and ETCs
? State Street Global Advisors issues SPDRs.
? Van Eck Global issues Market Vectors ETFs.
? Vanguard Group issues Vanguard ETFs, formerly known as VIPERs.
The media fed this infatuation with increased coverage. Dinner party conversations invariably turned to the stock market. Stock tips and advice were also readily shared among acquaintances.
Form S-6 ~ SEC Filings Explained
Initial registration statement filed on Form S-6 for unit investment trusts
$NFDS Profile on PST - For All Your DD Use More http://www.pennystocktweets.com/stocks/stockprofile/NFDS
The break of support signals that the forces of supply have overcome the forces of demand.
Form N-30D ~ SEC Filings Explained
Initial annual and semi-annual reports mailed to investment company shareholders
$GORXQ Profile on PST - For All Your DD Use More http://www.pennystocktweets.com/stocks/stockprofile/GORXQ
This means a relatively high number of returns fall outside the normal distribution. Some are lower and some are higher. These abnormal returns provide evidence of extended moves, outsized moves or trends. Note that the image above is just a hypothetical example to illustrate a point.
BEARISH TWO CROWS
During an uptrend we see the market closing lower after an opening gap. Then we see a black day that fills the gap creating the Bearish Two Crows Pattern. It suggests the erosion of the uptrend, and warns about a possible trend reversal.

Recognition Criteria:
1. Market is characterized by uptrend.
2. We see a long white candlestick in the first day.
3. Then we see a black candlestick on the second day characterized by a gap up.
4. Finally we see a black candlestick whose opening price is inside the body of the second day and which closes inside the body of the first day.
Explanation:
In the Two Crows bear pattern, the market is already in an extended uptrend. We see a gap in the opening of the second day. This higher opening is followed by a lower close in this second day warning that there is some weakness in the rally. The third day also opens at a higher price, but not above the open of the previous day, and then prices go down with a close well within the body of the first day. This third day action fills the gap of the second day. It shows that the bullishness started to erode quickly.
Important Factors:
A confirmation on the fourth day is required to show that the uptrend has reversed. This confirmation may be in the form of a black candlestick, a large gap down or a lower close on the fourth day.
For All Your $PARA DD ~ Use PennyStock Tweets
http://www.pennystocktweets.com/stocks/profile/PARA
The speculative bubble was clearly aided and abetted by the news media. Newspapers, television, radio and Internet media compete for public attention.
Hanging Man
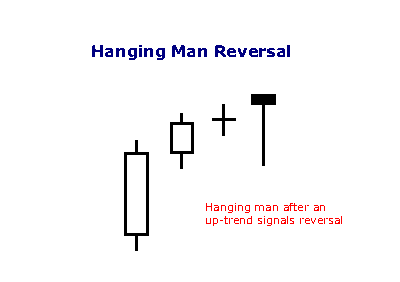
A hammer that occurs after an up trend is called a 'hanging man' and is a bearish signal.
Check Out $UYMG On PennyStock Tweets
http://www.pennystocktweets.com/stocks/profile/UYMG
Stocks in the consumer staples sector represent products that are necessary, such as soap, toothpaste, groceries, beverages and medicine. The consumer discretionary sector tends to outperform when the economy is buoyant and growing. This sector underperforms when the economy is struggling or contracting.
More On $ARAH At PennyStock Tweets
http://www.pennystocktweets.com/stocks/profile/ARAH
Form 8-K~ SEC Filings Explained
Form 8-K is a very broad form used to notify investors of any material event that is important to shareholders or the United States Securities and Exchange Commission. This is one of the most common types of forms filed with the SEC. After a significant event like bankruptcy or departure of a CEO, a public company generally must file a Current Report on Form 8-K within four business days to provide an update to previously filed quarterly reports on Form 10-Qand/or Annual Reports on Form 10-K. Form 8-K is required to be filed by public companies with the SEC pursuant to the Securities Exchange Act of 1934, as amended. For a list of events that would trigger a Form 8-K to be filed, see the Official SEC Form 8-K Summary, reproduced below.
When Form 8-K is required
Form 8-K is used to notify investors of a current event. These types of events include:
? Material definitive agreements not made in the ordinary course of business
? Bankruptcies or receiverships
? Director is elected
? Director departs
? If a director departs because of a disagreement with the company on any matter relating to the registrant’s operations, policies, or practices then an 8-K must be filed to disclose a brief description of the circumstances representing the disagreement.[1]
? Asset movement: acquisition or sale
? Result of operations and financial condition
? Material Direct Financial obligations (bonds, debentures)
? Triggering events that accelerate material obligations (defaults on a loan)
? Exit or disposal plans
? Layoffs
? shutting down a plant
? material change in services or outlets
? Material impairments
? Delisting or transfer exchange notices
? Unregistered equity sales
? Modifications to shareholder rights
? Change in accountant - and good idea to explain why
? SEC investigations and internal reviews
? Financial non-reliance notices
? Changes in control of the company
? Someone takes a large equity position (more than 15%); shareholder also needs to file with SEC as to intent
? Someone takes a 51% position
? Changes in executive management
? Officer leaves
? Officer is fired
? Officer is hired
? Departure or appointment of company officers
? Amendments to company Governance Policies
? Code of Ethics
? Board Committee Governance Policies
? Trading suspension
? Change in credit
? Change in company status
? Other events
? Financial exhibits
Investors should always read any 8-K filings that are made by companies in which they are invested. These reports are both material and relevant to the company, and often contain information that will affect the share price.
Reading Form 8K
Typically an 8-K filing will only have two major parts. They are:
? The name and description of the event - this contains all the information that the company considers relevant to shareholders and the SEC. It is important to read this information, as it has been deemed "material" by the company.
? Any exhibits that are relevant - these exhibits may include financial statements, press releases, data tables, or other information that is referenced in the description of the event.
The ratio of industrial metal prices to bond prices will rise when economic strength and inflation are prevalent. This ratio will decline when the economic weakness and deflation are dominant.

Form N-6 ~ SEC Filings Explained
Registration statement for separate accounts
Use PennyStock Tweets For All Your $SRCH DD
http://www.pennystocktweets.com/stocks/profile/SRCH
Sector Rotation
Unsurprisingly, the business cycle influences the rotation of stock market sectors and industry groups. Certain sectors perform better than others during specific phases of the business cycle. Knowing the stage of the business cycle can help investors position themselves in the right sectors and avoid the wrong
sectors.
Keltner Channels
Introduction
Keltner Channels are volatility-based envelopes set above and below an exponential moving average. This indicator is similar to Bollinger Bands, which use the standard deviation to set the bands. Instead of using the standard deviation, Keltner Channels use the Average True Range (ATR) to set channel distance. The channels are typically set two Average True Range values above and below the 20-day EMA. The exponential moving average dictates direction and the Average True Range sets channel width. Keltner Channels are a trend following indicator used to identify reversals with channel breakouts and channel direction. Channels can also be used to identify overbought and oversold levels when the trend is flat.
In his 1960 book, How to Make Money in Commodities, Chester Keltner introduced the "Ten-Day Moving Average Trading Rule," which is credited as the original version of Keltner Channels. This original version started with a 10-day SMA of the typical price {(H L C)/3)} as the centerline. The 10-day SMA of the High-Low range was added and subtracted to set the upper and lower channel lines. Linda Bradford Raschke introduced the newer version of Keltner Channels in the 1980s. Like Bollinger Bands, this new version used a volatility based indicator, Average True Range (ATR), to set channel width. StockCharts.com uses this newer version of Keltner Channels.
Calculation
There are three steps to calculating Keltner Channels. First, select the length for the exponential moving average. Second, choose the time periods for the Average True Range (ATR). Third, choose the multiplier for the Average True Range.
Middle Line: 20-day exponential moving average
Upper Channel Line: 20-day EMA (2 x ATR(10))
Lower Channel Line: 20-day EMA - (2 x ATR(10)
Because moving averages lag price, a longer moving average will have more lag and a shorter moving average will have less lag. ATR is the basic volatility setting. Short timeframes, such as 10, produce a more volatile ATR that fluctuates as 10-period volatility ebbs and flows. Longer timeframes, such a 100, smooth these fluctuations to produce a more constant ATR reading. The multiplier has the most affect on the channel width. Simply changing from 2 to 1 will cut channel width in half. Increasing from 2 to 3 will increase channel width by 50%.

The chart above shows the default Keltner Channels in red, a wider channel in blue and a narrower channel in green. The blue channels were set three Average True Range values above and below (3 x ATR). The green channels used one ATR value. All three share the 20-day EMA, which is the dotted line in the middle. The indicator windows show differences in the Average True Range (ATR) for 10 periods, 50 periods and 100 periods. Notice how the short ATR (10) is more volatile and has the widest range. In contrast, 100-period ATR is much smoother with a less volatile range.
Interpretation
Indicators based on channels, bands and envelopes are designed to encompass most price action. Therefore, moves above or below the channel lines warrant attention because they are relatively rare. Trends often start with strong moves in one direction or another. A surge above the upper channel line shows extraordinary strength, while a plunge below the lower channel line shows extraordinary weakness. Such strong moves can signal the end of one trend and the beginning of another.
With an exponential moving average as its foundation, Keltner Channels are a trend following indicator. As with moving averages and trend following indicators, Keltner Channels lag price action. The direction of the moving average dictates the direction of the channel. In general, a downtrend is present when the channel moves lower, while an uptrend exists when the channel moves higher. The trend is flat when the channel moves sideways.
A channel upturn and break above the upper trendline can signal the start of an uptrend. A channel downturn and break below the lower trendline can signal the start a downtrend. Sometimes a strong trend does not take hold after a channel breakout and prices oscillate between the channel lines. Such trading ranges are marked by a relatively flat moving average. The channel boundaries can then be used to identify overbought and oversold levels for trading purposes.
Versus Bollinger Bands
There are two differences between Keltner Channels and Bollinger Bands. First, Keltner Channels are smoother than Bollinger Bands because the width of the Bollinger Bands is based on the standard deviation, which is more volatile than the Average True Range (ATR). Many consider this a plus because it creates a more constant width. This makes Keltner Channels well suited for trend following and trend identification. Second, Keltner Channels also use an exponential moving average, which is more sensitive than the simple moving average used in Bollinger Bands. The chart below shows Keltner Channels (blue), Bollinger Bands (pink), Average True Range (10), Standard Deviation (10) and Standard Deviation (20) for comparison. Notice how the Keltner Channels are smoother than the Bollinger Bands. Also notice how the Standard Deviation covers a larger range than the Average True Range (ATR).

Uptrend
The chart below shows Archer Daniels Midland (ADM) starting an uptrend as the Keltner Channels turn up and the stock surges above the upper channel line. ADM was in a clear downtrend in April-May as prices continued to pierce the lower channel. With a strong thrust up in June, prices exceeded the upper channel and the channel turned up to start a new uptrend. Notice that prices held above the lower channel on dips in early and late July.

Even with a new uptrend established, it is often prudent to wait for a pullback or better entry point to improve the reward-to-risk ratio. Momentum oscillators or other indicators can then be employed to define oversold readings. This chart shows StochRSI, one of the more sensitive momentum oscillators, dipping below .20 to become oversold at least three times during the uptrend. The subsequent crosses back above .20 signaled a resumption of the uptrend.
Downtrend
The second chart shows Nvidia (NVDA) starting a downtrend with a sharp decline below the lower channel line. After this initial break, the stock met resistance near the 20-day EMA (middle line) from mid May until early August. The inability to even come close to the upper channel line showed strong downside pressure.

A 10-period Commodity Channel Index (CCI) is shown as the momentum oscillator to identify short-term overbought conditions. A move above 100 is considered overbought. A subsequent move back below 100 signals a resumption of the downtrend. This signal worked well until September. These failed signals indicated a possible trend change that was subsequently confirmed with a break above the upper channel line.
Flat Trend
Once a trading range or flat trading environment has been identified, traders can use the Keltner Channels to identify overbought and oversold levels. A trading range can be identified with a flat moving average and the Average Directional Index (ADX). The chart below shows IBM fluctuating between support in the 120-122 area and resistance in the 130-132 area from February to late September. The 20-day EMA, middle line, lagged price action, but flattened out from April to September.
The indicator window shows ADX (black line) confirming a weak trend. Low and falling ADX shows a weak trend. High and rising ADX shows a strong trend. ADX was below 40 the entire time and below 30 most of the time. This reflects the absence of trend. Also, notice that ADX peaked in early June and fell until late August.

Armed with the prospects of a weak trend and trading range, traders can use Keltner Channels to anticipate reversals. In addition, notice that the channel lines often coincide with chart support and resistance. IBM dipped below the lower channel line three times from late May until late August. These dips provided low-risk entry points. The stock did not manage to reach the upper channel line, but did get close as it reversed in the resistance zone. The Disney chart shows a similar situation.

Conclusions
Keltner Channels are a trend following indicator designed to identify the underlying trend. Trend identification is more than half the battle. The trend can be up, down or flat. Using the methods described above, traders and investors can identify the trend to establish a trading preference. Bullish trades are favored in an uptrend and bearish trades are favored in a downtrend. A flat trend requires a more nimble approach because prices often peak at the upper channel line and trough at the lower channel line. As with all analysis techniques, Keltner Channels should be used in conjunction with other indicators and analysis. Momentum indicators offer a good complement to the trend-following Keltner Channels.
Check Out $TGWI On PennyStock Tweets
http://www.pennystocktweets.com/stocks/profile/TGWI
Daily data is made up of intraday data that has been compressed to show each day as a single data point, or period.
Use PennyStock Tweets For All Your $PFFBQ DD
http://www.pennystocktweets.com/stocks/profile/PFFBQ
Form N-PX ~ SEC Filings Explained
Annual Report of Proxy Voting Record of Registered Management Investment Companies
Just prior to this book, Andrew Lo wrote a paper for the Journal of Finance in 2000: Foundations of Technical Analysis: Computational Algorithms, Statistical Inference, and Empirical Implementation. Harry Mamaysky and Jiang Wang also contributed. The paper's opening remarks say it all
Use PennyStock Tweets For All Your $ERBB DD
http://www.pennystocktweets.com/stocks/profile/ERBB
SEC Filings Explained ~ Form 5
Form 5 is an SEC filing submitted to the Securities and Exchange Commission on an annual basis by company officers, directors, or beneficial (10%) owners, which summarizes their insider trading activities. This form is simply a combination of year's Form 4 filings, which are mandatory filings made shortly after insiders make transactions.
Keep in mind that 18 years is not a long time in the history of the market and this period was during one of the greatest bull markets in history (1982 to 2000).
Check Out $GEFI On PennyStock Tweets
http://www.pennystocktweets.com/stocks/profile/GEFI
|
Followers
|
3286
|
Posters
|
|
|
Posts (Today)
|
0
|
Posts (Total)
|
2804248
|
|
Created
|
08/22/10
|
Type
|
Free
|
| Moderator Nilbud | |||
| Assistants mick ManicTrader PhotoChick Kirimi $Pistol Pete$ | |||
   Investor Hub Alerts: Sign up for 'STOCKGOODIES PLAYS OF THE WEEK ' E-Mail List Investor Hub Alerts: Sign up for 'STOCKGOODIES PLAYS OF THE WEEK ' E-Mail ListUPDATE; 5-1-22 courtesy of charting /\ wit tweezer top calls /\ Tony @Montana_Trades Really good study sheet on Candlestick Patterns [-chart]pbs.twimg.com/media/FRn8188XMAAdZvk?format=jpg&name=small[/chart] 

02-07-2021
|
|
Posts Today
|
0
|
|
Posts (Total)
|
2804248
|
|
Posters
|
|
|
Moderator
|
|
|
Assistants
|
| Volume | |
| Day Range: | |
| Bid Price | |
| Ask Price | |
| Last Trade Time: |


