 News
News  Market Data
  Discover
Support: 888-992-3836
Copyright © 2023 InvestorsHub Inc.


Register for free to join our community of investors and share your ideas. You will also get access to streaming quotes, interactive charts, trades, portfolio, live options flow and more tools.
Three Black Crows (Bullish)
The Bearish Three Black Crows Pattern is indicative of a strong reversal during an uptrend. It consists of three long black candlesticks, which look like a stair stepping downward. The opening price of each day is higher than the previous day's closing price suggesting a move to a new short term low.

Recognition Criteria:
1. Market is characterized by uptrend.
2. Three consecutive long black candlesticks appear.
3. Each day closes at a new low.
4. Each day opens within the body of the previous day.
5. Each day closes near or at its lows.
Explanation:
The Bearish Three Black Crows Pattern is indicative of the fact that the market has been at a high price for too long and the market may be approaching a top or is already at the top. A decisive downward move is reflected by the first black candlestick. The next two days show further decline in prices due to profit taking. Bullish mood of the market cannot be sustained anymore.
Important Factors:
The opening prices of the second and third days can be anywhere within the previous day's body. However, it is better to see the opening prices below the middle of the previous day's body.
If the black candlesticks are very extended, one should be cautious about an oversold market.
The reliability of this pattern is very high, but still a confirmation in the form of a black candlestick with a lower close or a gap-down is suggested. 
Direxion Daily Financial Bear 3X Shares (NYSE:FAZ)
Not all ETFs are designed to move in the same direction or even in the same amount as the index they are tracking. For example, this triple bear fund attempts to perform 300% in the opposite direction of the Russell 1000 Financial Services Index. This fund became popular in 2008 and 2009 when the financial crisis placed downward pressure on financial stocks.
Pivot Points ~ Time Frames
Pivot Points for 1, 5, 10 and 15 minute charts use the prior day's high, low and close. In other words, Pivot Points for today's intraday charts would be based solely on yesterday's high, low and close. Once Pivot Points are set, they do not change and remain in play throughout the day.

Pivot Points for 30 and 60 minute charts use the prior week's high, low and close. These calculations are based on calendar weeks. Once the week starts, the Pivot Points for 30 and 60 minute charts remain fixed for the entire week. They do not change until the week ends and new Pivots can be calculated.

Pivot Points for daily charts use the prior month's data. Pivot Points for June 1st would be based on the high, low and close for May. They remain fixed the entire month of June. New Pivot Points would be calculated on the first trading day of July. These would be based on the high, low and close for June.

Pivot Points for weekly and monthly charts use the prior year's data.
BULLISH STICK SANDWICH
The Bullish Stick Sandwich Pattern is characterized by consecutive higher opens for three days, but results in an eventual close equal to the first day's close. It may warn that prices are now finding a support price. We may then see a reversal from this support level.

Recognition Criteria:
1. Market is characterized by downtrend.
2. We see a Black Closing Marubozu in the first day.
3. Then we see a white candlestick, which is above the close of the first day.
4. Then we again see a Black Closing Marubozu characterized with a close equal to the close of the first day.
Explanation:
In the Bullish Stick Sandwich Pattern, there is a downtrend going on. Then prices open higher on the next trading day and they reach to higher levels all day, closing at or near the high. This bullish act suggests that the previous downtrend may now reverse implying that the shorts need protection. The next day, prices open at a higher level leading some shorts to cover their positions initially but then the prices start moving lower to close at the same price as two days ago. This pattern shows that the market is finding a support level and now the trend may reverse from this support level.
Important Factors:
A confirmation on the fourth day is required to be sure that the downtrend is reversed. Confirmation may be in the form of a white candlestick, a large gap up or a higher close on the fourth day.
SEC Filings Explained ~ Form 3
Form 3 is an SEC filing filed with the US Securities and Exchange Commission to indicate a preliminary insider transaction by an officer, director, or beneficial (10%) owner of the company's securities. These are typically seen after a company IPOs when insiders make their first transactions. After a Form 3 is filed, future filings of the same nature are filed under Form 4 (standard disclosure) or Form 5 (annual disclosure).
SEC Filings Explained ~ Form D
Form D is an SEC Filing form to be used to file a notice of an exempt offering of securities under Regulation D. Commission rules require the notice to be filed by companies and funds that have sold securities without registration under the Securities Act of 1933 in an offering based on a claim of exemption under Rule 504, 505 or 506 of Regulation D or Section 4(6) of that statute. Commission rules further require the notice to be filed within 15 days after the first sale of securities in the offering. For this purpose, the date of first sale is the date on which the first investor is irrevocably contractually committed to invest. If the due date falls on a Saturday, Sunday or holiday, it is moved to the next business day.
Privately held companies that raise capital are required to file a Form D with the SEC to declare exempt offering of securities. Many of these filings show investments in small, growing companies through venture capital and angel investors, as well as certain pooled investment funds.
Hammer and Gravestone
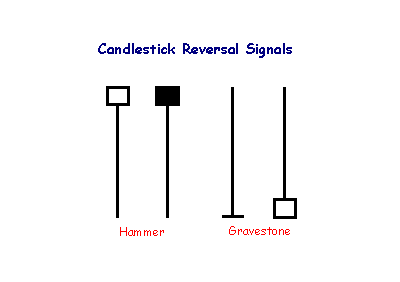
The hammer is not as strong as the dragonfly candlestick, but also signals reversal after a down-trend: control has shifted from sellers to buyers. The shadow of the candlestick should be at least twice the height of the body.
A gravestone is identified by open and close near the bottom of the trading range. The candlestick is the converse of a hammer and signals reversal when it occurs after an up-trend.
13H, 13H-Q, 13H-A, 13H-I, 13H-R, 13H-T ~ SEC Filings Explained
Large Trader Registration Information Required of Large Traders Pursuant to the Securities Exchange Act of 1934 and Rule 13h-1 Thereunder. Initial Filing (13H), Amended Filing (13H-Q), Annual Filing (13H-A), Inactive Status (13H-I), Reactivated Status (13H-R), and Termination Filing (13H-T)
SEC Filings Explained ~ POS AM Form
Post-effective amendments to provide updated prospectus information.
Stock ETFs
The first and most popular ETFs track stocks. Many funds track national indexes; for example, Vanguard Total Stock Market ETF NYSE: VTI tracks the MSCI US Broad Market Index, and several funds track the S
Form 10-D, 10-D/A ~ SEC Filings Explained
Periodic distribution reports by Asset-Backed issuers pursuant to Rule 13a-17 or 15d-17 (and amendment thereto)
Dragon Fly Doji usually occurs when a downward change is about to break.

Long Legged Doji indicates a battle between the Bulls and Bears that resulted in a draw. When this happens trend is usually broken from an uptrend to a downturn OR from a downtrend to an upturn.

LONG LEGGED DOJI
Long Legged Doji is a doji characterized with very long shadows. It shows the indecision of the buyers and sellers. It is one of the important reversal signals.
Recognition Criteria:
1. Market is characterized by a bearish mood and downtrend.
2. Then we see a Doji that gaps in the direction of the downtrend.
3. The real body is either a horizontal line or it is significantly small.
4. Both of the upper and lower shadows are long and they are almost equal in length.
Explanation:
Long Legged Doji shows that there is a great deal of confusion and indecision in the market. This particular pattern shows that the prices moved well above and below the day's opening level, however they finally closed virtually at the same level with the opening price. The end result is only a little change from the opening price despite the whole volatility and excitement during the day that clearly reflects that the market lost its sense of direction.
Important Factors:
Long Legged Doji is more important at tops.
Long Legged Doji is a single candlestick pattern. It requires confirmation in the form of a move opposite to the prior trade on the next trading day.
Form 20-F ~ SEC Filings Explained
Form 20-F is an SEC filing submitted to the US Securities and Exchange Commission used by certain foreign private issuers to provide information.
20-F, 20-F/A Annual and transition report of foreign private issuers pursuant to sections 13 or 15(d)
20FR12B, 20FR12B/A Form for initial registration of a class of securities of foreign private issuers pursuant to section 12(b)
20FR12G, 20FR12G/A Form for initial registration of a class of securities of foreign private issuers pursuant to section 12(g)
The postfix /A stands for 'Amendment'
The report must be filed within six months after the end of the fiscal year.
Form N-1A ~ SEC Filings Explained
Initial registration statement for open-end management investment companies
Form N-23C3A ~ SEC Filings Explained
Notification of periodic repurchase offer Filed pursuant to Rule 23c-3(b) only
Using Moving Averages to Find Support and Resistance
Moving averages can also act as support in an uptrend and resistance in a downtrend. A short-term uptrend might find support near the 20-day simple moving average, which is also used in Bollinger Bands. A long-term uptrend might find support near the 200-day simple moving average, which is the most popular long-term moving average. If fact, the 200-day moving average may offer support or resistance simply because it is so widely used. It is almost like a self-fulfilling prophecy.

The chart above shows the NY Composite with the 200-day simple moving average from mid 2004 until the end of 2008. The 200-day provided support numerous times during the advance. Once the trend reversed with a double top support break, the 200-day moving average acted as resistance around 9500.
Do not expect exact support and resistance levels from moving averages, especially longer moving averages. Markets are driven by emotion, which makes them prone to overshoots. Instead of exact levels, moving averages can be used to identify support or resistance zones.
Moving Averages - Double Crossovers
Two moving averages can be used together to generate crossover signals. In Technical Analysis of the Financial Markets, John Murphy calls this the "double crossover method". Double crossovers involve one relatively short moving average and one relatively long moving average. As with all moving averages, the general length of the moving average defines the timeframe for the system. A system using a 5-day EMA and 35-day EMA would be deemed short-term. A system using a 50-day SMA and 200-day SMA would be deemed medium-term, perhaps even long-term.
A bullish crossover occurs when the shorter moving average crosses above the longer moving average. This is also known as a golden cross. A bearish crossover occurs when the shorter moving average crosses below the longer moving average. This is known as a dead cross.
Moving average crossovers produce relatively late signals. After all, the system employs two lagging indicators. The longer the moving average periods, the greater the lag in the signals. These signals work great when a good trend takes hold. However, a moving average crossover system will produce lots of whipsaws in the absence of a strong trend.
There is also a triple crossover method that involves three moving averages. Again, a signal is generated when the shortest moving average crosses the two longer moving averages. A simple triple crossover system might involve 5-day, 10-day and 20-day moving averages.

The chart above shows Home Depot (HD) with a 10-day EMA (green dotted line) and 50-day EMA (red line). The black line is the daily close. Using a moving average crossover would have resulted in three whipsaws before catching a good trade. The 10-day EMA broke below the 50-day EMA in late October (1), but this did not last long as the 10-day moved back above in mid November (2). This cross lasted longer, but the next bearish crossover in January (3) occurred near late November price levels, resulting in another whipsaw. This bearish cross did not last long as the 10-day EMA moved back above the 50-day a few days later (4). After three bad signals, the fourth signal foreshadowed a strong move as the stock advanced over 20%.
There are two takeaways here. First, crossovers are prone to whipsaw. A price or time filter can be applied to help prevent whipsaws. Traders might require the crossover to last 3 days before acting or require the 10-day EMA to move above/below the 50-day EMA by a certain amount before acting. Second, MACD can be used to identify and quantify these crossovers. MACD (10,50,1) will show a line representing the difference between the two exponential moving averages. MACD turns positive during a golden cross and negative during a dead cross. The Percentage Price Oscillator (PPO) can be used the same way to show percentage differences. Note that MACD and the PPO are based on exponential moving averages and will not match up with simple moving averages.

This chart shows Oracle (ORCL) with the 50-day EMA, 200-day EMA and MACD(50,200,1). There were four moving average crossovers over a 2 1/2 year period. The first three resulted in whipsaws or bad trades. A sustained trend began with the fourth crossover as ORCL advanced to the mid 20s. Once again, moving average crossovers work great when the trend is strong, but produce losses in the absence of a trend.
Form N-23C-2 ~ SEC Filings Explained
Notice by closed-end investment companies of intention to call or redeem their own securities
ARS~ SEC Filings Explained
Annual Report to Security Holders.
Investment Use of ETF’s
ETFs generally provide the easy diversification, low expense ratios, and tax efficiency of index funds, while still maintaining all the features of ordinary stock, such as limit orders, short selling, and options. Because ETFs can be economically acquired, held, and disposed of, some investors invest in ETF shares as a long-term investment for asset allocation purposes, while other investors trade ETF shares frequently to implement market timing investment strategies.[5] Among the advantages of ETFs are the following:[8][17]
? Lower costs – ETFs generally have lower costs than other investment products because most ETFs are not actively managed and because ETFs are insulated from the costs of having to buy and sell securities to accommodate shareholder purchases and redemptions. ETFs typically have lower marketing, distribution and accounting expenses, and most ETFs do not have 12b-1 fees.
? Buying and selling flexibility – ETFs can be bought and sold at current market prices at any time during the trading day, unlike mutual funds and unit investment trusts, which can only be traded at the end of the trading day. As publicly traded securities, their shares can be purchased on margin and sold short, enabling the use of hedging strategies, and traded using stop orders and limit orders, which allow investors to specify the price points at which they are willing to trade.
? Tax efficiency – ETFs generally generate relatively low capital gains, because they typically have low turnover of their portfolio securities. While this is an advantage they share with other index funds, their tax efficiency is further enhanced because they do not have to sell securities to meet investor redemptions.
? Market exposure and diversification – ETFs provide an economical way to rebalance portfolio allocations and to "equitize" cash by investing it quickly. An index ETF inherently provides diversification across an entire index. ETFs offer exposure to a diverse variety of markets, including broad-based indices, broad-based international and country-specific indices, industry sector-specific indices, bond indices, and commodities.
? Transparency – ETFs, whether index funds or actively managed, have transparent portfolios and are priced at frequent intervals throughout the trading day.
Some of these advantages derive from the status of most ETFs as index funds.
Form N-14/A ~ SEC Filings Explained
Initial registration statement for open-end investment company (Amendment)
Form 11-KT, 11-KT/A ~ SEC Filings Explained
Transition report pursuant to Rule 13a-10 or 15d-10 (and amendment thereto)
Walking the Bands
Moves above or below the bands are not signals as such. As Bollinger puts it, moves that touch or exceed the bands are not signals, but rather "tags". On the face of it, a move to the upper band shows strength, while a sharp move to the lower band shows weakness. Momentum oscillators work much the same way. Overbought is not necessarily bullish. It takes strength to reach overbought levels and overbought conditions can extend in a strong uptrend. Similarly, prices can "walk the band" with numerous touches during a strong uptrend. Think about it for a moment. The upper band is 2 standard deviations above the 20-period simple moving average. It takes a pretty strong price move to exceed this upper band. An upper band touch that occurs after a Bollinger Band confirmed W-Bottom would signal the start of an uptrend. Just as a strong uptrend produces numerous upper band tags, it is also common for prices to never reach the lower band during an uptrend. The 20-day SMA sometimes acts as support. In fact, dips below the 20-day SMA sometimes provide buying opportunities before the next tag of the upper band.

The chart above shows Air Products (APD) with a surge and close above the upper band in mid July. First, notice that this is a strong surge that broke above two resistance levels. A strong upward thrust is a sign of strength, not weakness. Trading turned flat in August and the 20-day SMA moved sideways. The Bollinger Bands narrowed, but APD did not close below the lower band. Prices, and the 20-day SMA, turned up in September. Overall, APD closed above the upper band at least five times over a four month period. The indicator window shows the 10-period Commodity Channel Index (CCI). Dips below -100 are deemed oversold and moves back above -100 signal the start of an oversold bounce (green dotted line). The upper band tag and breakout started the uptrend. CCI then identified tradable pullbacks with dips below -100. This is an example of combining Bollinger Bands with a momentum oscillator for trading signals.
SEC Filings Explained ~ Form 5
Form 5 is an SEC filing submitted to the Securities and Exchange Commission on an annual basis by company officers, directors, or beneficial (10%) owners, which summarizes their insider trading activities. This form is simply a combination of year's Form 4 filings, which are mandatory filings made shortly after insiders make transactions.
W-Bottoms Using Bollinger Bands
W-Bottoms were part of Arthur Merrill's work that identified 16 patterns with a basic W shape. Bollinger uses these various W patterns with Bollinger Bands to identify W-Bottoms. A "W-Bottom" forms in a downtrend and involves two reaction lows. In particular, Bollinger looks for W-Bottoms where the second low is lower than the first, but holds above the lower band. There are four steps to confirm a W-Bottom with Bollinger Bands. First, a reaction low forms. This low is usually, but not always, below the lower band. Second, there is a bounce towards the middle band. Third, there is a new price low in the security. This low holds above the lower band. The ability to hold above the lower band on the test shows less weakness on the last decline. Fourth, the pattern is confirmed with a strong move off the second low and a resistance break.

Nordstrom (JWN) with a W-Bottom in January-February 2010. First, the stock formed a reaction low in January (black arrow) and broke below the lower band. Second, there was a bounce back above the middle band. Third, the stock moved below its January low and held above the lower band. Even though the 5-Feb spike low broke the lower band, Bollinger Bands are calculated using closing prices so signals should also be based on closing prices. Fourth, the stock surged with expanding volume in late February and broke above the early February high.
Form TA-W ~ SEC Filings Explained
Notice of withdrawal from registration as transfer agent filed pursuant to the Securities Exchange Act of 1934
THREE INSIDE DOWN (Bearish)
The Bearish Three Inside Down Pattern is another name for the Confirmed Bearish Harami Pattern. The third day confirms the bearish trend reversal.
Recognition Criteria:
1. Market is characterized by uptrend.
2. We see a Bearish Harami Pattern in the first two days.
3. We then see a black candlestick on the third day with a lower close than the second day.
Explanation:
The first two days of this three-day pattern is a Bearish Harami Pattern, and the third day confirms the reversal suggested by Bearish Harami Pattern since it is a black candlestick closing with a new low for the three days.
Important Factors:
The reliability of this pattern is very high, but still a confirmation in the form of a black candlestick with a lower close or a gap-down is suggested.
BULLISH HOMING PIGEON
Bullish Homing Pigeon Pattern is a small black real body contained by a prior relatively long black real body.
Recognition Criteria:
1. Market is in downtrend.
2. We see a black body in the first day.
3. Then we again see a black body in the second day where the real body of this second day is completely engulfed by the real body of the first day. It is not required that the shadows (high/low) of the second candlestick are contained within the first, though it's preferable if they are.
Explanation:
The Bullish Homing Pigeon Pattern is a signal of disparity. In a market characterized by downtrend, we first see heavy selling reflected by the long, black real body of the first day. However small body of second day points out to diminished power and enthusiasm of the sellers thus suggesting a trend reversal.
Important Factors:
The important fact about this pattern is the requirement that the second day has a minute real body relative to the prior candlestick and that this small body is completely contained by the larger one. The Bullish Homing Pigeon Pattern is not necessarily a signal for a rally. Market usually has a tendency to enter into a congestion phase following a Homing Pigeon.
We must check the third day to confirm that the downtrend has reversed. This confirmation may be in the form of a white candlestick, a large gap up or a higher close on the next trading day (on the third day).
Form 13F-NT, 13F-NT/A ~ SEC Filings Explained
Initial Quarterly Form 13F Notice Report filed by institutional managers (and amendment thereto)
Form NT 10-Q ~ SEC Filings Explained
Notice under Rule 12b25 of inability to timely file all or part of a form 10-Q or 10-QSB
Tweezer Bottoms

The Tweezer Bottom formation is a bullish reversal pattern seen at the bottom of downtrends.
Tweezer Bottom formation consists of two candlesticks:
Bearish Candle (Day 1)
Bullish Candle (Day 2)
Sometimes Tweezer Bottoms have three candlesticks.
A bullish Tweezer Bottom occurs during a downtrend when bears continue to take prices lower, usually closing the day near the lows (a bearish sign). Nevertheless, Day 2 is completely opposite because prices open and go nowhere but upwards. This bullish advance on Day 2 sometimes eliminates all losses from the previous day.

The bears pushed the price of Exxon-Mobil (XOM) downwards on Day 1; however, the market on Day 2 opened where prices closed on Day 1 and went straight up, reversing the losses of Day 2. A buy signal would generally be given on the day after the Tweezer Bottom, assuming the candlestick was bullish green.
The Tweezer Top and Bottom reversal pattern is extremely helpful because it visually indicates a transfer of power and sentiment from the bulls and the bears. Of course other technical indicators should be consulted before making a buy or sell signal based on the Tweezer patterns.
Form N-4 ~ SEC Filings Explained
Initial registration statement on Form N-4 for separate accounts (unit investment trusts)
3. Counterparty risk (Risks Associated with ETF’s)
A synthetic ETF has counterparty risk, because the counterparty is contractually obligated to match the return on the index. The deal is arranged with collateral posted by the swap counterparty. A potential hazard is that the investment bank offering the ETF might post its own collateral, and that collateral could be of dubious quality. Furthermore, the investment bank could use its own trading desk as counterparty. These types of set-ups are not allowed under the European guidelines, Undertakings for Collective Investment in Transferable Securities (UCITS), so the investor should look for UCITS III-compliant funds.
Bollinger Bands aka Bollies
Developed by John Bollinger, Bollinger Bands® are volatility bands placed above and below a moving average. You will find that most of the time stocks will trade within the Bollies. Volatility is based on the standard deviation, which changes as volatility increases and decreases. The bands widen when volatility increases and narrow when volatility decreases. This dynamic nature of Bollinger Bands also means they can be used on different securities with the standard settings.
Note: Bollinger Bands® is a registered trademark of John Bollinger.
Below is a chart showing Bollinger Bands:
Pink line is the Upper Bollie or UBB
Blue line is the Lower Bollie or LBB
White line is the Middle Bollie or 20 SMA
Note how during the down trend the price stayed between the Lower
BLACK SPINNING TOP
The Black Spinning Top is a single candlestick pattern. Its shape is a small black body with upper and lower shadows having a greater length than the body's length.
Recognition Criteria:
1. The real body of the pattern is black and small.
2. The upper and lower shadows are longer than the real body's length.
Explanation:
The market moves higher and then sharply lower, or vice versa. It then closes below the opening price creating a black body. This represents complete indecision between the bulls and the bears. The actual length of the shadows is not important. The small body relative to the shadows is what makes the spinning top.
Important Factors:
If a Black Spinning Top is observed after a long rally or long white candlestick, this implies weakness among the bulls and it is a warning about a potential change or interruption in trend.
If a Black Spinning Top is observed after a long decline or a long black candlestick, this implies weakness among the bears and it is a warning about a potential change or interruption in trend.
Like most other single candlestick patterns, the Black Spinning Top has low reliability. It reflects only one day's trading and can be interpreted both as a continuation and a reversal pattern. This pattern must be used with other candlesticks for a better and healthier confirmation of a trend.
Form 10-Q~ SEC Filings Explained
Form 10-Q, (also known as a 10-Q or 10Q) is a quarterly report mandated by the United States federalSecurities and Exchange Commission, to be filed by publicly traded corporations.
Pursuant to Section 13 or 15(d) of the Securities Exchange Act of 1934, it's an SEC filing that must be filed quarterly with the US Securities and Exchange Commission. It contains similar information to the annual form 10-K, however the information is generally less detailed, and the financial statements are generally unaudited. Information for the final quarter of a firm's fiscal year is included in the 10-K, so only three 10-Q filings are made each year.
These reports generally compare last quarter to the current quarter and last years quarter to this years quarter. The SEC put this form in place to facilitate better informed investors. The form 10-Q must be filed within 40 days for large accelerated filers and accelerated filers or 45 days after the end of the fiscal quarter for all other registrants (formerly 45 days)
Form 18-K, 18-K/A ~ SEC Filings Explained
Annual report for foreign governments (and amendment thereto)
Form S-4 ~ SEC Filings Explained
Registration of securities issued in business combination transactions
Form T-3 ~ SEC Filings Explained
Initial application for qualification of trust indentures
iShares MSCI Emerging Market Index (NYSE:EEM)
This investment attempts to mimic the returns seen in the MSCI Emerging Markets index which was created as an equity benchmark for international security performance. If you would like to gain some international exposure, specifically to emerging markets, this ETF might be for you.
Engulfing Candlesticks
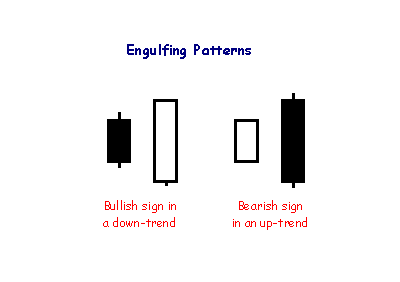
Engulfing patterns are where the body of the second candlestick 'engulfs' the first. They often follow or complete doji, hammer or gravestone patterns and signal reversal in the short-term trend.
BEARISH TWO CROWS
During an uptrend we see the market closing lower after an opening gap. Then we see a black day that fills the gap creating the Bearish Two Crows Pattern. It suggests the erosion of the uptrend, and warns about a possible trend reversal.

Recognition Criteria:
1. Market is characterized by uptrend.
2. We see a long white candlestick in the first day.
3. Then we see a black candlestick on the second day characterized by a gap up.
4. Finally we see a black candlestick whose opening price is inside the body of the second day and which closes inside the body of the first day.
Explanation:
In the Two Crows bear pattern, the market is already in an extended uptrend. We see a gap in the opening of the second day. This higher opening is followed by a lower close in this second day warning that there is some weakness in the rally. The third day also opens at a higher price, but not above the open of the previous day, and then prices go down with a close well within the body of the first day. This third day action fills the gap of the second day. It shows that the bullishness started to erode quickly.
Important Factors:
A confirmation on the fourth day is required to show that the uptrend has reversed. This confirmation may be in the form of a black candlestick, a large gap down or a lower close on the fourth day.
THREE OUTSIDE UP
The Bearish Upside Gap Two Crows Pattern is a three-candlestick pattern and it signals a top reversal. The first candlestick is a long white candlestick followed by a real body that gaps higher. Then another black real body appears, which opens above the second day’s open and closes under the second day’s close, completing the pattern
Recognition Criteria:
1. Market is characterized by downtrend.
2. We see a Bullish Engulfing Pattern in the first two days.
3. The third day is a white candlestick with a higher close than the second day.
Explanation:
The first two days of this three-day pattern is simply a Bullish Engulfing Pattern, and the third day confirms the reversal suggested by the Bullish Engulfing Pattern since it is a white candlestick closing with a new high for the last three days.
BULLISH ENGULFING
Bullish Engulfing Pattern is a pattern characterized by a large white real body engulfing a preceding small black real body, which appears during a downtrend. The white body does not necessarily engulf the shadows of the black body but totally engulfs the body itself. The Bullish Engulfing Pattern is an important bottom reversal signal.
Recognition Criteria:
1. Market is characterized by downtrend.
2. Then we see a small black body.
3. Next day we see a white body that completely engulfs the black real body of the preceding day.
Explanation:
While the market sentiment is bearish; we see some subsided selling reflected by the short, black real body of the first day. Next day shows bull strength with a closing price at or above the previous day’s open. It means that the downtrend is now losing momentum and the bulls started to take the lead.
Important Factors:
The relative size of the bodies in the first and second days is important. If the first day of the Bullish Engulfing Pattern is characterized by a very small real body (it may even be a doji or nearly a doji) but the second day is characterized by a very long real body, this strongly indicates that the bearish power is diminishing and the disparity of white versus black body is indicative of the emerging bull power.
There is higher probability of a bullish reversal if there is heavy volume on the second real body or if the second day of the Bullish Engulfing Pattern engulfs more than one real body (which essentially means we see two or more small black bodies preceding the long white body).
The reversal of downtrend needs further confirmation on the third day. This confirmation may be in the form of a white candlestick, a large gap up or a higher close on the third day.
BULLISH UNIQUE THREE RIVER BOTTOM
The Bullish Unique Three River Bottom Pattern is an extremely rare bottom reversal pattern. Its first candlestick is an extended black candlestick then followed by a second black real body closing higher than the first candlestick’s close, and the third candlestick is a white candlestick with a very small real body. The real white body shows that the market lost the selling pressure.

Recognition Criteria:
1. Market is characterized by a downtrend.
2. We see a long black candlestick in the first day.
3. Then we see a Hammer-like black candlestick on the second day.
4. The lower shadow of the second day sets a new low.
5. Then we see a short white candlestick, which is below the second day candlestick.
Explanation:
With the Unique Three River Bottom bull pattern, we first see a long black stick in a falling market. The next day opens at a higher level, however bearish sentiment is strong causing a new low during the day however the day closes near the high thus producing a small black body within the body of the first day. This rally questions the strength of bears. The increasing uncertainty is further strengthened when the third day opens lower, but not lower than the low of the second day. There is some stability on the third day as evidenced by its small white body. Third day ends by a rally closing below the close of the second day. If price rises to new high on the fourth day, then a reversal of trend is confirmed.
Important Factors:
A confirmation on fourth day is advisable to show that that the downtrend has reversed. This may be in the form of a white candlestick, a large gap up or a higher close on the fourth day.
SEC Filings Explained ~ F-1
Registration statement for certain foreign private issuers.
Form N-14 8C ~ SEC Filings Explained
Initial registration statement filed on Form N14 by closed-end investment company (business combinations)
Form 6-K~ SEC Filings Explained
Form 6K is an SEC filing submitted to the US Securities and Exchange Commission used by certain foreign private issuers to provide information that is:
? Required to be made public in the country of its domicile
? Filed with and made public by a foreign stock exchange on which its securities are traded
? Are distributed to security holders.
The report must be furnished promptly after such material is made public. The form is not considered "filed" because of Section 18 (for liability purposes). This is the only information furnished by foreign private issuers between annual reports, since such issuers are not required to file on Forms 10-Q or 8-K.
THREE STAR IN THE SOUTH
We see three consecutive black candlesticks during a downtrend. These candlesticks show that each day is consecutively weaker in a bearish sense and possibly some buying is occurring. Daily small rallies keep the market’s lows from reaching that of the first day. These indications suggest that tide is turning in a bullish direction.

Recognition Criteria:
1. Market is characterized by downtrend.
2. We see a long Black Opening Marubozu in the first day characterized by a long lower shadow just like a Hammer.
3. Then we see a Black Opening Marubozu on the second day similar to the first day however smaller in body with a low above the first day’s low.
4. We finally see a small Black Marubozu on the third day that lies within the second day’s trading range.
Explanation:
The Bullish Three Stars in the South Pattern shows a slowly deteriorating downtrend, which is characterized by less and less daily price movement and consecutively higher lows. Buying enthusiasm is reflected by the long lower shadow of the first day. The next day opens at a higher level, trades lower, but its low is not lower than the previous day's low. This second day also closes off its low. Then we see a black Marubozu, which is engulfed by the previous day's range on the third day. Higher lows cause uneasiness among shorts. The last day of the pattern reflects market indecision, with hardly any price movement. Shorts are now ready to cover positions if they see anything in the upside. Everything points out that the tide is slowly turning toward the bull side.
Important Factors:
A confirmation on fourth day is required to be sure that the downtrend has reversed. This confirmation may be in the form of a white candlestick, a large gap up or a higher close on the fourth day.
|
Followers
|
3286
|
Posters
|
|
|
Posts (Today)
|
0
|
Posts (Total)
|
2804248
|
|
Created
|
08/22/10
|
Type
|
Free
|
| Moderator Nilbud | |||
| Assistants mick ManicTrader PhotoChick Kirimi $Pistol Pete$ | |||
   Investor Hub Alerts: Sign up for 'STOCKGOODIES PLAYS OF THE WEEK ' E-Mail List Investor Hub Alerts: Sign up for 'STOCKGOODIES PLAYS OF THE WEEK ' E-Mail ListUPDATE; 5-1-22 courtesy of charting /\ wit tweezer top calls /\ Tony @Montana_Trades Really good study sheet on Candlestick Patterns [-chart]pbs.twimg.com/media/FRn8188XMAAdZvk?format=jpg&name=small[/chart] 

02-07-2021
|
|
Posts Today
|
0
|
|
Posts (Total)
|
2804248
|
|
Posters
|
|
|
Moderator
|
|
|
Assistants
|
| Volume | |
| Day Range: | |
| Bid Price | |
| Ask Price | |
| Last Trade Time: |


