 News
News  Market Data
  Discover
Support: 888-992-3836
Copyright © 2023 InvestorsHub Inc.


Register for free to join our community of investors and share your ideas. You will also get access to streaming quotes, interactive charts, trades, portfolio, live options flow and more tools.
Form 18-K, 18-K/A ~ SEC Filings Explained
Annual report for foreign governments (and amendment thereto)

$WCYN Profile on PST - For All Your DD Use More http://www.pennystocktweets.com/stocks/stockprofile/WCYN
Stage 1 shows the economy contracting and bonds turning up as interest rates decline. Economic weakness favors loose monetary policy and the lowering of interest rates, which is bullish for bonds.

Form S-8 ~ SEC Filings Explained
Initial registration statement for securities to be offered to employees pursuant to employee benefit plans
More On $ATDM At PennyStock Tweets
http://www.pennystocktweets.com/stocks/profile/ATDM

If a support or resistance level is broken, it signals that the relationship between supply and demand has changed.
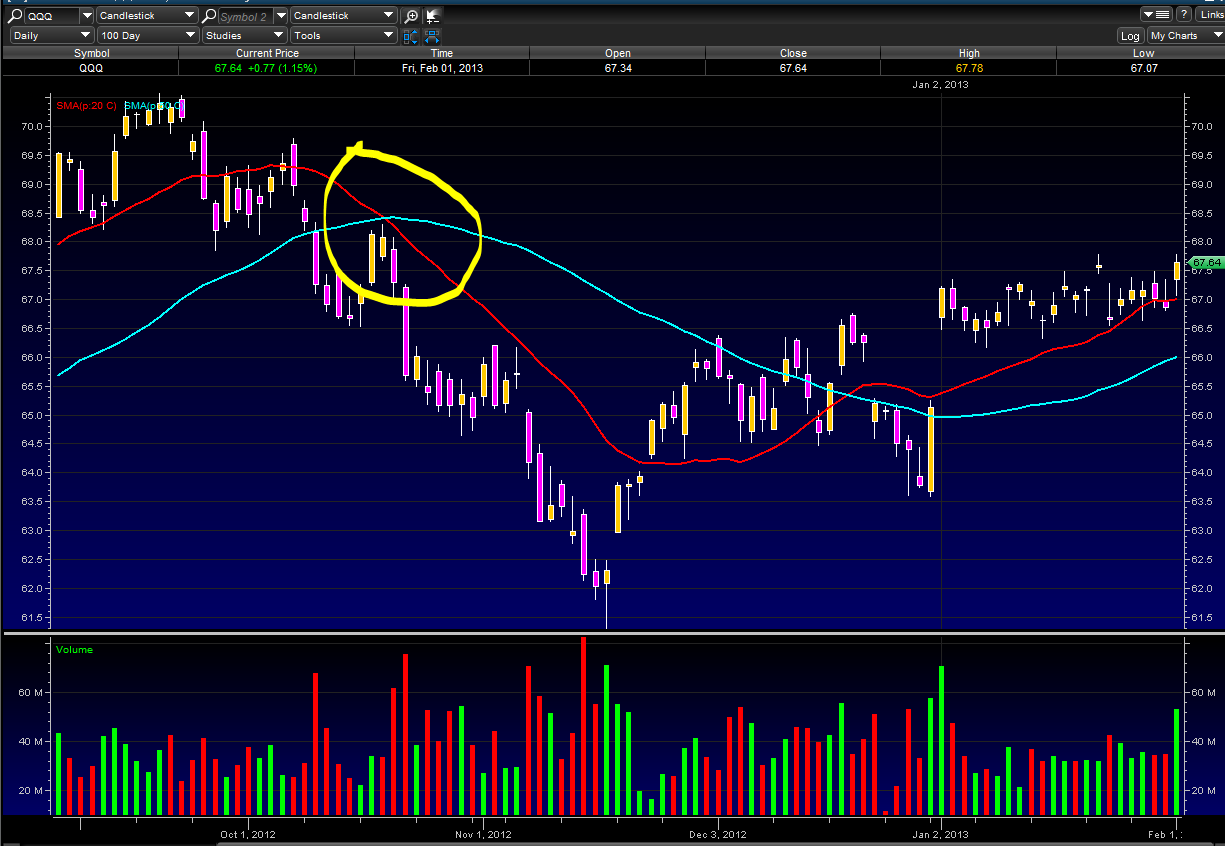
Death Cross
A Death Cross is when a shorter term moving average crosses below a longer term moving average, for example a 20 day SMA crossing under a 50 day SMA. A death cross indicates a bearish trend, especially when it is coupled with higher trading volume. As well as being a trend indicator, the longer term moving average becomes a resistance line as the price rises.
The chart below shows a 20/50 SMA Death cross:
20 SMA is in Red
50 SMA is in Blue
Third, the consistent rise in stock prices provided a feedback loop that kept public attention on stocks. As the media reported the rise in the stock market, new money found its way into the stock market and pushed prices even higher.
More On $MZRTF At PennyStock Tweets
http://www.pennystocktweets.com/stocks/profile/MZRTF
Form NT 10-Q ~ SEC Filings Explained
Notice under Rule 12b25 of inability to timely file all or part of a form 10-Q or 10-QSB
Conclusions
Even though many different charting techniques are available, one method is not necessarily better than the other.
For All Your $ARNH DD ~ Use PennyStock Tweets
http://www.pennystocktweets.com/stocks/profile/ARNH
Not all factors or influences are listed in this article. Shiller offers more factors and detailed evidence in the book. After examining efficient markets, random walks, bubbles and investor attitudes, Shiller also offers several remedies to contain speculative volatility in a free society.
Dark Cloud
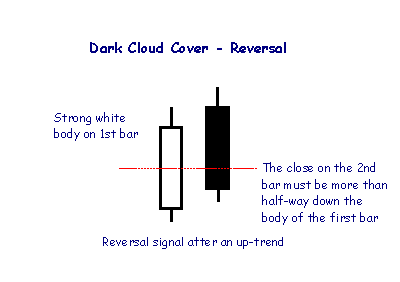
A Dark Cloud pattern encountered after an up-trend is a reversal signal, warning of "rainy days" ahead.
Use PennyStock Tweets For All Your $HYSYF DD
http://www.pennystocktweets.com/stocks/profile/HYSYF
POSITIVE: When one goes up, the other goes up also. INVERSE: When one goes up, the other goes down. Interest rates move up when bonds move down

Form TA-2 ~ SEC Filings Explained
Annual report of transfer agent activities filed pursuant to the Securities Exchange Act of 1934
Check Out $GWIV On PennyStock Tweets
http://www.pennystocktweets.com/stocks/profile/GWIV
Form 15-15D, 15-15D/A ~ SEC Filings Explained
Notice of suspension of duty to file reports pursuant to Section 13 and 15(d) of the Act (and amendment thereto)
While technical analysts use charts almost exclusively, the use of charts is not limited to just technical analysis.
More On $GDSI At PennyStock Tweets
http://www.pennystocktweets.com/stocks/profile/GDSI
Behavior finance can help us understand what is happening, but understanding may not help with making money in the stock market. While the first edition coincided with the stock market peak in 2000, the stock market rose another 30% after the second edition was published in February 2005.
Use PennyStock Tweets For All Your $MONA DD
http://www.pennystocktweets.com/stocks/profile/MONA
Form N-4 ~ SEC Filings Explained
Initial registration statement on Form N-4 for separate accounts (unit investment trusts)
The consumer discretionary and technology sectors led the first move off the March 2003 low. These two showed relative strength that affirmed the importance of the 2003 bottom.

$TGWI Profile on PST - For All Your DD Use More http://www.pennystocktweets.com/stocks/stockprofile/TGWI
Form N-23C-2 ~ SEC Filings Explained
Notice by closed-end investment companies of intention to call or redeem their own securities
Shiller reports that more people viewed money as important to success in the mid 90s than in the mid 70s. Society viewed successful businessmen more favorably than scientists or artists.
$HOKU Profile on PST - For All Your DD Use More http://www.pennystocktweets.com/stocks/stockprofile/HOKU
Form N-6 ~ SEC Filings Explained
Registration statement for separate accounts
Sometimes it does not seem logical to consider a resistance level broken if the price closes 1/8 above the established resistance level. For this reason, some traders and investors establish resistance zones.
$PRTN Profile on PST - For All Your DD Use More http://www.pennystocktweets.com/stocks/stockprofile/PRTN
Form 10-K~ SEC Filings Explained
A Form 10-K is an annual report required by the U.S. Securities and Exchange Commission (SEC), that gives a comprehensive summary of a public company's performance. Although similarly named, the annual report on Form 10-K is distinct from the often glossy "annual report to shareholders," which a company must send to its shareholders when it holds an annual meeting to elect directors (though some companies combine the annual report and the 10-K into one document). The 10-K includes information such as company history, organizational structure, executive compensation, equity, subsidiaries, and audited financial statements, among other information.
Companies with more than $10 million in assets and a class of equity securities that is held by more than 500 owners must file annual and other periodic reports, regardless of whether the securities are publicly or privately traded. Up until March 16, 2009, smaller companies could use Form 10-KSB. If a shareholder requests a company’s Form 10-K, the company must provide a copy. In addition, most large companies must disclose on Form 10-K whether the company makes its periodic and current reports available, free of charge, on its website. Form 10-K, as well as other SEC filings may be searched at theEDGAR database on the SEC's website.
In addition to the 10-K, which is filed annually, a company is also required to file quarterly reports on Form 10-Q. Information for the final quarter of a firm'sfiscal year is included in the annual 10-K, so only three 10-Q filings are made each year. In the period between these filings, and in case of a significant event, such as a CEO departing or bankruptcy, a Form 8-K must be filed in order to provide up to date information.
The name of the Form 10-K comes from the CFR (Code of Federal Regulations) designation of the form pursuant to sections 13 and 15(d) of the Securities Exchange Act of 1934 as amended.
Related Forms
Unlike the 10-K filed annually, other forms serve related purposes, but have different schedules. Form 10-Q, much briefer, is filed after each of the three quarters that do not have a 10-K filing. Form 8-K covers special material events that occur between 10-K and 10-Q filings.
A substantial number of firms filed their 10-K as a Form 10-K405 during the late 1990s and early 2000s (decade). A 10-K405 is a 10-K where the Regulation S-K Item 405 box on the cover page is checked. Due to confusion in its application, the 10-K405 was eliminated in 2002.
Filing Deadlines
Historically, Form 10-K had to be filed with the SEC within 90 days after the end of the company's fiscal year. However, in September 2002, the SEC approved a Final Rule that changed the deadlines to 75 days for Form 10-K for "accelerated filers"; meaning issuers that have a public float of at least $75 million, that have been subject to the Exchange Act's reporting requirements for at least 12 calendar months, that previously have filed at least one annual report, and that are not eligible to file their quarterly and annual reports on Forms 10-QSB and 10-KSB. These shortened deadlines were to be phased in over a three-year period, however in 2004 the SEC postponed the three-year phase in by one year. In December 2005, the SEC created a third category of "large accelerated filers," accelerated filers with a public float of over $700 million. As of December 27, 2005, the deadline for filing for large accelerated filers was still 75 days, however beginning with the fiscal year ending on or after December 15, 2006, the deadline will be 60 days. For other accelerated filers the deadline will remain at 75 days and for non-accelerated filers the deadline will remain at 90 days. For further reading, see the Final Rules [1] section of the SEC's website, referencing Rule 33-8644.
Parts
Every annual report contains 4 parts and 15 schedules. They are
PART I
ITEM 1. Description of Business
ITEM 1A. Risk Factor
ITEM 1B. Unresolved Staff Comments
ITEM 2. Description of Properties
ITEM 3. Legal Proceedings
ITEM 4. Mine Safety Disclosures
PART II
ITEM 5. Market for Registrant’s Common Equity, Related Stockholder Matters and Issuer Purchases of Equity Securities
ITEM 6. Selected Financial Data
ITEM 7. Management’s Discussion and Analysis of Financial Condition and Results of Operations
ITEM 7A. Quantitative and Qualitative Disclosures About Market Risk
ITEM 8. Financial Statements and Supplementary Data
ITEM 9. Changes in and Disagreements With Accountants on Accounting and Financial Disclosure
ITEM 9A(T). Controls and Procedures
ITEM 9B. Other Information
PART III
ITEM 10. Directors, Executive Officers and Corporate Governance
ITEM 11. Executive Compensation
ITEM 12. Security Ownership of Certain Beneficial Owners and Management and Related Stockholder Matters
ITEM 13. Certain Relationships and Related Transactions, and Director Independence
ITEM 14. Principal Accounting Fees and Services
PART IV
ITEM 15. Exhibits, Financial Statement Schedules Signatures
Part 1
Item 1 - Business
This describes the business of the company: who and what the company does, what subsidiaries it owns, and what markets it operates in. It may also include recent events, competition, regulations, and labor issues. (Some industries are heavily regulated, have complex labor requirements, which have significant effects on the business.) Other topics in this section may include special operating costs, seasonal factors, or insurance matters.
Item 1A - Risk Factors
Here, the company lays out anything that could go wrong, likely external effects, possible future failures to meet obligations, and other risks disclosed to adequately warn investors and potential investors.
[Item 2 - Properties
This section lays out the significant properties, physical assets, of the company. This only includes physical types of property, not intellectual or intangible property.
Item 3 - Legal Proceedings
Here, the company discloses any significant pending law suit or other legal proceeding. References to these proceedings could also be disclosed in the Risks section or other parts of the report.
Item 4 - Mine Safety Disclosures
This section requires some companies to provide information about mine safety violations or other regulatory matters.
Item 5 - Market
Gives high's and low's of stock, in a simple statement. Market for Registrant's Common Equity, related stockholder matters and issuer purchases of equity securities.
Item 6 - Consolidated Financial Data
In this section Financial Data showing consolidated records for the legal entity as well as subsidiary companies.
Item 7 - Management's Discussion and Analysis
Here, management discusses the operations of the company in detail by usually comparing the current period versus prior period. These comparisons provide a reader an overview of the operational issues of what causes such increases or decreases in the business.
Forward Looking Statements
Forward-looking statement is the disclaimer that projections as to future performance are not guaranteed, and things could go otherwise.
Item 8 - Financial Statements
1. Independent Auditor's Report 2. Consolidated Statements of Operation 3. Consolidated Balance Sheets 4. other accounting reports and notes.
Here, also, is the going concern opinion. This is the opinion of the auditor as to the viability of the company. Look for "unqualified opinion" expressed by auditor. This means the auditor had no hesitations or reservations about the state of the company, and the opinion is without any qualifications (unconditional).
Five percent ownership
Five percent ownership refers to companies or individuals who hold at least 5% of the total value of the stock of a public company. They usually are founders of the company or large mutual fund companies, and because of how much stock they own, they usually have access to the board of directors of the company and hold significant sway over the company.
Five percent owners must also file Schedule 13d with the SEC.
Many traders and investors believe that candlestick charts are easy to read, especially the relationship between the open and the close.
More On $TLFX At PennyStock Tweets
http://www.pennystocktweets.com/stocks/profile/TLFX
Index ETFs
Most ETFs are index funds that attempt to replicate the performance of a specific index. Indexes may be based on stocks, bonds, commodities, or currencies. An index fund seeks to track the performance of an index by holding in its portfolio either the contents of the index or a representative sample of the securities in the index.[5] As of June 2012, in the United States, about 1200 index ETFs exist, with about 50 actively managed ETFs. Index ETF assets are about $1200 billion, compared with about $7 billion for actively managed ETFs.[18] Some index ETFs, known as leveraged ETFs or inverse ETFs, use investments in derivatives to seek a return that corresponds to a multiple of, or the inverse (opposite) of, the daily performance of the index.[19]
Some index ETFs invest 100% of their assets proportionately in the securities underlying an index, a manner of investing called "replication". Other index ETFs use "representative sampling", investing 80% to 95% of their assets in the securities of an underlying index and investing the remaining 5% to 20% of their assets in other holdings, such as futures, option and swap contracts, and securities not in the underlying index, that the fund's adviser believes will help the ETF to achieve its investment objective. For index ETFs that invest in indices with thousands of underlying securities, some index ETFs employ "aggressive sampling" and invest in only a tiny percentage of the underlying securities
How the security's price is displayed, be it a bar chart or candlestick chart, with an arithmetic scale or semi-log scale, is not the most important aspect.
Business Cycle
The graph below shows the idealized business cycle and the intermarket relationships during a normal inflationary environment.
Check Out $FHAI On PennyStock Tweets
http://www.pennystocktweets.com/stocks/profile/FHAI
THREE STAR IN THE SOUTH
We see three consecutive black candlesticks during a downtrend. These candlesticks show that each day is consecutively weaker in a bearish sense and possibly some buying is occurring. Daily small rallies keep the market’s lows from reaching that of the first day. These indications suggest that tide is turning in a bullish direction.

Recognition Criteria:
1. Market is characterized by downtrend.
2. We see a long Black Opening Marubozu in the first day characterized by a long lower shadow just like a Hammer.
3. Then we see a Black Opening Marubozu on the second day similar to the first day however smaller in body with a low above the first day’s low.
4. We finally see a small Black Marubozu on the third day that lies within the second day’s trading range.
Explanation:
The Bullish Three Stars in the South Pattern shows a slowly deteriorating downtrend, which is characterized by less and less daily price movement and consecutively higher lows. Buying enthusiasm is reflected by the long lower shadow of the first day. The next day opens at a higher level, trades lower, but its low is not lower than the previous day's low. This second day also closes off its low. Then we see a black Marubozu, which is engulfed by the previous day's range on the third day. Higher lows cause uneasiness among shorts. The last day of the pattern reflects market indecision, with hardly any price movement. Shorts are now ready to cover positions if they see anything in the upside. Everything points out that the tide is slowly turning toward the bull side.
Important Factors:
A confirmation on fourth day is required to be sure that the downtrend has reversed. This confirmation may be in the form of a white candlestick, a large gap up or a higher close on the fourth day.
Instead, the author identifies a series of factors that brought about these speculative excesses. The meat of the book lists 12 factors that facilitated big market moves from 1995 to 2000 and from 2002 to 2005.
Use PennyStock Tweets For All Your $COHO DD
http://www.pennystocktweets.com/stocks/profile/COHO
Form 10-12B, 10-12B/A ~ SEC Filings Explained
Initial general form for registration of a class of securities pursuant to section 12(b) (and amendment thereto)
Analysts were hesitant to issue sell recommendations because many firms also had investment banking ties with the company. Analysts also did not want to offend the company because they might then be cut off from earnings guidance or key information.
$APXG Profile on PST - For All Your DD Use More http://www.pennystocktweets.com/stocks/stockprofile/APXG
Form N-CSRS ~ SEC Filings Explained
Certified semi-annual shareholder report of registered management investment companies
In this paper, we propose a systematic and automatic approach to technical pattern recognition using nonparametric kernel regression, and apply this method to a large number of U.S. stocks from 1962 to 1996 to evaluate the effectiveness of technical analysis.
$MZRTF Profile on PST - For All Your DD Use More http://www.pennystocktweets.com/stocks/stockprofile/MZRTF
SEC Filings Explained ~ POS AM Form
Post-effective amendments to provide updated prospectus information.
Obviously, deflationary forces change the whole dynamic. Deflation is negative for stocks and commodities, but positive for bonds.
|
Followers
|
3289
|
Posters
|
|
|
Posts (Today)
|
0
|
Posts (Total)
|
2804248
|
|
Created
|
08/22/10
|
Type
|
Free
|
| Moderator Nilbud | |||
| Assistants mick ManicTrader PhotoChick Kirimi $Pistol Pete$ | |||
   Investor Hub Alerts: Sign up for 'STOCKGOODIES PLAYS OF THE WEEK ' E-Mail List Investor Hub Alerts: Sign up for 'STOCKGOODIES PLAYS OF THE WEEK ' E-Mail ListUPDATE; 5-1-22 courtesy of charting /\ wit tweezer top calls /\ Tony @Montana_Trades Really good study sheet on Candlestick Patterns [-chart]pbs.twimg.com/media/FRn8188XMAAdZvk?format=jpg&name=small[/chart] 

02-07-2021
|
|
Posts Today
|
0
|
|
Posts (Total)
|
2804248
|
|
Posters
|
|
|
Moderator
|
|
|
Assistants
|
| Volume | |
| Day Range: | |
| Bid Price | |
| Ask Price | |
| Last Trade Time: |


