 News
News  Market Data
  Discover
Support: 888-992-3836
Copyright © 2023 InvestorsHub Inc.


Register for free to join our community of investors and share your ideas. You will also get access to streaming quotes, interactive charts, trades, portfolio, live options flow and more tools.
Check Out $DNAG On PennyStock Tweets
http://www.pennystocktweets.com/stocks/profile/DNAG

If you have a mechanical trading system that works, an
d you follow it consistently,your trading will be consistent despite the
inner emotional struggles that might come from a long series of losses, or a large profit. The confidence, consistency, and discipline afforded by a thoroughly tested mechanical system are the key to many of
the most profitable traders’ success.
Solid One for you to DD
$GRCK .01 break imminent (CBD Company (low floater)
Extremely low market cap of only
1.3 million.
Latest News
http://m.marketwired.com/press-release/grey-cloak-tech-inc-to-introduce-cannabio-salve-at-mjbizcon-in-las-vegas-otcqb-grck-2240010.htm
All PR’s
http://www.otcmarkets.com/stock/GRCK/news
Free L2 link as its an OTCQB ticker
http://www.otcmarkets.com/stock/GRCK/quote
Share Structure , very tiny market cap & float for a CDB company
http://www.otcmarkets.com/stock/GRCK/profile
GRCK Security Details
Share Structure
Market Value1 $1,318,280 a/o Nov 09, 2017
Authorized Shares 500,000,000 a/o Nov 07, 2017
Outstanding Shares 141,143,444 a/o Nov 07, 2017
-Restricted Not Available
-Unrestricted Not Available
Held at DTC Not Available
Float 133,823,444 a/o Nov 07, 2017
CEO video
$GRCK Grey Cloak Tech Completes Acquisition of Eqova Life Sciences https://t.co/PnOEuwjDOO via @Marketwired #investors #CBD #microcaps pic.twitter.com/qqefZxsv1s
— GreyCloakTech (@GreyCloakTech) October 25, 2017
WHITE SPINNING TOP
The White Spinning Top is a single candlestick pattern. Its shape is a small white body with upper and lower shadows that have a greater length than the body's length.
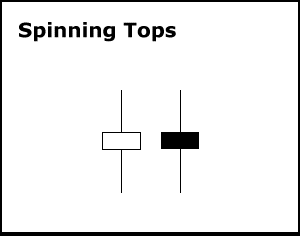
Recognition Criteria:
1. The real body of the pattern is white and small.
2. The upper and lower shadows are longer than the real body's length.
Explanation:
The market moves higher and then sharply lower, or vice versa. It then closes above the opening price creating a white body. This represents complete indecision between the bulls and the bears. The actual length of the shadows is not important. The small body relative to the shadows is what makes the spinning top.
Important Factors:
If a White Spinning Top is observed after a long rally or a long white candlestick, this implies weakness among the bulls and it is a warning about a potential change or interruption in trend.
If a White Spinning Top is observed after a long decline or a long black candlestick, this implies weakness among the bears and it is a warning about a potential change or interruption in trend.
Like most other single candlestick patterns, the White Spinning Top has low reliability. It reflects only one day's trading and can be interpreted both as a continuation and a reversal pattern. This candlestick needs to be used with other candlesticks for a healthier confirmation of a trend. 
Higher prices led to more news and more news led to more investment money. A feedback loops evolved where price increases were feeding more price increases. Shiller calls these mechanisms naturally occurring Ponzi schemes because they feed on the perception of prior success.

More On $CTLE At PennyStock Tweets
http://www.pennystocktweets.com/stocks/profile/CTLE
There are twelve types of trades available when you start online stock trading. These include the market trade, limit trade, stop loss, day orders, good-till-canceled trades, trailing stops, bracket trades, and more. 
Conclusion and Critiques
Shiller identified several credible factors that influenced investment decisions during the bubble years. Many of these factors exist today and his analysis provides food for thought when considering behavioral finance.
Check Out $SRCH On PennyStock Tweets
http://www.pennystocktweets.com/stocks/profile/SRCH
BEARISH BELT HOLT
The Bearish Belt Hold Pattern is a single candlestick pattern and it is basically a Black Opening Marubozu that occurs in an uptrend. The pattern shows that the day opens on its high, it then rallies against the trend of the market, and then closes near its low but not necessarily at its low. Longer bodies for Belt Hold are indicative of more resistance to the trend they are countering.

Recognition Criteria:
1. There is an overall uptrend in the market.
2. The day gaps up and prices open on their high but then prices move down closing near its low for the day.
3. We then see a black body characterized by the absence of upper shadow, which is called a Black Opening Marubozu.
Explanation:
We have a market that is trending up when a significant gap in the direction of trend occurs as the day opens. However; then prices reverse direction and all further price action of the day is the opposite of the previous trend. Such a move causes concern among the bulls and leads them to sell many positions. This strengthens the reversal and turns into a sell-off.
Important Factors:
A confirmation of the trend reversal with either a black candlestick, a large gap down or a lower close on the next trading day is required.
Continue with trades that show you a profit taking some off the table as it moves higher , selling on the ask does not kill the momentum.
As the sine wave crosses the centerline, the economy moves from contraction to the three phases of economic expansion (strengthening, topping and weakening). Stage 6 shows the economy in an expansion phase, but weakening after a top.

Definitions For The Fifth Letter Of Ticker Symbols
Have you ever wondered what that fifth letter at the end of the stock symbol is? It signifies that the issuer may have additional circumstances involved with the stock. Most recognizable is the infamous "E".
Complete "Letter" list enclosed below. You may want to print it out for your own reference.
The Eligibility Rule protects investors by ensuring that they have access to companies current financial information when considering investments in OTCBB-eligible securities.
Nasdaq will continue to monitor the filing status of all OTCBB issuers. In the event of a filing delinquency, Nasdaq will append the trading symbol(s) of the delinquent issuer's security with an "E". The fifth character "E" will be removed from the symbol once Nasdaq receives notification that the security meets the requirements of the Eligibility Rule. After 30 days (60 days for non-SEC filers), if Nasdaq has not been notified that the appropriate filing has been made with the issuer's regulatory authority, the issuer's security will be removed from the OTCBB.
Code: Meaning
A: Class A.
B: Class B.
C: Exempt from Nasdaq listing requirements for a limited period of time.
D: A new issue of an existing stock. (Often the result of a reverse split.)
E: Delinquent in required filings with the SEC as determined by the NASD.
F: Foreign.
G: First Convertible Bond.
H: Second Convertible Bond, same company.
I: Third Convertible Bond, same company.
J: Voting.
K Non-voting.
L: Miscellaneous situations such as foreign preferred, preferred when-issued, a second class of units, a third class of warrants, or a sixth class of preferred stock.
M: Fourth preferred, same company.
N: Third preferred, same company.
O: Second preferred, same company.
P: First preferred.
Q: In bankruptcy proceedings.
R: Rights.
S: Beneficial interest.
T: With warrants or with rights.
U: Units.
V: When-issued and when-distributed.
W: Warrants.
X: Mutual Fund.
Y: ADR (American Depositary Receipts).
Z: Miscellaneous situations such as a second class of warrants, a fifth class of preferred stock, a stub, a foreign preferred when-issued, or any unit, receipt, or certificate representing a limited partnership interest."
$NILA Profile on PST - For All Your DD Use More http://www.pennystocktweets.com/stocks/stockprofile/NILA
Either way, to buy on the rumor pays off for the short-term trader who keeps her finger on the trigger. Evaluating forecasts and being mentally ready to buy or sell at the moment of impact of the news is a difficult and risky business. It’s no wonder risk-averse traders get out of the market altogether around scheduled event dates.
Shiller reports that more people viewed money as important to success in the mid 90s than in the mid 70s. Society viewed successful businessmen more favorably than scientists or artists.
More On $XCHO At PennyStock Tweets
http://www.pennystocktweets.com/stocks/profile/XCHO
Shooting Star
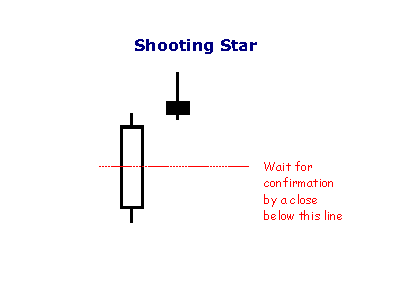
The shooting star is a type of bearish reversal pattern. The Shooting Star looks exactly the same as the Inverted hammer, but instead of being found in a downtrend it is found in an uptrend and thus has different implications. Like the Inverted hammer it is made up of a candle with a small lower body, little or no lower wick, and a long upper wick that is at least two times the size of the lower body.
The long upper wick of the candlestick pattern indicates that the buyers drove prices up at some point during the period in which the candle was formed but encountered selling pressure which drove prices back down for the period to close near to where they opened. As this occurred in an uptrend the selling pressure is seen as a potential reversal sign. When encountering this pattern traders will look for a lower open on the next period before considering the pattern valid and potentially including it in their trading strategy.
As with the Inverted hammer most traders will see a longer wick as a sign of a greater potential reversal and like to see an increase in volume on the day the Shooting Star forms.
Rule # 1 always "TAKE PROFIT WHEN YOU CAN" a small gain is better than a loss
Technical analysis is not an exact science and it is sometimes difficult to set exact support levels.
$AERO Profile on PST - For All Your DD Use More http://www.pennystocktweets.com/stocks/stockprofile/AERO
BULLISH KICKING PATTERN
The Bullish Kicking Pattern is a White Marubozu following a Black Marubozu. After the Black Marubozu, market gaps sharply higher on the opening and it opens with a gap above the prior session’s opening thus forming a White Marubozu.

Recognition Criteria:
1. Market direction is not important.
2. We first see a Black Marubozu pattern.
3. Then we see a White Marubozu that gaps upward on the second day.
Explanation:
This Bullish Kicking Pattern is a strong sign showing that the market is headed upward. The previous market direction is not important for this pattern unlike most other candle patterns. The market is headed up with the Bullish Kicking Pattern as the prices gap up the next day. The prices never enter into the previous day's range. Instead they close with another gap.
Important Factors:
We should be careful that both of the patterns do not have any shadows or they have only very small shadows (they both are Marubozu).
The Bullish Kicking Pattern is somewhat similar to the Bullish Separating Lines Pattern. The opening prices are equal in Bullish Separating Lines Pattern while in the Bullish Kicking Pattern a gap occurs.
The Bullish Kicking Pattern is highly reliable, but still, a confirmation of the reversal on the third day should be sought. This confirmation may be in the form of a white candlestick, a large gap up or a higher close on the third day.
In the beginning, reduce the use of margin. Although trading with margin looks very tempting, you must remember that until you have become fully skillful in the stock market trading, handling your feeling, or charts you should never go after it. By the time margin is capable of giving you greater profits, it has the advantage. However, remember that it can also eliminate your account causing you the disadvantages.
Use PennyStock Tweets For All Your $ORMP DD
http://www.pennystocktweets.com/stocks/profile/ORMP
Dollar and Commodities
While the Dollar and currency markets are part of intermarket analysis, the Dollar is a bit of a wild card. As far as stocks are concerned, a weak Dollar is not bearish unless accompanied by a serious advance in commodity prices.
Bollinger Bands aka Bollies
Developed by John Bollinger, Bollinger Bands® are volatility bands placed above and below a moving average. You will find that most of the time stocks will trade within the Bollies. Volatility is based on the standard deviation, which changes as volatility increases and decreases. The bands widen when volatility increases and narrow when volatility decreases. This dynamic nature of Bollinger Bands also means they can be used on different securities with the standard settings.
Note: Bollinger Bands® is a registered trademark of John Bollinger.
Below is a chart showing Bollinger Bands:
Pink line is the Upper Bollie or UBB
Blue line is the Lower Bollie or LBB
White line is the Middle Bollie or 20 SMA
Note how during the down trend the price stayed between the Lower
The hard trade is the right trade: If it is easy to sell, don't; and if it is easy to buy, don't. Do the trade that is hard to do and that which the crowd finds objectionable. Peter Steidelmeyer taught us this twenty five years ago and it holds truer now than then.
Thus it appears that the stock market crash had substantially to do with a psychological feedback loop among the general investing public from price declines to selling and thus to further price declines, along the lines of a negative bubble.
Investment Use of ETF’s
ETFs generally provide the easy diversification, low expense ratios, and tax efficiency of index funds, while still maintaining all the features of ordinary stock, such as limit orders, short selling, and options. Because ETFs can be economically acquired, held, and disposed of, some investors invest in ETF shares as a long-term investment for asset allocation purposes, while other investors trade ETF shares frequently to implement market timing investment strategies.[5] Among the advantages of ETFs are the following:[8][17]
? Lower costs – ETFs generally have lower costs than other investment products because most ETFs are not actively managed and because ETFs are insulated from the costs of having to buy and sell securities to accommodate shareholder purchases and redemptions. ETFs typically have lower marketing, distribution and accounting expenses, and most ETFs do not have 12b-1 fees.
? Buying and selling flexibility – ETFs can be bought and sold at current market prices at any time during the trading day, unlike mutual funds and unit investment trusts, which can only be traded at the end of the trading day. As publicly traded securities, their shares can be purchased on margin and sold short, enabling the use of hedging strategies, and traded using stop orders and limit orders, which allow investors to specify the price points at which they are willing to trade.
? Tax efficiency – ETFs generally generate relatively low capital gains, because they typically have low turnover of their portfolio securities. While this is an advantage they share with other index funds, their tax efficiency is further enhanced because they do not have to sell securities to meet investor redemptions.
? Market exposure and diversification – ETFs provide an economical way to rebalance portfolio allocations and to "equitize" cash by investing it quickly. An index ETF inherently provides diversification across an entire index. ETFs offer exposure to a diverse variety of markets, including broad-based indices, broad-based international and country-specific indices, industry sector-specific indices, bond indices, and commodities.
? Transparency – ETFs, whether index funds or actively managed, have transparent portfolios and are priced at frequent intervals throughout the trading day.
Some of these advantages derive from the status of most ETFs as index funds.
More On $MYFT At PennyStock Tweets
http://www.pennystocktweets.com/stocks/profile/MYFT
Paying for research and analysis can be both educational and useful. Some investors may find watching or observing market professionals to be more beneficial than trying to apply newly learned lessons themselves
Chartists can compare the performance of these two with a simple ratio chart of the Consumer Discretionary SPDR (XLY) divided by the Consumer Staples SPDR (XLP).
Form N-8F ~ SEC Filings Explained
Application for deregistration made on Form N-8F
$HOMJF Profile on PST - For All Your DD Use More http://www.pennystocktweets.com/stocks/stockprofile/HOMJF
Rule #4... Go back and look at past awareness days on the stock you thinking of buying off the momo hype and see how it traded will help you also as it will more than likely have the same sellers selling what they have left in most cases ... were they smart traders or morons
Form S-6 ~ SEC Filings Explained
Initial registration statement filed on Form S-6 for unit investment trusts
Second, as inferred above, Shiller asserts that public attention to the stock market hit new levels in the 1990's. This heightened awareness made more money available for stocks.
Use PennyStock Tweets For All Your $PARA DD
http://www.pennystocktweets.com/stocks/profile/PARA
NITE : This is the king MM of the OTCBB. He intimides traders and other MMs use that to their advantage knowing that he scares them. That's why NITE is the shaker on most stock runs; he is the most common ax. NITE could be on the ask all the time, he could be leading a dip scaring sellers to SCHB and TDCM on the bid.
Below is a table in order of the sum of the 3, 6, and 12 month returns for individual country ETFs. Each column represents returns for various timeframes and the percent each ETF is above (or below) the 200 day moving averages as of January's close. This list is tracked monthly on the right hand side of my blog Scott's Investments.
Note that all country ETFs are above their 200 day moving average except PGJ (China), GXC (China), FXI (China), EWP (Spain), EWG (Germany), and EWI (Italy). This is a significant change versus last month when none of the ETFs were below the 200 day SMA.
The top 5 based on the sum of the 3-6-12 month returns are below. There are some familiar names: RSX (Russia), [[[TUR]] (Turkey), EIS (Israel), EWZ (Brazil), and ECH (Chile). At the end of December the top 5 were the same 5 ETFs in slightly different order.
One potential strategy investors could use would be to purchase the top ETFs based on the sum of their returns over 3, 6, and 12 months. Or, one could purchase ETFs based solely on 6 month returns (a strategy featured on ETF Screen). An additional twist would be to only purchase the top performing ETFs if they are also above the 200 day moving average.
The data source for the information below is Finviz, which has some of the best free financial data on the web (as well as a new elite service).
Ticker Company Free Trend Analysis Performance (Quarter) Half Year Year Sum 200-Day SMA Price
RSX
Market Vectors Russia ETF Here
12.94% 38.50% 182.29% 233.73% 20.76% 31.08
TUR
iShares MSCI Turkey Invest Mkt Index Here
14.10% 24.74% 134.01% 172.85% 24.26% 55.67
EIS
iShares MSCI Israel Cap Invest Mkt Index Here
10.16% 15.36% 79.76% 105.28% 16.10% 54
EWZ
iShares MSCI Brazil Index Here
-0.19% 16.16% 87.45% 103.42% 5.79% 64.69
ECH
iShares MSCI Chile Investable Mkt Idx Here
15.11% 20.09% 67.13% 102.33% 17.48% 55.77
EWA
iShares MSCI Australia Index Here
-3.39% 16.57% 84.76% 97.94% 8.08% 21.1
PIN
PowerShares India Here
4.23% 8.42% 81.28% 93.93% 6.56% 20.72
THD
iShares MSCI Thailand Invest Mkt Index Here
1.35% 12.40% 80.09% 93.84% 7.61% 39.71
EWT
iShares MSCI Taiwan Index Here
3.43% 7.96% 79.61% 91.00% 6.98% 12.07
EWW
iShares MSCI Mexico Investable Mkt Idx Here
7.25% 15.35% 66.12% 88.72% 9.43% 46
EWY
iShares MSCI South Korea Index Here
4.85% 10.59% 71.28% 86.72% 9.01% 45.44
EWD
iShares MSCI Sweden Index Here
-2.11% 8.14% 76.67% 82.70% 5.41% 22.72
EWS
iShares MSCI Singapore Index Here
4.86% 5.69% 69.50% 80.05% 8.51% 10.78
EZA
iShares MSCI South Africa Index Here
4.72% 10.71% 62.04% 77.47% 5.40% 52.63
EWO
iShares MSCI Austria Investable Mkt Idx Here
-3.79% 13.32% 67.86% 77.39% 2.43% 18.8
EWK
iShares MSCI Belgium Investable Mkt Idx Here
1.37% 18.49% 56.41% 76.27% 7.73% 12.56
EWN
iShares MSCI Netherlands Invstbl Mkt Idx Here
2.65% 16.23% 49.42% 68.30% 9.26% 19.68
PGJ
PowerShares Gldn Dragon Halter USX China Here
0.14% -3.32% 71.34% 68.16% -0.44% 22.12
EWM
iShares MSCI Malaysia Index Here
1.44% 10.47% 54.92% 66.83% 8.63% 10.55
GXC
SPDR S
Mutual funds became a regular part of 401K's. Money moving into these mutual funds from 401K's and individual investors found its way into the stock market to feed the bubble. Shiller also notes that widespread advertising compounded this growth and increased public awareness to new levels.
More On $BRWC At PennyStock Tweets
http://www.pennystocktweets.com/stocks/profile/BRWC
What is the SEC? The Securities and Exchange Commission (SEC) is the government agency responsible for protecting investors by monitoring and regulating brokers, dealers, and the stock and bond markets in the U.S.
On the technical side, the "Castle-in-the-Air Theory" assumes that successful investing depends on behavioral finance. Investors must determine the mood of the market - bull or bear. Valuations are not important because a security is only worth what someone is willing to pay for it.
$GEFI Profile on PST - For All Your DD Use More http://www.pennystocktweets.com/stocks/stockprofile/GEFI
DEF 14A~ SEC Filings Explained
A proxy statement is a statement required of a firm when soliciting shareholder votes. This statement is filed in advance of the annual meeting. The firm needs to file a proxy statement, otherwise known as a Form DEF 14A (Definitive Proxy Statement), with the U.S. Securities and Exchange Commission. This statement is useful in assessing how management is paid and potential conflict-of-interest issues with auditors. The statement includes:
? Voting procedure and information.
? Background information about the company's nominated directors including relevant history in the company or industry, positions on other corporate boards, and potential conflicts in interest.
? Board compensation.
? Executive compensation, including salary, bonus, non-equity compensation, stock awards, options, and deferred compensation. Also, information is included about perks such as personal use of company aircraft, travel, and tax gross-ups. Many companies will also include pre-determined payout packages for if an executive leaves the company.
? Who is on the audit committee, as well as a breakdown of audit and non-audit fees paid to the auditor.
SEC proxy rules: The term "proxy statement" means the statement required by Section 240.14a-3(a) whether or not contained in a single document.
In many cases, shareholder votes - particularly institutional shareholder votes - are determined by proxy firms which advise the shareholders...
Traditionally, broker-dealers have been permitted to vote for "routine" proposals on behalf of their shareholders if the shareholders do not return the proxy statement. This has been controversial, and in 2006 the NYSE Proxy Working Group recommended that the rules be modified so that uncontested director elections were not considered routine.[1] The SEC approved the rule on July 1, 2009.[2]
In July 2010, the SEC announced that it was seeking public comment on the efficiency of the proxy system.[3]
There has been some controversy over "proxy access" which is a method to allow shareholders to nominate candidates which appear on the proxy statement. Currently, only the nominating board can place candidates on the proxy statement. The United States Dodd–Frank Wall Street Reform and Consumer Protection Act specifically allowed the SEC to rule on this issue. In 2010, the SEC passed a rule which allowed certain shareholders to place candidates on the proxy statement,;[4] however, the rule was struck down by the United States Court of Appeals for the District of Columbia Circuit in 2011
Involving yourself in a downward as well as in upward is important. When stocks are climbing up, most of the investors wholly trade. Learning to make a profit on both downtrend and uptrend moves is essentials to be winning trader.
The above chart for Halliburton (HAL)[HAL] shows a large trading range between Dec-99 and Mar-00.
For All Your $STVF DD ~ Use PennyStock Tweets
http://www.pennystocktweets.com/stocks/profile/STVF
13H, 13H-Q, 13H-A, 13H-I, 13H-R, 13H-T ~ SEC Filings Explained
Large Trader Registration Information Required of Large Traders Pursuant to the Securities Exchange Act of 1934 and Rule 13h-1 Thereunder. Initial Filing (13H), Amended Filing (13H-Q), Annual Filing (13H-A), Inactive Status (13H-I), Reactivated Status (13H-R), and Termination Filing (13H-T)
|
Followers
|
3286
|
Posters
|
|
|
Posts (Today)
|
0
|
Posts (Total)
|
2804248
|
|
Created
|
08/22/10
|
Type
|
Free
|
| Moderator Nilbud | |||
| Assistants mick ManicTrader PhotoChick Kirimi $Pistol Pete$ | |||
   Investor Hub Alerts: Sign up for 'STOCKGOODIES PLAYS OF THE WEEK ' E-Mail List Investor Hub Alerts: Sign up for 'STOCKGOODIES PLAYS OF THE WEEK ' E-Mail ListUPDATE; 5-1-22 courtesy of charting /\ wit tweezer top calls /\ Tony @Montana_Trades Really good study sheet on Candlestick Patterns [-chart]pbs.twimg.com/media/FRn8188XMAAdZvk?format=jpg&name=small[/chart] 

02-07-2021
|
|
Posts Today
|
0
|
|
Posts (Total)
|
2804248
|
|
Posters
|
|
|
Moderator
|
|
|
Assistants
|
| Volume | |
| Day Range: | |
| Bid Price | |
| Ask Price | |
| Last Trade Time: |


