 News
News  Market Data
  Discover
Support: 888-992-3836
Copyright © 2023 InvestorsHub Inc.


Register for free to join our community of investors and share your ideas. You will also get access to streaming quotes, interactive charts, trades, portfolio, live options flow and more tools.
Dragon Fly Doji usually occurs when a downward change is about to break.

Long Legged Doji indicates a battle between the Bulls and Bears that resulted in a draw. When this happens trend is usually broken from an uptrend to a downturn OR from a downtrend to an upturn.


SEC Filings Explained ~ F-1
Registration statement for certain foreign private issuers.
SEC Filings Explained ~ Form 4
Form 4 is a United States SEC filing that relates to insider trading. Every director, officer or owner of more than ten percent of a class of equity securities registered under Section 12 of the Securities Exchange Act of 1934 must file with the United States Securities and Exchange Commission a statement of ownership regarding such security. The initial filing is on Form 3 and changes are reported on Form 4. The Annual Statement of beneficial ownership of securities is on Form 5. The forms contain information on the reporting person's relationship to the company and on purchases and sales of such equity securities.
Form 4 is stored in SEC's EDGAR database. EDGAR is Electronic Data Gathering, Analysis and Retrieval System. It is a registered trademark of the SEC.
A Form 4 must be filed before the end of the second business day following a change in ownership of securities or derivative securities (including the exercise or grant of stock options) for individuals subject to Section 16 of the Securities Exchange Act of 1934.
BULLISH ENGULFING
Bullish Engulfing Pattern is a pattern characterized by a large white real body engulfing a preceding small black real body, which appears during a downtrend. The white body does not necessarily engulf the shadows of the black body but totally engulfs the body itself. The Bullish Engulfing Pattern is an important bottom reversal signal.
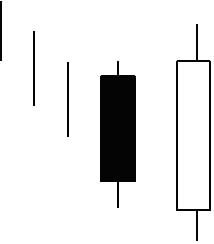
Recognition Criteria:
1. Market is characterized by downtrend.
2. Then we see a small black body.
3. Next day we see a white body that completely engulfs the black real body of the preceding day.
Explanation:
While the market sentiment is bearish; we see some subsided selling reflected by the short, black real body of the first day. Next day shows bull strength with a closing price at or above the previous day’s open. It means that the downtrend is now losing momentum and the bulls started to take the lead.
Important Factors:
The relative size of the bodies in the first and second days is important. If the first day of the Bullish Engulfing Pattern is characterized by a very small real body (it may even be a doji or nearly a doji) but the second day is characterized by a very long real body, this strongly indicates that the bearish power is diminishing and the disparity of white versus black body is indicative of the emerging bull power.
There is higher probability of a bullish reversal if there is heavy volume on the second real body or if the second day of the Bullish Engulfing Pattern engulfs more than one real body (which essentially means we see two or more small black bodies preceding the long white body).
The reversal of downtrend needs further confirmation on the third day. This confirmation may be in the form of a white candlestick, a large gap up or a higher close on the third day.
Evening Star
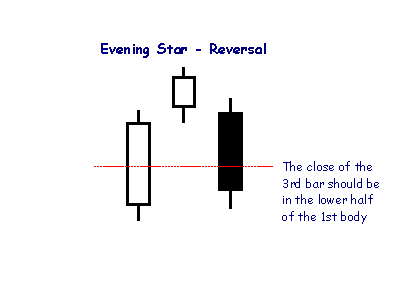
The Evening Star pattern is opposite to Morning Star and is a reversal signal at the end of an up-trend. The pattern is more bearish if the second candlestick is filled rather than hollow.
Form 1-E AD, 1-E AD/A ~ SEC Filings Explained
Sales material filed pursuant to Rule 607 under Regulation E. (and amendment thereto)
Form 18-K, 18-K/A ~ SEC Filings Explained
Annual report for foreign governments (and amendment thereto)
BEARISH BREAKAWAY
We see this pattern during an uptrend marked with a bullish surge that eventually weakens. This weakening is illustrated by a long black candlestick that is unable to close the gap into the body of the first day. These events warn us about a short-term reversal.
Recognition Criteria:
1. Market is characterized by uptrend.
2. We see a long white candlestick in the first day.
3. Then we see a white candlestick with a gap above the first day on the second day.
4. However the third and fourth days continue in the direction of the second day with higher consecutive closes.
5. Finally we see a long black candlestick on the fifth day with a closing price inside the gap caused by the first and second days.
Explanation:
The Bearish Breakaway Pattern is constituted by a gap in the direction of the uptrend followed by three consecutively higher price days. This shows that the trend has suddenly accelerated with a big gap but then it started to fizzle, however it still manages to move in the same direction. There is evidently a slow deterioration of the trend even though the uptrend continues. Finally, we see a burst in the opposite direction completely recovering the previous three days' price action. A possible reversal is also implied by the fact the gap has not been filled. We are now ready for a short-term reversal.
Important Factors:
A confirmation on the sixth day is recommended in the form of a black candlestick, a large gap down or a lower close to be sure that there is indeed a reversal.
BULLISH BREAKAWAY
There is a downtrend but we also see that the prices bottom out and level off now. The result is a long white candlestick that however does not close the initial downward gap of the first and second days. This suggests a short-term reversal.
Recognition Criteria:
1. Market is characterized by downtrend.
2. We see a long black candlestick in the first day.
3. Then we see a black candlestick on the second day with a gap below the first day.
4. Bearish mood continues on the third and fourth days as evidenced by lower consecutive closes.
5. Finally however, we see a long white candlestick on the fifth day characterized by a closing price inside the gap caused by the first and second days.
Explanation:
The Bullish Breakaway Pattern appears during a downtrend and it shows that selling accelerated to the point of an oversold market. It starts with a long black day then involves a gap in the direction of the downtrend followed by three consecutively lower price days. So far, all days in this pattern are black with the exception of the third day, which can be either be black or white. The three days after the gap are similar to the Three Black Crows pattern since their highs and lows are each consecutively lower. It is by now apparent that the downtrend has accelerated with a big gap and then starts to fizzle, however it still continues. There is an evident slow deterioration of the downtrend suggested by this pattern. Finally, we see a burst in the opposite direction, which completely recovers the previous three days' price action. The gap is not filled which points out to the weakness of the reversal. This is a short-term reversal.
Important Factors:
A confirmation on the sixth day is recommended in the form of a white candlestick, a large gap up or a higher close, to be sure about the reversal.
Form N-30D ~ SEC Filings Explained
Initial annual and semi-annual reports mailed to investment company shareholders
Form TA-W ~ SEC Filings Explained
Notice of withdrawal from registration as transfer agent filed pursuant to the Securities Exchange Act of 1934
FOUR PRICE DOJI
The Four Price Doji is a single candlestick pattern. It is simply a horizontal line that has no upper or lower shadows.

Recognition Criteria:
1. The body is a horizontal line.
2. There are no upper or lower shadows at all.
3. The open, close, high and low are the same throughout the entire day.
Explanation:
A Four Price Doji is a very rare occurrence and it may be seen only if all the four price components are equal. That is, the open, high, low, and close turn out to be the same. It represents complete and total uncertainty by traders concerning the market direction.
Important Factors:
The Four Price Doji usually occurs when a stock is very illiquid, has low volume, or the data source do not report any other price other than the closing price.
The Four Price Doji is not reliable like most other single candlestick patterns. It only reflects one day's trading and conveys a sense of complete indecision. It usually is interpreted as a reversal pattern however this indicator must be used with other candlesticks for a healthier judgment about the course of the trend.
Like all other doji types, Four Price Doji is also important only in markets where there are not many doji. In a chart characterized by many doji, the emergence of Four Price Doji do not have a signal value.
Form 15F-12G, 15F-12G/A ~ SEC Filings Explained
Notice of termination of a foreign private issuer's registration of a class of securities under Section 12(g) (and amendment thereto)
Form N-Q ~ SEC Filings Explained
Quarterly Schedule of Portfolio Holdings of Registered Management Investment Company
Below is a table in order of the sum of the 3, 6, and 12 month returns for individual country ETFs. Each column represents returns for various timeframes and the percent each ETF is above (or below) the 200 day moving averages as of January's close. This list is tracked monthly on the right hand side of my blog Scott's Investments.
Note that all country ETFs are above their 200 day moving average except PGJ (China), GXC (China), FXI (China), EWP (Spain), EWG (Germany), and EWI (Italy). This is a significant change versus last month when none of the ETFs were below the 200 day SMA.
The top 5 based on the sum of the 3-6-12 month returns are below. There are some familiar names: RSX (Russia), [[[TUR]] (Turkey), EIS (Israel), EWZ (Brazil), and ECH (Chile). At the end of December the top 5 were the same 5 ETFs in slightly different order.
One potential strategy investors could use would be to purchase the top ETFs based on the sum of their returns over 3, 6, and 12 months. Or, one could purchase ETFs based solely on 6 month returns (a strategy featured on ETF Screen). An additional twist would be to only purchase the top performing ETFs if they are also above the 200 day moving average.
The data source for the information below is Finviz, which has some of the best free financial data on the web (as well as a new elite service).
Ticker Company Free Trend Analysis Performance (Quarter) Half Year Year Sum 200-Day SMA Price
RSX
Market Vectors Russia ETF Here
12.94% 38.50% 182.29% 233.73% 20.76% 31.08
TUR
iShares MSCI Turkey Invest Mkt Index Here
14.10% 24.74% 134.01% 172.85% 24.26% 55.67
EIS
iShares MSCI Israel Cap Invest Mkt Index Here
10.16% 15.36% 79.76% 105.28% 16.10% 54
EWZ
iShares MSCI Brazil Index Here
-0.19% 16.16% 87.45% 103.42% 5.79% 64.69
ECH
iShares MSCI Chile Investable Mkt Idx Here
15.11% 20.09% 67.13% 102.33% 17.48% 55.77
EWA
iShares MSCI Australia Index Here
-3.39% 16.57% 84.76% 97.94% 8.08% 21.1
PIN
PowerShares India Here
4.23% 8.42% 81.28% 93.93% 6.56% 20.72
THD
iShares MSCI Thailand Invest Mkt Index Here
1.35% 12.40% 80.09% 93.84% 7.61% 39.71
EWT
iShares MSCI Taiwan Index Here
3.43% 7.96% 79.61% 91.00% 6.98% 12.07
EWW
iShares MSCI Mexico Investable Mkt Idx Here
7.25% 15.35% 66.12% 88.72% 9.43% 46
EWY
iShares MSCI South Korea Index Here
4.85% 10.59% 71.28% 86.72% 9.01% 45.44
EWD
iShares MSCI Sweden Index Here
-2.11% 8.14% 76.67% 82.70% 5.41% 22.72
EWS
iShares MSCI Singapore Index Here
4.86% 5.69% 69.50% 80.05% 8.51% 10.78
EZA
iShares MSCI South Africa Index Here
4.72% 10.71% 62.04% 77.47% 5.40% 52.63
EWO
iShares MSCI Austria Investable Mkt Idx Here
-3.79% 13.32% 67.86% 77.39% 2.43% 18.8
EWK
iShares MSCI Belgium Investable Mkt Idx Here
1.37% 18.49% 56.41% 76.27% 7.73% 12.56
EWN
iShares MSCI Netherlands Invstbl Mkt Idx Here
2.65% 16.23% 49.42% 68.30% 9.26% 19.68
PGJ
PowerShares Gldn Dragon Halter USX China Here
0.14% -3.32% 71.34% 68.16% -0.44% 22.12
EWM
iShares MSCI Malaysia Index Here
1.44% 10.47% 54.92% 66.83% 8.63% 10.55
GXC
SPDR S
Form NT 10-Q ~ SEC Filings Explained
Notice under Rule 12b25 of inability to timely file all or part of a form 10-Q or 10-QSB
Issuers of ETFs
? AdvisorShares issues actively managed ETFs.
? Bips Investment Managers issues Bips (Beta Investment Performance Securities).
? BNP Paribas issues EasyETFs.
? BlackRock issues iShares.
? Charles Schwab offers several commission-free ETFs for its clients.
? Deutsche Bank issues db x-trackers ETFs, as well as managing PowerShares DB commodity- and currency-based ETFs.
? ETF Securities issues ETFs or specialised commodity ETCs.
? Global X Funds issues ETFs.
? Guggenheim Funds issues specialty Guggenheim Funds ETFs.
? Invesco issues PowerShares ETFs, as well as BLDRS based on American Depositary Receipts.
? Lyxor Asset Management issues Lyxor ETFs.
? Merrill Lynch issues HOLDRs.
? Source UK Services, a European joint-venture between Bank of America Merrill Lynch, Goldman Sachs, Morgan Stanley, Nomura and J. P. Morgan issues ETFs and ETCs
? State Street Global Advisors issues SPDRs.
? Van Eck Global issues Market Vectors ETFs.
? Vanguard Group issues Vanguard ETFs, formerly known as VIPERs.
Form N-6 ~ SEC Filings Explained
Registration statement for separate accounts
Ichimoku Clouds
Introduction
The Ichimoku Cloud, also known as Ichimoku Kinko Hyo, is a versatile indicator that defines support and resistance, identifies trend direction, gauges momentum and provides trading signals. Ichimoku Kinko Hyo translates into "one look equilibrium chart". With one look, chartists can identify the trend and look for potential signals within that trend. The indicator was developed by Goichi Hosoda, a journalist, and published in his 1969 book. Even though the Ichimoku Cloud may seem complicated when viewed on the price chart, it is really a straight forward indicator that is very usable. It was, after all, created by a journalist, not a rocket scientist! Moreover, the concepts are easy to understand and the signals are well-defined.
Calculation
Four of the five plots within the Ichimoku Cloud are based on the average of the high and low over a given period of time. For example, the first plot is simply an average of the 9-day high and 9-day low. Before computers were widely available, it would have been easier to calculate this high-low average rather than a 9-day moving average. The Ichimoku Cloud consists of five plots:
Tenkan-sen (Conversion Line): (9-period high 9-period low)/2))
The default setting is 9 periods and can be adjusted. On a daily
chart, this line is the mid point of the 9 day high-low range,
which is almost two weeks.
Kijun-sen (Base Line): (26-period high 26-period low)/2))
The default setting is 26 periods and can be adjusted. On a daily
chart, this line is the mid point of the 26 day high-low range,
which is almost one month).
Senkou Span A (Leading Span A): (Conversion Line Base Line)/2))
This is the midpoint between the Conversion Line and the Base Line.
The Leading Span A forms one of the two Cloud boundaries. It is
referred to as "Leading" because it is plotted 26 periods in the future
and forms the faster Cloud boundary.
Senkou Span B (Leading Span B): (52-period high 52-period low)/2))
On the daily chart, this line is the mid point of the 52 day high-low range,
which is a little less than 3 months. The default calculation setting is
52 periods, but can be adjusted. This value is plotted 26 periods in the future
and forms the slower Cloud boundary.
Chikou Span (Lagging Span): Close plotted 26 days in the past
The default setting is 26 periods, but can be adjusted.
This tutorial will use the English equivalents when explaining the various plots. The chart below shows the Dow Industrials with the Ichimoku Cloud plots. The Conversion Line (blue) is the fastest and most sensitive line. Notice that it follows price action the closest. The Base Line (red) trails the faster Conversion Line, but follows price action pretty well. The relationship between the Conversion Line and Base Line is similar to the relationship between a 9-day moving average and 26-day moving average. The 9-day is faster and more closely follows the price plot. The 26-day is slower and lags behind the 9-day. Incidentally, notice that 9 and 26 are the same periods used to calculate MACD.

Analyzing the Cloud
The Cloud (Kumo) is the most prominent feature of the Ichimoku Cloud plots. The Leading Span A (green) and Leading Span B (red) form the Cloud. The Leading Span A is the average of the Conversion Line and the Base Line. Because the Conversion Line and Base Line are calculated with 9 and 26 periods, respectively, the green Cloud boundary moves faster than the red Cloud boundary, which is the average of the 52-day high and the 52-day low. It is the same principle with moving averages. Shorter moving averages are more sensitive and faster than longer moving averages.
There are two ways to identify the overall trend using the Cloud. First, the trend is up when prices are above the Cloud, down when prices are below the Cloud and flat when prices are in the Cloud. Second, the uptrend is strengthened when the Leading Span A (green cloud line) is rising and above the Leading Span B (red cloud line). This situation produces a green Cloud. Conversely, a downtrend is reinforced when the Leading Span A (green cloud line) is falling and below the Leading Span B (red cloud line). This situation produces a red Cloud. Because the Cloud is shifted forward 26 days, it also provides a glimpse of future support or resistance.
Chart 2 shows IBM with a focus on the uptrend and the Cloud. First, notice that IBM was in an uptrend from June to January as it traded above the Cloud. Second, notice how the Cloud offered support in July, early October and early November. Third, notice how the Cloud provides a glimpse of future resistance. Remember, the entire Cloud is shifted forward 26 days. This means it is plotted 26 days ahead of the last price point to indicate future support or resistance.

Chart 3 shows Boeing (BA) with a focus on the downtrend and the cloud. The trend changed when Boeing broke below Cloud support in June. The Cloud changed from green to red when the Leading Span A (green) moved below the Leading Span B (red) in July. The cloud break represented the first trend change signal, while the color change represented the second trend change signal. Notice how the Cloud then acted as resistance in August and January.

Trend and Signals
Price, the Conversion Line and the Base Line are used to identify faster, and more frequent, signals. It is important to remember that bullish signals are reinforced when prices are above the cloud and the cloud is green. Bearish signals are reinforced when prices are below the cloud and the cloud is red. In other words, bullish signals are preferred when the bigger trend is up (prices above green cloud), while bearish signals are preferred when the bigger trend is down (prices are below red cloud). This is the essence of trading in the direction of the bigger trend. Signals that are counter to the existing trend are deemed weaker. Short-term bullish signals within a long-term downtrend and short-term bearish signals within a long-term uptrend are less robust.
Conversion-Base Line Signals
Chart 4 shows Kimberly Clark (KMB) producing two bullish signals within an uptrend. First, the trend was up because the stock was trading above the Cloud and the Cloud was green. The Conversion Line dipped below the Base Line for a few days in late June to enable the setup. A bullish crossover signal was triggered when the Conversion Line moved back above the Base Line in July. The second signal occurred as the stock moved towards Cloud support. The Conversion Line moved below the Base Line in September to enable the setup. Another bullish crossover signal was triggered when the Conversion Line moved back above the Base Line in October. Sometimes it is hard to determine exact Conversion Line and Base Line levels on the price chart. For reference, these numbers are displayed in the upper left hand corner of each chart. As of the January 8 close, the Conversion Line was 62.62 (blue) and the Base Line was 63.71 (red).

Chart 5 shows AT
Form N-2 ~ SEC Filings Explained
Initial filing of a registration statement on Form N-2 for closed-end investment companies
List of Direxion ETF’s
Symbol Fund Index/Benchmark Daily Target Bloomberg Index Symbol
Long Term Investment
ETFs
KNOW
Direxion All Cap Insider Sentiment Shares
Sabrient Multi-Cap Insider/Analyst Quant-Weighted Index - SBRQAM
INSD
Direxion Large Cap Insider Sentiment Shares
Sabrient Large-Cap Insider/Analyst Quant-Weighted Index - SBRQAL
VSPY
Direxion S
Watch for SPOM tuesday https://investorshub.advfn.com/boards/read_msg.aspx?message_id=138646623
SSOF
Undervalued
Great SS AS is only 700 million
New CEO per FEB 1 PR ( Dave Ho)
Active NVSOS status as of Thursday
64 percent increase in net revenues
Expanding into Mobile technologies
Expanding into Marketing/advertising
Already in oil services
Hopefully a little hint hint, overhead is cheap here at $MSMY, and potential is huge!.....
Hopefully a little hint hint, overhead is cheap here at $MSMY, and potential is huge!.....
Hopefully a little hint hint, overhead is cheap here at $MSMY, and potential is huge!.....
$MSMY IN NOW CURRENT... $NRPI EXACT SAME SITUATION... GET IN WHERE YOU FIT IN....#MGON $NRPI $MSMY
* * Bitcoin Video Chart 02-16-18 * *
Link to Video - click here to watch the technical chart video
* * Litecoin Video Chart 02-16-18 * *
Link to Video - click here to watch the technical chart video
*******$msmy john should deliver a nice pr any day now
* * Ethereum Video Chart 02-16-18 * *
Link to Video - click here to watch the technical chart video
* * $APRI Video Chart 02-16-18 * *
Link to Video - click here to watch the technical chart video
* * $MBRX Video Chart 02-16-18 * *
Link to Video - click here to watch the technical chart video
* * $FTFT Video Chart 02-16-18 * *
Link to Video - click here to watch the technical chart video
* * $TOPS Video Chart 02-16-18 * *
Link to Video - click here to watch the technical chart video
* * $BPMX Video Chart 02-16-18 * *
Link to Video - click here to watch the technical chart video
* * $SMRT Video Chart 02-16-18 * *
Link to Video - click here to watch the technical chart video
* * $NVAX Video Chart 02-16-18 * *
Link to Video - click here to watch the technical chart video
* * $VII Video Chart 02-16-18 * *
Link to Video - click here to watch the technical chart video
* * $AKS Video Chart 02-16-18 * *
Link to Video - click here to watch the technical chart video
* * $CATB Video Chart 02-16-18 * *
Link to Video - click here to watch the technical chart video
* * $HMNY Video Chart 02-16-18 * *
Link to Video - click here to watch the technical chart video
* * $CLF Video Chart 02-16-18 * *
Link to Video - click here to watch the technical chart video
* * $GEN Video Chart 02-16-18 * *
Link to Video - click here to watch the technical chart video
* * $AMPE Video Chart 02-16-18 * *
Link to Video - click here to watch the technical chart video
$BTGI: Tuesday is the due date for Q1 release. It is going to be north of 7 millions in revenue in one quarter for a company of less than 1.2 million in market cap. WAY UNDERVALUED
$PMCB PharmaCyte Announces Completion of Preparatory Work and Commencement of Testing by Eurofins of Cells from Its Master Cell Bank PMCB
PharmaCyte’s Chief Executive Officer, Kenneth L. Waggoner, stated, “We are pleased to see the completion of the preparatory work so soon after the completion of the MCB. We are excited that testing of cells from the MCB is underway. Given the work done to date, our selection of Eurofins to perform our “cell work” has proven beneficial to the work PharmaCyte has ahead of it. We are eagerly awaiting the day we’re able to ship vials of our MCB to Austrianova for encapsulation.”
https://finance.yahoo.com/news/pharmacyte-announces-completion-preparatory-commencement-140000274.html
$DFFN Diffusion Pharmaceuticals Announces First Patient Dosed in Phase 3 Trial with TSC in Inoperable Glioblastoma Multiforme DFFN
https://www.marketwatch.com/story/diffusion-pharmaceuticals-announces-first-patient-dosed-in-phase-3-trial-with-tsc-in-inoperable-glioblastoma-multiforme-2018-01-29
CHARLOTTESVILLE, Va., Jan 29, 2018 (GLOBE NEWSWIRE via COMTEX) --
Diffusion Pharmaceuticals Inc. DFFN, +6.53% ("Diffusion" or "the Company"), a clinical-stage biotechnology company focused on extending the life expectancy of cancer patients, today announced that the first patient has been dosed in the Company's Phase 3 clinical trial with trans sodium crocetinate ("TSC") in patients with newly-diagnosed inoperable glioblastoma multiforme ("GBM"), a type of brain cancer. The INTACT (INvestigating Tsc Against Cancerous Tumors) trial will compare standard of care ("SOC") radiation therapy ("RT") and chemotherapy plus TSC against SOC alone.
"We are pleased to be dosing patients so soon following the opening of the INTACT trial just a few weeks ago," said David Kalergis, Chief Executive Officer of Diffusion Pharmaceuticals. "We believe that this Phase 3 study will offer new hope for inoperable GBM patients who are administered TSC along with their standard therapies."
The INTACT Phase 3 study follows a previous Phase 2 GBM study in which the inoperable patient subgroup showed a nearly four-fold increase in survival compared with historical controls when TSC was added to their treatment regimen (40.0% alive at two years vs. 10.4%). TSC's unique mechanism of action affects the tumor micro-environment, making treatment-resistant cancer cells more susceptible to the tumor-killing power of conventional RT and chemotherapy (temozolomide) by re-oxygenating the hypoxic portion of the tumor. The Company believes that a largely intact GBM tumor vasculature with limited surgical resection is conducive to TSC's tumor re-oxygenation properties, and that this contributed to the survival increase in the Phase 2 GBM inoperable patient subgroup.
The trial will screen 300 patients and enroll 264 with the expectation that results from 236 patients will be available for analysis. Enrolled patients will be randomized in a 1:1 ratio into treatment and control groups. Patients in the treatment group will receive SOC temozolomide and RT plus an intravenous bolus of TSC administered shortly before their SOC treatments. Patients in the control group will receive SOC alone. The study will compare overall survival at two years between patients in the two groups. Up to 100 clinical sites in the U.S. and Europe are expected to participate.
About the GBM Phase 3 INTACT Trial
The INTACT clinical trial is an open-label, randomized, controlled, Phase 3 safety and efficacy registration trial. Subjects will be randomized at baseline to SOC for first-line treatment of GBM plus TSC, or to SOC alone. The SOC for GBM is temozolomide plus RT for 6 weeks followed by 28 days of rest, followed by 6 cycles of post-radiation temozolomide treatment.
For patients randomized to the TSC group, TSC will be administered during both the RT and post-radiation temozolomide treatment periods.
During the RT treatment period subjects will receive:
Focal RT delivered as 60Gy/30 fractions scheduled at 2Gy/day for 5 days each week (Monday through Friday) for 6 weeks.
Temozolomide 75 mg/m [2 ] orally once daily (usually administered the night preceding each RT session) starting the evening before the first RT session over a period of 42 calendar days with a maximum of 49 days.
TSC 0.25 mg/kg IV for 3 days each week (e.g., Monday, Wednesday, Friday, or other schedule that supplies a minimum 3 TSC doses per week) administered between 45 to 60 minutes prior to each RT session.
During the 28-day rest period all subjects will receive no treatment.
During the post-radiation 6-cycle temozolomide treatment period:
All subjects will receive 28-day oral temozolomide (150 mg/m [2] first cycle and 200 mg/m [2] all subsequent cycles as tolerated) administered on Day 1-5 (Monday through Friday) of each 28-day cycle.
Controls will receive oral temozolomide at night at home per the SOC and are not required to attend clinic visits during this period.
Subjects randomized to TSC will receive TSC 1.5 mg/kg (or another dose if recommended by the Data Safety Monitoring Board ("DSMB") 1.5 to 2 hours before their temozolomide dose during the daytime for 3 days during the first week of each 28-day cycle (Days 1, 3, and 5; e.g., Monday, Wednesday, Friday or other schedule that supplies at minimum 3 TSC doses per week). The Tuesday, Thursday doses will be given at night at home. Long-acting antiemetics may be administered prior to daytime temozolomide dosing on Days 1, 3, 5.
The safety, tolerability and pharmacokinetics ("PK") of TSC at higher doses than 0.25 mg/kg with temozolomide will be assessed during adjuvant therapy. TSC at doses between 0.25 mg/kg and up to 1.5 mg/kg in combination with concomitant temozolomide will be assigned (not randomized) in the first 8 subjects enrolled in the INTACT trial. These patients will undergo RT plus temozolomide plus TSC treatment (0.25 mg/kg) for 6 weekly cycles followed by 4 weeks of rest in standard fashion. At the Week 10 clinic visit the same 8 subjects will be assigned to treatment, with 2 subjects each assigned to TSC at doses of 0.25, 0.50, 1.0, and 1.5 mg/kg. These subjects will be studied in parallel for 2 28-day cycles with inclusion of appropriate blood sampling collection for TSC and temozolomide PK. The DSMB will examine the resultant safety data after 2 cycles (Weeks 11 through 18 of post-radiation temozolomide treatment period; Days 1 to 56). The DSMB may recommend continued use of the 1.5 mg/kg TSC dose for the post-radiation temozolomide treatment period, or may prescribe another dose based on their observations. Subjects then entering into the INTACT trial will be randomized at baseline between TSC plus SOC, or SOC alone.
Further details about the trial protocol are available at www.clinicaltrials.gov.
The baseline assessment for determining progression-free survival overall response rate and to rule out pseudo-progression will be at 10 weeks via MRI using the modified Response Assessment in Neuro-Oncology scale. The hazard ratio for the trial will be 0.67, which corresponds to 22% two-year survival in the TSC arm, the lower limit of the 95% confidence interval for the biopsy-only subjects in Diffusion's Phase 2 trial, and 10% survival in the SOC arm. The estimated median survival is therefore 10 months for the SOC arm vs. 14.9 months for the TSC plus SOC arm. In order to achieve 80% power, the trial requires 118 subjects in each arm.
The study will achieve the designed 80% statistical power at 198 events, where an event is defined as death. The first analysis will occur at the earlier of two years follow-up for all subjects or 198 events. If the first analysis is at 198 events, the analysis will be a standard 2-sided stratified log-rank test at the ?'?=0.05 significance level. If the first analysis is at two years, the Company will perform the analysis using the O'Brien-Fleming Method.
About Treatment-Resistant Cancers and TSC
Oxygen deprivation at the cellular level (hypoxia) is the result of rapid tumor growth, causing the tumor to outgrow its blood supply. Cancerous tumor cells thrive with hypoxia and the resultant changes in the tumor microenvironment cause the tumor to become resistant to RT and chemotherapy. Using a novel, proprietary mechanism of action, Diffusion's lead drug TSC appears to counteract tumor hypoxia - and therefore treatment resistance - by safely re-oxygenating tumor tissue, thus enhancing tumor kill and potentially prolonging patient life expectancy. Oxygen levels of normal tissue appear to remain unaffected upon administration of TSC.
About Diffusion Pharmaceuticals Inc.
Diffusion Pharmaceuticals Inc. is a clinical-stage biotechnology company focused on improving patient outcomes in unmet medical needs using its novel small molecule trans sodium crocetinate (TSC). Diffusion is developing TSC for use in conditions where hypoxia (oxygen deprivation) is known to diminish the effectiveness of SOC treatments. In oncology, TSC targets the cancer's hypoxic micro-environment, re-oxygenating treatment-resistant tissue and making the cancer cells more vulnerable to the therapeutic effects of SOC treatments without the apparent occurrence of any serious side effects. In non-oncology indications, therapeutic benefit would be achieved directly through re-oxygenation of the tissue threatened with cell death from hypoxia.
A Phase 3 randomized, controlled registration trial with TSC and SOC chemotherapy and radiation, compared with SOC alone in 236 patients newly diagnosed with inoperable glioblastoma multiforme (GBM), a type of brain cancer, is underway. A Phase 2 clinical program was completed in the second quarter of 2015 and evaluated 59 patients with newly diagnosed GBM. This open-label, historically controlled study demonstrated a favorable safety and efficacy profile for TSC combined with SOC, including a 37% improvement in overall survival compared with the control group at two years. A particularly strong efficacy signal was seen in the subset of inoperable patients where survival of TSC-treated patients at two years was nearly four-fold higher compared with the controls. Due to its novel mechanism of action, TSC has safely re-oxygenated a range of tumor types in preclinical and clinical studies. Diffusion believes the therapeutic potential of TSC is not limited to specific tumors, thereby making it potentially useful to improve SOC treatments of other life-threatening cancers. Additional studies under consideration include Phase 2 trials in pancreatic cancer and brain metastases, with study initiation subject to receipt of additional funding or collaborative partnering. The Company also believes that TSC has potential application in other indications involving hypoxiaincluding stroke, where the Company recently announced its PHAST-TSC study which will be conducted in co-operation with the University of California Los Angeles (UCLA) and the University of Virginia (UVA) to test TSC in stroke patients in an in-ambulance clinical trial setting.
Forward-Looking Statements
To the extent any statements made in this news release deal with information that is not historical, these are forward-looking statements under the Private Securities Litigation Reform Act of 1995. Such statements include, but are not limited to, statements about the company's plans, objectives, expectations and intentions with respect to future operations and products, the potential of the company's technology and product candidates, the anticipated timing of future clinical trials and protocol review, and other statements that are not historical in nature, particularly those that utilize terminology such as "would," "will," "plans," "possibility," "potential," "future," "expects," "anticipates," "believes," "intends," "continue," "expects," other words of similar meaning, derivations of such words and the use of future dates. Forward-looking statements by their nature address matters that are, to different degrees, uncertain. Uncertainties and risks may cause the company's actual results to be materially different than those expressed in or implied by such forward-looking statements. Particular uncertainties and risks include: general business and economic conditions; the company's need for and ability to obtain additional financing; and the difficulty of developing pharmaceutical products, obtaining regulatory and other approvals and achieving market acceptance, and the various risk factors (many of which are beyond Diffusion's control) as described under the heading "Risk Factors" in Diffusion's filings with the United States Securities and Exchange Commission. All forward-looking statements in this news release speak only as of the date of this news release and are based on management's current beliefs and expectations. Diffusion undertakes no obligation to update or revise any forward-looking statement, whether as a result of new information, future events or otherwise.
Contacts:
David Kalergis, CEO
Diffusion Pharmaceuticals Inc.
(434) 220-0718
dkalergis@diffusionpharma.com
or
LHA Investor Relations
Kim Sutton Golodetz
(212) 838-3777
kgolodetz@lhai.com
Copyright (C) 2018 GlobeNewswire, Inc. All rights reserved.
$CTRV Benzinga Pro's 5 Stocks To Watch CTRV
ContraVir Pharmaceuticals Inc (NASDAQ: CTRV) gained around 35 percent. The nano-cap pharmaceutical company that focuses on curing hepatitis B said it has reached an agreement with the U.S. Food and Drug Administration to streamline the development and registration of its hepatitis B therapy called TXL.
https://finance.yahoo.com/news/benzinga-pros-5-stocks-watch-132745582.html
INMG MJ TINY $90K DEBT 172M FLOAT, 291M OS, CEO OWNS 92M SHARES AND 100% OF HIS INTERESTS ARE ALIGNED WITH SHAREHOLDERS, CANNANET.TV LAUNCHED NOV. 28TH, OVER 50 CURRENT ADVERTISERS IN MJ SECTOR, BUSINESS SECTOR, ETC , KUSH PROCESSING/LocalCannabisDIrectory.com for direct dealings with legal dispensaries credit, banking, financing, etc., NIGHT FLIGHT minority owner with over 100K followers an huge viewership engagement on Facebook, debuting exclusive content in The Green Room Comedy Show, NIGHT FLIGHT HIGH, and others programming very soon and will be exploring CONTENT Sharing with several MAJOR cannabis media outlets....CRYPTO currency payment system for advertising platform, Dispensaries/Kush Processing, etc.... INMG is going to get very EXPLOSIVE...these prices that have been channeling for MONTHS are going to rocket soon with all the accumulation at .01 LEVEL...INMG hit about .05 amongst dilution from Preferred B shares....THAT CAN NO LONGER HAPPEN as TOM the biggest common share holder extinguished them cause that is all he owns is COMMON SHARES...he protected his interest and investment.....IF INMG CAN HIT .05 WITH DILUTION IMAGINE HOW GOOD IT CAN DO WITH NO DILUTION ON UPCOMING RUN...ITS GOING TO HAPPEN WITH ALL THE CATALYSTS AND GOOD THINGS GOING ON.....THERE ARE NUMBEROUS MJ SECTOR STOCKS THAT WE ALL KNOW AND I HAVE LISTED MANY TIMES ON HERE WITH MUCH BIGGER FLOATS AND HUGE DEBT THAT WENT FROM PENNIES TO DOLLARS.....TICK TOCK FOR INMG ITS TIME WILL BE COMING VERY SOON
BILLIONAIRES BOYS CLUB- INMG DD. https://investorshub.advfn.com/boards/read_msg.aspx?message_id=138409037
|
Followers
|
3284
|
Posters
|
|
|
Posts (Today)
|
0
|
Posts (Total)
|
2804248
|
|
Created
|
08/22/10
|
Type
|
Free
|
| Moderator Nilbud | |||
| Assistants mick ManicTrader PhotoChick Kirimi $Pistol Pete$ | |||
   Investor Hub Alerts: Sign up for 'STOCKGOODIES PLAYS OF THE WEEK ' E-Mail List Investor Hub Alerts: Sign up for 'STOCKGOODIES PLAYS OF THE WEEK ' E-Mail ListUPDATE; 5-1-22 courtesy of charting /\ wit tweezer top calls /\ Tony @Montana_Trades Really good study sheet on Candlestick Patterns [-chart]pbs.twimg.com/media/FRn8188XMAAdZvk?format=jpg&name=small[/chart] 

02-07-2021
|
|
Posts Today
|
0
|
|
Posts (Total)
|
2804248
|
|
Posters
|
|
|
Moderator
|
|
|
Assistants
|
| Volume | |
| Day Range: | |
| Bid Price | |
| Ask Price | |
| Last Trade Time: |


