 News
News  Market Data
  Discover
Support: 888-992-3836
Copyright © 2023 InvestorsHub Inc.


Register for free to join our community of investors and share your ideas. You will also get access to streaming quotes, interactive charts, trades, portfolio, live options flow and more tools.
Daily Candlestick Chart for SIMH
[img]stockcharts.com/c-sc/sc?s=SIMH
$SAPX BarChart Trader's Cheat Sheet
http://www.barchart.com/cheatsheet.php?sym=SAPX
Downtrend Line

A downtrend line has a negative slope and is formed by connecting two or more high points. The second high must be lower than the first for the line to have a negative slope. Downtrend lines act as resistance, and indicate that net-supply (supply less demand) is increasing even as the price declines. A declining price combined with increasing supply is very bearish, and shows the strong resolve of the sellers. As long as prices remain below the downtrend line, the downtrend is solid and intact. A break above the downtrend line indicates that net-supply is decreasing and that a change of trend could be imminent.
For a detailed explanation of trend changes, which are different than just trend line breaks, please see our article on the Dow Theory.

Daily Candlestick Chart for CLNP
[img]stockcharts.com/c-sc/sc?s=CLNP
$ANDI BarChart Trader's Cheat Sheet
http://www.barchart.com/cheatsheet.php?sym=ANDI
Daily Candlestick Chart for ILNS
[img]stockcharts.com/c-sc/sc?s=ILNS
Company Analysis
With a shortlist of companies, an investor might analyze the resources and capabilities within each company to identify those companies that are capable of creating and maintaining a competitive advantage. The analysis could focus on selecting companies with a sensible business plan, solid management and sound financials.
Introduction to Chart Patterns
There are hundreds of thousands of market participants buying and selling securities for a wide variety of reasons: hope of gain, fear of loss, tax consequences, short-covering, hedging, stop-loss triggers, price target triggers, fundamental analysis, technical analysis, broker recommendations and a few dozen more. Trying to figure out why participants are buying and selling can be a daunting process. Chart patterns put all buying and selling into perspective by consolidating the forces of supply and demand into a concise picture. As a complete pictorial record of all trading, chart patterns provide a framework to analyze the battle raging between bulls and bears. More importantly, chart patterns and technical analysis can help determine who is winning the battle, allowing traders and investors to position themselves accordingly.
In many ways, chart patterns are simply more complex versions of trend lines. It is important that you read and understand our articles on Support and Resistance as well as Trend Lines before you continue.
Chart pattern analysis can be used to make short-term or long-term forecasts. The data can be intraday, daily, weekly or monthly and the patterns can be as short as one day or as long as many years. Gaps and outside reversals may form in one trading session, while broadening tops and dormant bottoms may require many months to form.


Daily Candlestick Chart for GSML
[img]stockcharts.com/c-sc/sc?s=GSML
$LNXGF BarChart Trader's Cheat Sheet
http://www.barchart.com/cheatsheet.php?sym=LNXGF
Inflationary Relationships
The intermarket relationships depend on the forces of inflation or deflation. In a "normal" inflationary environment, stocks and bonds are positively correlated. This means they both move in the same direction. The world was in an inflationary environment from the 1970's to the late 1990's. These are the key intermarket relationships in a inflationary environment:
A POSITIVE relationship between bonds and stocks
An INVERSE relationship between interest rates and stocks
Bonds usually change direction ahead of stocks
An INVERSE relationship between commodities and bonds
A POSITIVE relationship between commodities and interest rates
A POSITIVE relationship between stocks and commodities
Commodities usually change direction after stocks
An INVERSE relationship between the US Dollar and commodities
POSITIVE: When one goes up, the other goes up also. INVERSE: When one goes up, the other goes down. Interest rates move up when bonds move down

In an inflationary environment, stocks react positively to falling interest rates (rising bond prices). Low interest rates stimulate economic activity and boost corporate profits. As interest rates fall and the economy strengthens, demand for commodities increases and commodity prices rise. Keep in mind that an "inflationary environment" does not mean runaway inflation. It simply means that the inflationary forces are stronger than the deflationary forces.
Daily Candlestick Chart for GEFI
[img]stockcharts.com/c-sc/sc?s=GEFI
$ONCS BarChart Trader's Cheat Sheet
http://www.barchart.com/cheatsheet.php?sym=ONCS
Daily Candlestick Chart for DNAG
[img]stockcharts.com/c-sc/sc?s=DNAG
$MPIX BarChart Trader's Cheat Sheet
http://www.barchart.com/cheatsheet.php?sym=MPIX
Dow Theory
There is also proof that one of the oldest systems around can outperform the market and reduce risk. Dow Theory seeks to buy when both the Dow Transports and the Dow Industrials record new reaction highs and sell or move into Treasuries when both record new reaction lows. The move out of stocks and into Treasuries greatly reduces risk because one is not exposed to riskier stocks. There have been a few big bad bear markets over the years and preserving capital is one of the keys to investment success.

Stephen Brown of New York University, William Goetzmann of Yale, and Alok Kumar of the University of Notre Dame published a study on Dow Theory in the Journal of Finance. The Dow theory system was tested against buy-and-hold for the period from 1929 to 1998. Over the 70-year period, the Dow theory system outperformed a buy-and-hold strategy by about 2% per year. In addition, the portfolio carried significantly less risk. If compared as risk-adjusted returns, the margin of outperformance would be even greater. Over the 18 years from 1980 to 1998, the Dow theory system has underperformed the market by about 2.6% per year. However, when adjusted for risk, the Dow theory system significantly outperformed buy-and-hold over this timeframe. Keep in mind that 18 years is not a long time in the history of the market and this period was during one of the greatest bull markets in history (1982 to 2000).
Daily Candlestick Chart for RNGG
[img]stockcharts.com/c-sc/sc?s=RNGG
$DEAR BarChart Trader's Cheat Sheet
http://www.barchart.com/cheatsheet.php?sym=DEAR
Chart Analysis
Technical analysis can be as complex or as simple as you want it. The example below represents a simplified version. Since we are interested in buying stocks, the focus will be on spotting bullish situations.

$LUSI BarChart Trader's Cheat Sheet
http://www.barchart.com/cheatsheet.php?sym=LUSI
Fundamental analysis
Fundamental analysis can be valuable, but it should be approached with caution. If you are reading research written by a sell-side analyst, it is important to be familiar with the analyst behind the report. We all have personal biases, and every analyst has some sort of bias. There is nothing wrong with this, and the research can still be of great value. Learn what the ratings mean and the track record of an analyst before jumping off the deep end. Corporate statements and press releases offer good information, but they should be read with a healthy degree of skepticism to separate the facts from the spin. Press releases don't happen by accident; they are an important PR tool for companies. Investors should become skilled readers to weed out the important information and ignore the hype.
Daily Candlestick Chart for BMPI
[img]stockcharts.com/c-sc/sc?s=BMPI
Daily Candlestick Chart for SANP
[img]stockcharts.com/c-sc/sc?s=SANP
$IDPIQ BarChart Trader's Cheat Sheet
http://www.barchart.com/cheatsheet.php?sym=IDPIQ
Daily Candlestick Chart for KKPT
[img]stockcharts.com/c-sc/sc?s=KKPT
$REAL BarChart Trader's Cheat Sheet
http://www.barchart.com/cheatsheet.php?sym=REAL
Daily Candlestick Chart for WELL
[img]stockcharts.com/c-sc/sc?s=WELL
$VUNCF BarChart Trader's Cheat Sheet
http://www.barchart.com/cheatsheet.php?sym=VUNCF
Daily Candlestick Chart for IGXT
[img]stockcharts.com/c-sc/sc?s=IGXT
$DATA BarChart Trader's Cheat Sheet
http://www.barchart.com/cheatsheet.php?sym=DATA
$AWNE BarChart Trader's Cheat Sheet
http://www.barchart.com/cheatsheet.php?sym=AWNE
$BAYN BarChart Trader's Cheat Sheet
http://www.barchart.com/cheatsheet.php?sym=BAYN
$EKNL BarChart Trader's Cheat Sheet
http://www.barchart.com/cheatsheet.php?sym=EKNL
Index ETFs
Most ETFs are index funds that attempt to replicate the performance of a specific index. Indexes may be based on stocks, bonds, commodities, or currencies. An index fund seeks to track the performance of an index by holding in its portfolio either the contents of the index or a representative sample of the securities in the index.[5] As of June 2012, in the United States, about 1200 index ETFs exist, with about 50 actively managed ETFs. Index ETF assets are about $1200 billion, compared with about $7 billion for actively managed ETFs.[18] Some index ETFs, known as leveraged ETFs or inverse ETFs, use investments in derivatives to seek a return that corresponds to a multiple of, or the inverse (opposite) of, the daily performance of the index.[19]
Some index ETFs invest 100% of their assets proportionately in the securities underlying an index, a manner of investing called "replication". Other index ETFs use "representative sampling", investing 80% to 95% of their assets in the securities of an underlying index and investing the remaining 5% to 20% of their assets in other holdings, such as futures, option and swap contracts, and securities not in the underlying index, that the fund's adviser believes will help the ETF to achieve its investment objective. For index ETFs that invest in indices with thousands of underlying securities, some index ETFs employ "aggressive sampling" and invest in only a tiny percentage of the underlying securities
SEC Filings Explained ~ Rule 144
On December 6, 2007, the SEC published final rules revising Rule 144 under the Securities Act of 1933, which regulates the resale of restricted securities and securities held by affiliates. The amendments to Rule 144, among other things:
1. Shorten the holding period for affiliate and non-affiliate holders of restricted securities of SEC-reporting companies to six months, subject to certain conditions
2. Permit unlimited resale by non-affiliate holders of restricted securities by complying only with the current public information condition for resale of restricted securities issued by SEC reporting companies made after the six-month holding period; and without complying with any Rule 144 conditions for resale of restricted securities issued by both SEC reporting and non-reporting companies made after a one-year holding period.
3. permit resale of equity securities by affiliates that meet certain conditions through riskless principal transactions and brokers’ transactions in which the broker has published bid and asked quotations for the security in an alternative trading system.
4. Eliminate the manner of sale conditions and ease the volume limitations for resale of debt securities by affiliates.
5. Increase the thresholds that trigger the Form 144 filing requirement to 5,000 shares or $50,000.
The SEC did not adopt previously proposed provisions relating to the tolling of holding periods in connection with hedging transactions.
The amendments will become effective on February 15, 2008, and will apply to securities acquired before or after that date. Background
Rule 144 regulates the resale of “restricted securities”1 and “control securities,”2 by establishing certain conditions that must be satisfied in order for the resale to be exempt from the Securities Act registration requirements pursuant to Section 4(1) of the Securities Act—a safe harbor from “underwriter” status for the selling security holder.
The conditions include the following:
? There must be adequate current public information available about the issuer;
? If the securities being sold are restricted securities, the security holder must have held the security for a specified holding period;
? The resale must be within specified sales volume limitations;
? The resale must comply with the manner of sale requirements of the rule; and
? The selling security holder must file Form 144 with the SEC if the amount of securities being sold exceeds specified thresholds.
Amendments to Conditions for Resale of Restricted Securities
Restricted Securities of SEC-Reporting Companies. The SEC has reduced the holding period under Rule 144 for restricted securities of SEC-reporting companies held by both affiliates and non-affiliates from one year to six months. Affiliate holders of reporting company securities may now resell their restricted securities after six months, subject to the other Rule 144 requirements. Non-affiliate holders of reporting company securities (who have also not been affiliates during the prior three months) may now resell their restricted securities held between six months and one year subject only to Rule 144’s current public information requirement. Any such resale by a non-affiliate after one year will be exempt from all Rule 144 requirements.
Restricted Securities of Non-Reporting Companies. There is still a one-year holding period for affiliate and non-affiliate holders of restricted securities in non-reporting companies under amended Rule 144. After the one-year holding period, non-affiliates may now resell their restricted securities without having to comply with any other Rule 144 requirements; affiliates seeking to resell their restricted securities must still meet all Rule 144 requirements.
The manner of sale requirements of Rule 144 require securities to be sold in “brokers’ transactions” or in transactions directly with a “market maker.”
The rule includes restrictions on (1) soliciting or arranging for the solicitation of orders to buy the securities in anticipation of, or in connection with, the Rule 144 transaction or (2) making any payment in connection with the offer or sale of the securities to any person other than the broker who executes the order to sell the securities.
The SEC amended these rules to also permit the resale of restricted equity securities by affiliates through riskless principal transactions in which trades are executed at the same price, exclusive of any explicitly disclosed markup or markdown, commission equivalent or other fee, and the rules for a self-regulatory organization permit the transaction to be reported as riskless.3 The amended rule also expands the definition of a “brokers’ transaction” for purposes of such resale by permitting a broker to insert bid and ask quotations for the security in an alternative trading system, provided that the broker has published bona fide bid and ask quotations for such security on each of the last 12 business days. Resale of Restricted Debt Securities The SEC has eliminated the manner-of-sale requirements for affiliate resale of debt securities, including non-participatory preferred stock (which has debt-like characteristics) and asset-backed securities. The SEC also raised the volume limitations for the resale of debt securities to permit resale in an amount that does not exceed ten percent of a tranche (or a class with respect to non-participatory preferred stock), together with all sales of securities of the same tranche sold for the selling debt security holder within a three-month period. Form 144 Filing Triggers
The sales thresholds for filing Form 144 have been increased from 500 shares or $10,000 worth of securities to 5,000 shares or $50,000. Codified
SEC Staff Interpretations
The SEC has also codified various staff interpretations relating to Rule 144, including the following:
1. Stating that securities acquired by accredited investors pursuant to Section 4(6) of the Securities Act are considered restricted securities
2. Permitting tacking of holding periods when a company reorganizes into a holding company structure
3. Permitting tacking of holding periods for conversions and exchanges of securities
4. Deeming the acquisition dates for securities acquired pursuant to the cashless exercise of options and warrants as the dates the options or warrants were acquired
5. Permitting a pledgee of restricted securities to sell the pledged securities without having to aggregate the sale with sales by other pledgees from the same pledgor (as long as there is no concerted action by those pledgees), for purposes of the Rule 144 volume limitation condition
6. Permitting the Form 144 representations required from security holders relying on Exchange Act Rule 10b5-1 to be made as of the date the holder adopted a trading plan or gave trading instructions
7. Confirming the unavailability of Rule 144 for the resale of securities by reporting and non-reporting firms
Tweezer Bottoms

The Tweezer Bottom formation is a bullish reversal pattern seen at the bottom of downtrends.
Tweezer Bottom formation consists of two candlesticks:
Bearish Candle (Day 1)
Bullish Candle (Day 2)
Sometimes Tweezer Bottoms have three candlesticks.
A bullish Tweezer Bottom occurs during a downtrend when bears continue to take prices lower, usually closing the day near the lows (a bearish sign). Nevertheless, Day 2 is completely opposite because prices open and go nowhere but upwards. This bullish advance on Day 2 sometimes eliminates all losses from the previous day.

The bears pushed the price of Exxon-Mobil (XOM) downwards on Day 1; however, the market on Day 2 opened where prices closed on Day 1 and went straight up, reversing the losses of Day 2. A buy signal would generally be given on the day after the Tweezer Bottom, assuming the candlestick was bullish green.
The Tweezer Top and Bottom reversal pattern is extremely helpful because it visually indicates a transfer of power and sentiment from the bulls and the bears. Of course other technical indicators should be consulted before making a buy or sell signal based on the Tweezer patterns.
Form 20-F ~ SEC Filings Explained
Form 20-F is an SEC filing submitted to the US Securities and Exchange Commission used by certain foreign private issuers to provide information.
20-F, 20-F/A Annual and transition report of foreign private issuers pursuant to sections 13 or 15(d)
20FR12B, 20FR12B/A Form for initial registration of a class of securities of foreign private issuers pursuant to section 12(b)
20FR12G, 20FR12G/A Form for initial registration of a class of securities of foreign private issuers pursuant to section 12(g)
The postfix /A stands for 'Amendment'
The report must be filed within six months after the end of the fiscal year.
FOUR PRICE DOJI
The Four Price Doji is a single candlestick pattern. It is simply a horizontal line that has no upper or lower shadows.

Recognition Criteria:
1. The body is a horizontal line.
2. There are no upper or lower shadows at all.
3. The open, close, high and low are the same throughout the entire day.
Explanation:
A Four Price Doji is a very rare occurrence and it may be seen only if all the four price components are equal. That is, the open, high, low, and close turn out to be the same. It represents complete and total uncertainty by traders concerning the market direction.
Important Factors:
The Four Price Doji usually occurs when a stock is very illiquid, has low volume, or the data source do not report any other price other than the closing price.
The Four Price Doji is not reliable like most other single candlestick patterns. It only reflects one day's trading and conveys a sense of complete indecision. It usually is interpreted as a reversal pattern however this indicator must be used with other candlesticks for a healthier judgment about the course of the trend.
Like all other doji types, Four Price Doji is also important only in markets where there are not many doji. In a chart characterized by many doji, the emergence of Four Price Doji do not have a signal value.
Form 1-E AD, 1-E AD/A ~ SEC Filings Explained
Sales material filed pursuant to Rule 607 under Regulation E. (and amendment thereto)
Form S-8 ~ SEC Filings Explained
Initial registration statement for securities to be offered to employees pursuant to employee benefit plans
Form 18-K, 18-K/A ~ SEC Filings Explained
Annual report for foreign governments (and amendment thereto)
BEARISH BELT HOLT
The Bearish Belt Hold Pattern is a single candlestick pattern and it is basically a Black Opening Marubozu that occurs in an uptrend. The pattern shows that the day opens on its high, it then rallies against the trend of the market, and then closes near its low but not necessarily at its low. Longer bodies for Belt Hold are indicative of more resistance to the trend they are countering.

Recognition Criteria:
1. There is an overall uptrend in the market.
2. The day gaps up and prices open on their high but then prices move down closing near its low for the day.
3. We then see a black body characterized by the absence of upper shadow, which is called a Black Opening Marubozu.
Explanation:
We have a market that is trending up when a significant gap in the direction of trend occurs as the day opens. However; then prices reverse direction and all further price action of the day is the opposite of the previous trend. Such a move causes concern among the bulls and leads them to sell many positions. This strengthens the reversal and turns into a sell-off.
Important Factors:
A confirmation of the trend reversal with either a black candlestick, a large gap down or a lower close on the next trading day is required.
SEC Filings Explained ~ Form 5
Form 5 is an SEC filing submitted to the Securities and Exchange Commission on an annual basis by company officers, directors, or beneficial (10%) owners, which summarizes their insider trading activities. This form is simply a combination of year's Form 4 filings, which are mandatory filings made shortly after insiders make transactions.
Marubozu Candlesticks
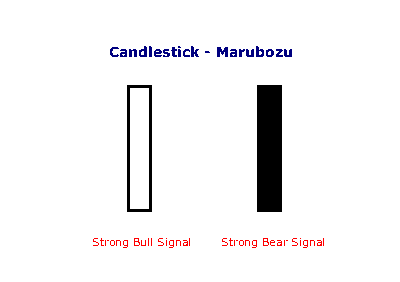
Marubozu are even stronger bull or bear signals than long lines as they show that buyers/sellers have remained in control from the open to the close -- there are no intra-day retracements.
ARS~ SEC Filings Explained
Annual Report to Security Holders.
Form 15-15D, 15-15D/A ~ SEC Filings Explained
Notice of suspension of duty to file reports pursuant to Section 13 and 15(d) of the Act (and amendment thereto)
Bond ETFs
Exchange-traded funds that invest in bonds are known as bond ETFs. They thrive during economic recessions because investors pull their money out of the stock market and into bonds (for example, government treasury bonds or those issues by companies regarded as financially stable). Because of this cause and effect relationship, the performance of bond ETFs may be indicative of broader economic conditions.[22] There are several advantages to bond ETFs such as the reasonable trading commissions, but this benefit can be negatively offset by fees if bought and sold through a third party
Form N-8A ~ SEC Filings Explained
Initial notification of registration under section 8(a) filed on Form N-8A
|
Followers
|
3284
|
Posters
|
|
|
Posts (Today)
|
0
|
Posts (Total)
|
2804248
|
|
Created
|
08/22/10
|
Type
|
Free
|
| Moderator Nilbud | |||
| Assistants mick ManicTrader PhotoChick Kirimi $Pistol Pete$ | |||
   Investor Hub Alerts: Sign up for 'STOCKGOODIES PLAYS OF THE WEEK ' E-Mail List Investor Hub Alerts: Sign up for 'STOCKGOODIES PLAYS OF THE WEEK ' E-Mail ListUPDATE; 5-1-22 courtesy of charting /\ wit tweezer top calls /\ Tony @Montana_Trades Really good study sheet on Candlestick Patterns [-chart]pbs.twimg.com/media/FRn8188XMAAdZvk?format=jpg&name=small[/chart] 

02-07-2021
|
|
Posts Today
|
0
|
|
Posts (Total)
|
2804248
|
|
Posters
|
|
|
Moderator
|
|
|
Assistants
|
| Volume | |
| Day Range: | |
| Bid Price | |
| Ask Price | |
| Last Trade Time: |


