 News
News  Market Data
  Discover
Support: 888-992-3836
Copyright © 2023 InvestorsHub Inc.


Register for free to join our community of investors and share your ideas. You will also get access to streaming quotes, interactive charts, trades, portfolio, live options flow and more tools.
$VIZS BarChart Trader's Cheat Sheet
http://www.barchart.com/cheatsheet.php?sym=VIZS
$ELRA BarChart Trader's Cheat Sheet
http://www.barchart.com/cheatsheet.php?sym=ELRA
$ABBY BarChart Trader's Cheat Sheet
http://www.barchart.com/cheatsheet.php?sym=ABBY
Form 10-Q~ SEC Filings Explained
Form 10-Q, (also known as a 10-Q or 10Q) is a quarterly report mandated by the United States federalSecurities and Exchange Commission, to be filed by publicly traded corporations.
Pursuant to Section 13 or 15(d) of the Securities Exchange Act of 1934, it's an SEC filing that must be filed quarterly with the US Securities and Exchange Commission. It contains similar information to the annual form 10-K, however the information is generally less detailed, and the financial statements are generally unaudited. Information for the final quarter of a firm's fiscal year is included in the 10-K, so only three 10-Q filings are made each year.
These reports generally compare last quarter to the current quarter and last years quarter to this years quarter. The SEC put this form in place to facilitate better informed investors. The form 10-Q must be filed within 40 days for large accelerated filers and accelerated filers or 45 days after the end of the fiscal quarter for all other registrants (formerly 45 days)

Candlestick Patterns
Long Lines
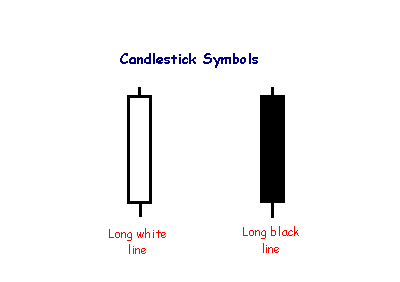
The long white line is a sign that buyers are firmly in control - a bullish candlestick.
A long black line shows that sellers are in control - definitely bearish.
Golden Cross
A Golden Cross is when a shorter term moving average crosses above a longer term moving average, for example a 20 day SMA crossing over a 50 day SMA. A golden cross indicates a bullish trend, especially when it is coupled with higher trading volume. As well as being a trend indicator, the longer term moving average becomes a support line as the price rises.
The chart below shows a 20/50 SMA Golden cross:
20 SMA is in Red
50 SMA is in Blue

Form N-14 8C ~ SEC Filings Explained
Initial registration statement filed on Form N14 by closed-end investment company (business combinations)
Form N-30D ~ SEC Filings Explained
Initial annual and semi-annual reports mailed to investment company shareholders
Form 18-K, 18-K/A ~ SEC Filings Explained
Annual report for foreign governments (and amendment thereto)
Form N-PX ~ SEC Filings Explained
Annual Report of Proxy Voting Record of Registered Management Investment Companies
Form 15-15D, 15-15D/A ~ SEC Filings Explained
Notice of suspension of duty to file reports pursuant to Section 13 and 15(d) of the Act (and amendment thereto)
DEF 14A~ SEC Filings Explained
A proxy statement is a statement required of a firm when soliciting shareholder votes. This statement is filed in advance of the annual meeting. The firm needs to file a proxy statement, otherwise known as a Form DEF 14A (Definitive Proxy Statement), with the U.S. Securities and Exchange Commission. This statement is useful in assessing how management is paid and potential conflict-of-interest issues with auditors. The statement includes:
? Voting procedure and information.
? Background information about the company's nominated directors including relevant history in the company or industry, positions on other corporate boards, and potential conflicts in interest.
? Board compensation.
? Executive compensation, including salary, bonus, non-equity compensation, stock awards, options, and deferred compensation. Also, information is included about perks such as personal use of company aircraft, travel, and tax gross-ups. Many companies will also include pre-determined payout packages for if an executive leaves the company.
? Who is on the audit committee, as well as a breakdown of audit and non-audit fees paid to the auditor.
SEC proxy rules: The term "proxy statement" means the statement required by Section 240.14a-3(a) whether or not contained in a single document.
In many cases, shareholder votes - particularly institutional shareholder votes - are determined by proxy firms which advise the shareholders...
Traditionally, broker-dealers have been permitted to vote for "routine" proposals on behalf of their shareholders if the shareholders do not return the proxy statement. This has been controversial, and in 2006 the NYSE Proxy Working Group recommended that the rules be modified so that uncontested director elections were not considered routine.[1] The SEC approved the rule on July 1, 2009.[2]
In July 2010, the SEC announced that it was seeking public comment on the efficiency of the proxy system.[3]
There has been some controversy over "proxy access" which is a method to allow shareholders to nominate candidates which appear on the proxy statement. Currently, only the nominating board can place candidates on the proxy statement. The United States Dodd–Frank Wall Street Reform and Consumer Protection Act specifically allowed the SEC to rule on this issue. In 2010, the SEC passed a rule which allowed certain shareholders to place candidates on the proxy statement,;[4] however, the rule was struck down by the United States Court of Appeals for the District of Columbia Circuit in 2011
Pivot Points
Introduction
Pivots Points are significant levels chartists can use to determine directional movement, support and resistance. Pivot Points use the prior period's high, low and close to formulate future support and resistance. In this regard, Pivot Points are predictive or leading indicators. There are at least five different versions of Pivot Points. This article will focus on Standard Pivot Points, Demark Pivot Points and Fibonacci Pivot Points.
Pivot Points were originally used by floor traders to set key levels. Floor traders are the original day traders. They deal in a very fast moving environment with a short-term focus. At the beginning of the trading day, floor traders would look at the previous day's high, low and close to calculate a Pivot Point for the current trading day. With this Pivot Point as the base, further calculations were used to set support 1, support 2, resistance 1 and resistance 2. These levels would then be used to assist their trading throughout the day.
ARS~ SEC Filings Explained
Annual Report to Security Holders.
Form N-CSR ~ SEC Filings Explained
Certified annual shareholder report of registered management investment companies
Falling Three Methods
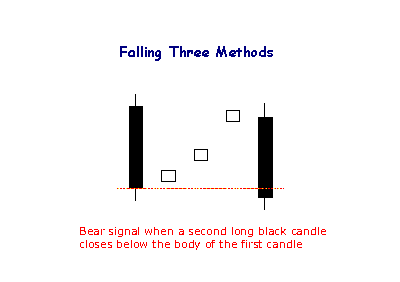
The bearish Falling Method consists of two long black lines bracketing 3 or 4 small ascending white candlesticks, the second black line forming a new closing low.
Form N-Q ~ SEC Filings Explained
Quarterly Schedule of Portfolio Holdings of Registered Management Investment Company
Piercing Line
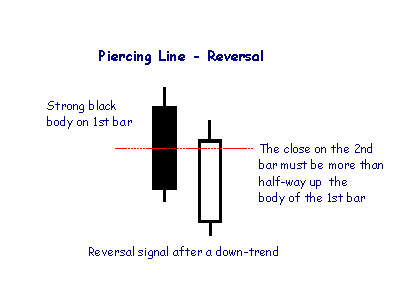
The Piercing Line is the opposite of the Dark Cloud pattern and is a reversal signal if it appears after a down-trend.
Form 15F-12G, 15F-12G/A ~ SEC Filings Explained
Notice of termination of a foreign private issuer's registration of a class of securities under Section 12(g) (and amendment thereto)
Form 13F-HR, 13F-HR/A ~ SEC Filings Explained
Initial Quarterly Form 13F Holdings report filed by institutional managers (and amendment thereto)
Hammer and Gravestone
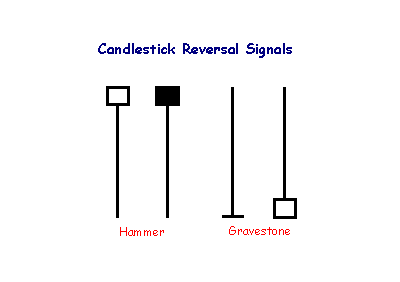
The hammer is not as strong as the dragonfly candlestick, but also signals reversal after a down-trend: control has shifted from sellers to buyers. The shadow of the candlestick should be at least twice the height of the body.
A gravestone is identified by open and close near the bottom of the trading range. The candlestick is the converse of a hammer and signals reversal when it occurs after an up-trend.
THREE OUTSIDE UP
The Bearish Upside Gap Two Crows Pattern is a three-candlestick pattern and it signals a top reversal. The first candlestick is a long white candlestick followed by a real body that gaps higher. Then another black real body appears, which opens above the second day’s open and closes under the second day’s close, completing the pattern
Recognition Criteria:
1. Market is characterized by downtrend.
2. We see a Bullish Engulfing Pattern in the first two days.
3. The third day is a white candlestick with a higher close than the second day.
Explanation:
The first two days of this three-day pattern is simply a Bullish Engulfing Pattern, and the third day confirms the reversal suggested by the Bullish Engulfing Pattern since it is a white candlestick closing with a new high for the last three days.
Shadow and Tail
The shadow is the portion of the trading range outside of the body. We often refer to a candlestick as having a tall shadow or a long tail.
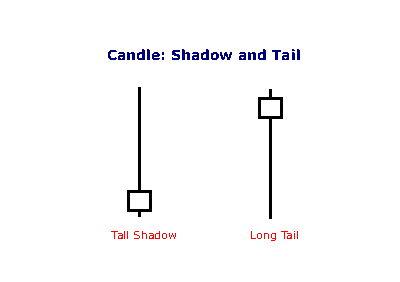
A tall shadow indicates resistance;
A long tail signals support.
Form 20-F, 20-F/A ~ SEC Filings Explained
Annual and transition report of foreign private issuerspursuant to sections 13 or 15(d) (and amendment thereto)
Actively managed ETFs
Actively managed ETFs (AMETFs) are quite recent in the United States. The first one was offered in March 2008, but it was liquidated in October 2008. The actively managed ETFs approved to date are fully transparent, publishing their current securities portfolios on their web sites daily. However, the SEC has indicated that it is willing to consider allowing actively managed ETFs that are not fully transparent in the future.[4]
The fully transparent nature of existing ETFs means that an actively managed ETF is at risk from arbitrage activities by market participants who might choose to front run its trades[citation needed]. The initial actively traded equity ETFs have addressed this problem by trading only weekly or monthly, however today, actively managed ETFs trade at the discretion of the manager and to date, there have been no instances of front running. Actively traded debt ETFs, which are less susceptible to front-running, trade their holdings more frequently.[30]
Actively managed ETFs have grown faster in their first three years of existence than index ETFs did in their first three years of existence. However, as track records develop, many see actively managed ETFs as a significant competitive threat to actively managed mutual funds
3. Counterparty risk (Risks Associated with ETF’s)
A synthetic ETF has counterparty risk, because the counterparty is contractually obligated to match the return on the index. The deal is arranged with collateral posted by the swap counterparty. A potential hazard is that the investment bank offering the ETF might post its own collateral, and that collateral could be of dubious quality. Furthermore, the investment bank could use its own trading desk as counterparty. These types of set-ups are not allowed under the European guidelines, Undertakings for Collective Investment in Transferable Securities (UCITS), so the investor should look for UCITS III-compliant funds.
Form N-4 ~ SEC Filings Explained
Initial registration statement on Form N-4 for separate accounts (unit investment trusts)
1. Effects on stability (Risks Associated with ETF’s)
ETFs that buy and hold commodities or futures of commodities have become popular. For example, SPDR Gold Shares ETF (GLD) has 41 million ounces in trust. [49] The silver ETF, SLV, is also very large. The commodity ETFs are in effect consumers of their target commodities, thereby affecting the price in a spurious fashion. [50] In the words of the IMF, “Some market participants believe the growing popularity of exchange-traded funds (ETFs) may have contributed to equity price appreciation in some emerging economies, and warn that leverage embedded in ETFs could pose financial stability risks if equity prices were to decline for a protracted period.”
Form TA-W ~ SEC Filings Explained
Notice of withdrawal from registration as transfer agent filed pursuant to the Securities Exchange Act of 1934
Marubozu Candlesticks
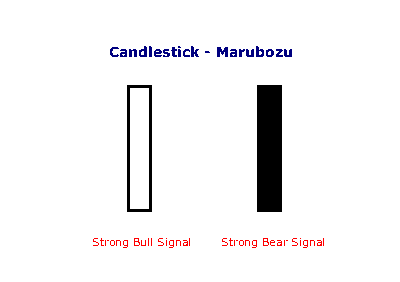
Marubozu are even stronger bull or bear signals than long lines as they show that buyers/sellers have remained in control from the open to the close -- there are no intra-day retracements.
Form N-CSRS ~ SEC Filings Explained
Certified semi-annual shareholder report of registered management investment companies
Criticism of ETF’s
John C. Bogle, founder of the Vanguard Group, a leading issuer of index mutual funds (and, since Bogle's retirement, of ETFs), has argued that ETFs represent short-term speculation, that their trading expenses decrease returns to investors, and that most ETFs provide insufficient diversification. He concedes that a broadly diversified ETF that is held over time can be a good investment.
ETFs are dependent on the efficacy of the arbitrage mechanism in order for their share price to track net asset value. While the average deviation between the daily closing price and the daily NAV of ETFs that track domestic indices is generally less than 2%, the deviations may be more significant for ETFs that track certain foreign indices. The Wall Street Journal reported in November 2008, during a period of market turbulence, that some lightly traded ETFs frequently had deviations of 5% or more, exceeding 10% in a handful of cases, although even for these niche ETFs, the average deviation was only a little more than 1%. The trades with the greatest deviations tended to be made immediately after the market opened.
According to a study on ETF returns in 2009 by Morgan Stanley, ETFs missed in 2009 their targets by an average of 1.25 percentage points, a gap more than twice as wide as the 0.52-percentage-point average they posted in 2008. Part of this so-called tracking error is attributed to the proliferation of ETFs targeting exotic investments or areas where trading is less frequent, such as emerging-market stocks, future-contracts based commodity indices and junk bonds.[citation needed]
The tax advantages of ETFs are of no relevance for investors using tax-deferred accounts (or indeed, investors who are tax-exempt in the first place). However, the lower expense ratios are proving difficult for the proponents of traditional mutual funds to overcome.
In a survey of investment professionals, the most frequently cited disadvantage of ETFs was the unknown, untested indices used by many ETFs, followed by the overwhelming number of choices.
Some critics claim that ETFs can be, and have been, used to manipulate market prices, including having been used for short selling that has been asserted by some observers (including Jim Cramer of theStreet.com) to have contributed to the market collapse of 2008
Form 6-K~ SEC Filings Explained
Form 6K is an SEC filing submitted to the US Securities and Exchange Commission used by certain foreign private issuers to provide information that is:
? Required to be made public in the country of its domicile
? Filed with and made public by a foreign stock exchange on which its securities are traded
? Are distributed to security holders.
The report must be furnished promptly after such material is made public. The form is not considered "filed" because of Section 18 (for liability purposes). This is the only information furnished by foreign private issuers between annual reports, since such issuers are not required to file on Forms 10-Q or 8-K.
UPSIDE GAP TWO CROWS
The Bearish Upside Gap Two Crows Pattern is a three-candlestick pattern and it signals a top reversal. The first candlestick is a long white candlestick followed by a real body that gaps higher. Then another black real body appears, which opens above the second day’s open and closes under the second day’s close, completing the pattern
Recognition Criteria:
1. Market is characterized by uptrend.
2. We see a long white candlestick in the first day that signals the continuation of uptrend.
3. Then we see a black body with a gap up on second day.
4. The third day is characterized by another black candlestick having an opening above the first black day and also closing below the body of the first black day. The body of third day engulfs the body of the first day.
5. The close of the second black candlestick is still above the close of the first long white candlestick.
Explanation:
The market is in an uptrend and it displays a higher opening with a gap. However the new highs of the day cannot hold and the market forms a black candlestick. However the bulls still comfort themselves by the fact that the close on this black candlestick day is still above the prior day’s close. The third day however increases the bearish sentiment displaying another new high but failing to hold these highs until the close. Also the day closes below the prior day’s close, which is another bearish sign. . So the following question becomes relevant. If the market is so strong, why the new highs fail to hold and why market closes lower? The answer is clear. Market is not now as strong as the bulls would like to believe.
Form NT 10-Q ~ SEC Filings Explained
Notice under Rule 12b25 of inability to timely file all or part of a form 10-Q or 10-QSB
Form N-14 ~ SEC Filings Explained
Initial registration statement for open-end investment company
Form 20-F ~ SEC Filings Explained
Form 20-F is an SEC filing submitted to the US Securities and Exchange Commission used by certain foreign private issuers to provide information.
20-F, 20-F/A Annual and transition report of foreign private issuers pursuant to sections 13 or 15(d)
20FR12B, 20FR12B/A Form for initial registration of a class of securities of foreign private issuers pursuant to section 12(b)
20FR12G, 20FR12G/A Form for initial registration of a class of securities of foreign private issuers pursuant to section 12(g)
The postfix /A stands for 'Amendment'
The report must be filed within six months after the end of the fiscal year.
Issuers of ETFs
? AdvisorShares issues actively managed ETFs.
? Bips Investment Managers issues Bips (Beta Investment Performance Securities).
? BNP Paribas issues EasyETFs.
? BlackRock issues iShares.
? Charles Schwab offers several commission-free ETFs for its clients.
? Deutsche Bank issues db x-trackers ETFs, as well as managing PowerShares DB commodity- and currency-based ETFs.
? ETF Securities issues ETFs or specialised commodity ETCs.
? Global X Funds issues ETFs.
? Guggenheim Funds issues specialty Guggenheim Funds ETFs.
? Invesco issues PowerShares ETFs, as well as BLDRS based on American Depositary Receipts.
? Lyxor Asset Management issues Lyxor ETFs.
? Merrill Lynch issues HOLDRs.
? Source UK Services, a European joint-venture between Bank of America Merrill Lynch, Goldman Sachs, Morgan Stanley, Nomura and J. P. Morgan issues ETFs and ETCs
? State Street Global Advisors issues SPDRs.
? Van Eck Global issues Market Vectors ETFs.
? Vanguard Group issues Vanguard ETFs, formerly known as VIPERs.
List of Direxion ETF’s
Symbol Fund Index/Benchmark Daily Target Bloomberg Index Symbol
Long Term Investment
ETFs
KNOW
Direxion All Cap Insider Sentiment Shares
Sabrient Multi-Cap Insider/Analyst Quant-Weighted Index - SBRQAM
INSD
Direxion Large Cap Insider Sentiment Shares
Sabrient Large-Cap Insider/Analyst Quant-Weighted Index - SBRQAL
VSPY
Direxion S
BULLISH MATCHING LOW
Bullish Matching Low Pattern occurs when two black days appear with equal closes in a downtrend. The pattern is suggestive of a short-term support, and it may cause a reversal on the next day of trading.
Recognition Criteria:
1. The market moves in downtrend.
2. We then see a long black candlestick on the first day.
3. Second day follows with another black candlestick whose closing price is equal or extremely close to the closing price of the first day.
Explanation:
Market continues to move down as evidenced by first black candlestick. Next day; prices open at a higher level, they then continue to go up during the day but the day closes at a price which is equal to the closing price of the previous day. This pattern suggests a short-term support. Shorts should be aware of this fact. If they ignore Bullish Matching Low Pattern as a possible reversal signal, they may pay for it soon. Two days closing at the same price is indicative of short-term support and this support may be followed by a reversal on the next day of trading.
Important Factors:
The reversal of downtrend requires a confirmation on the third day. The confirmation of the trend reversal may be in the form of a white candlestick, a large gap up or a higher close on the next trading day (on the third day).
Form N-1A ~ SEC Filings Explained
Initial registration statement for open-end management investment companies
Rising Three Methods
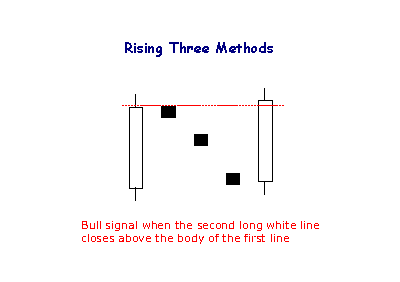
The Rising Method consists of two strong white lines bracketing 3 or 4 small declining black candlesticks. The final white line forms a new closing high. The pattern is definitely bullish.
Form 10-12B, 10-12B/A ~ SEC Filings Explained
Initial general form for registration of a class of securities pursuant to section 12(b) (and amendment thereto)
Moving Average Lengths and Timeframes
The length of the moving average depends on the analytical objectives. Short moving averages (5-20 periods) are best suited for short-term trends and trading. Chartists interested in medium-term trends would opt for longer moving averages that might extend 20-60 periods. Long-term investors will prefer moving averages with 100 or more periods.
Some moving average lengths are more popular than others. The 200-day moving average is perhaps the most popular. Because of its length, this is clearly a long-term moving average. Next, the 50-day moving average is quite popular for the medium-term trend. Many chartists use the 50-day and 200-day moving averages together. Short-term, a 10-day moving average was quite popular in the past because it was easy to calculate. One simply added the numbers and moved the decimal point.
Form S-4 ~ SEC Filings Explained
Registration of securities issued in business combination transactions
Candlestick Charts
The Japanese have been using candlestick charts since the 17th century to analyze rice prices. Candlesticks were introduced into modern technical analysis by Steve Nison in his book Japanese Candlestick Charting Techniques.
Candlesticks contain the same data as a normal bar chart but highlight the relationship between opening and closing prices. The narrow stick represents the range of prices traded during the period (high to low) while the broad mid-section represents the opening and closing prices for the period.
If the close is higher than the open - the candlestick mid-section is hollow or shaded blue/green.
If the open is higher than the close - the candlestick mid-section is filled in or shaded red.
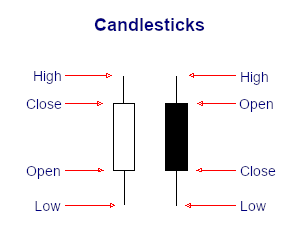
The advantage of candlestick charts is the ability to highlight trend weakness and reversal signals that may not be apparent on a normal bar chart.
Form 11-KT, 11-KT/A ~ SEC Filings Explained
Transition report pursuant to Rule 13a-10 or 15d-10 (and amendment thereto)
Currency ETFs or ETCs
In 2005, Rydex Investments launched the first ever currency ETF called the Euro Currency Trust (NYSE: FXE) in New York. Since then Rydex has launched a series of funds tracking all major currencies under their brand CurrencyShares. In 2007Deutsche Bank's db x-trackers launched EONIA Total Return Index ETF in Frankfurt tracking the euro, and later in 2008 the Sterling Money Market ETF (LSE: XGBP) and US Dollar Money Market ETF (LSE: XUSD) in London. In 2009, ETF Securitieslaunched the world's largest FX platform tracking the MSFXSM Index covering 18 long or short USD ETC vs. single G10 currencies. The funds are total return products where the investor gets access to the FX spot change, local institutional interest rates and a collateral yield.
Inverted Hammer

The Inverted Hammer is a type of bullish reversal pattern. As its name implies, the Inverted Hammer looks like an upside down version of the hammer candlestick pattern. Like the hammer candlestick pattern, the Inverted Hammer consists of one candle and when found in a downtrend is considered a potential reversal pattern.
The pattern is made up of a candle with a small lower body and a long upper wick which is at least two times as large as the short lower body. The body of the candle should be at the low end of the trading range and there should be little or no lower wick in the candle.

The long upper wick of the candlestick pattern indicates that the buyers drove prices up at some point during the period in which the candle was formed but encountered selling pressure which drove prices back down for the period to close near to where they opened. As this occurred in an uptrend the selling pressure is seen as a potential reversal sign. When encountering the Inverted Hammer traders will look for a higher open on the next period before considering the pattern confirmed and potentially including it in their trading strategy.
|
Followers
|
3285
|
Posters
|
|
|
Posts (Today)
|
0
|
Posts (Total)
|
2804248
|
|
Created
|
08/22/10
|
Type
|
Free
|
| Moderator Nilbud | |||
| Assistants mick ManicTrader PhotoChick Kirimi $Pistol Pete$ | |||
   Investor Hub Alerts: Sign up for 'STOCKGOODIES PLAYS OF THE WEEK ' E-Mail List Investor Hub Alerts: Sign up for 'STOCKGOODIES PLAYS OF THE WEEK ' E-Mail ListUPDATE; 5-1-22 courtesy of charting /\ wit tweezer top calls /\ Tony @Montana_Trades Really good study sheet on Candlestick Patterns [-chart]pbs.twimg.com/media/FRn8188XMAAdZvk?format=jpg&name=small[/chart] 

02-07-2021
|
|
Posts Today
|
0
|
|
Posts (Total)
|
2804248
|
|
Posters
|
|
|
Moderator
|
|
|
Assistants
|
| Volume | |
| Day Range: | |
| Bid Price | |
| Ask Price | |
| Last Trade Time: |


